| Param | Original file | Final file |
|---|---|---|
| Filename | modeM0/AS1G08_065T01_9000001796_12104cztM0_level2.evt | modeM0/AS1G08_065T01_9000001796_12104cztM0_level2_quad_clean.evt |
| Size (bytes) | 625,196,160 | 106,560,000 |
| Size | 596.2 MB | 101.6 MB |
| Events in quadrant A | 4,513,430 | 684,230 |
| Events in quadrant B | 4,738,982 | 679,199 |
| Events in quadrant C | 3,542,549 | 689,762 |
| Events in quadrant D | 5,617,925 | 638,797 |
| Mode M0 | |||
|---|---|---|---|
| Quadrant | BADHDUFLAG | Total packets | Discarded packets |
| A | 0 | 18723 | 3 |
| B | 0 | 19368 | 2 |
| C | 0 | 15996 | 2 |
| D | 0 | 21833 | 2 |
| Mode M9 | |||
|---|---|---|---|
| Quadrant | BADHDUFLAG | Total packets | Discarded packets |
| A | 0 | 10 | 0 |
| B | 0 | 10 | 0 |
| C | 0 | 10 | 0 |
| D | 0 | 10 | 0 |
| Mode SS | |||
|---|---|---|---|
| Quadrant | BADHDUFLAG | Total packets | Discarded packets |
| A | 0 | 160 | 0 |
| B | 0 | 160 | 0 |
| C | 0 | 160 | 0 |
| D | 0 | 160 | 0 |
| Quadrant | Total seconds | Saturated seconds | Saturation percentage |
|---|---|---|---|
| A | 7689 | 353 | 4.590974% |
| B | 7689 | 433 | 5.631422% |
| C | 7689 | 43 | 0.559240% |
| D | 7689 | 540 | 7.023020% |
Noise dominated data is calculated using 1-second bins in cleaned event files. If a bin has >2000 counts, and if more than 50% of those come from <1% of pixels, then it is considered to be noise-dominated and hence unusable.
| Quadrant | # 1 sec bins | Bins with >0 counts | Bins with >2000 counts | High rate bins dominated by noise | Noise dominated (total time) | Noise dominated (detector-on time) | Marked lightcurve |
|---|---|---|---|---|---|---|---|
| A | 8690 | 7693 | 159 | 159 | 1.83% | 2.07% | 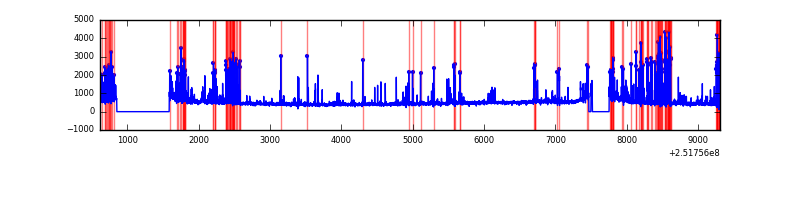 |
| B | 8690 | 7691 | 151 | 151 | 1.74% | 1.96% | 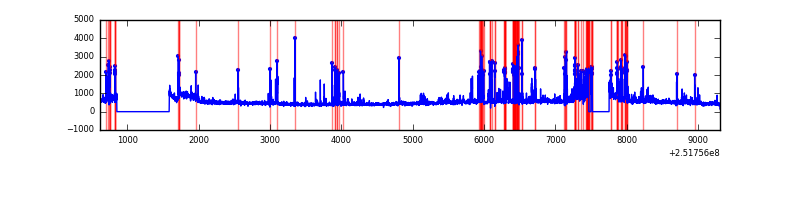 |
| C | 8690 | 7693 | 0 | 0 | 0.00% | 0.00% | 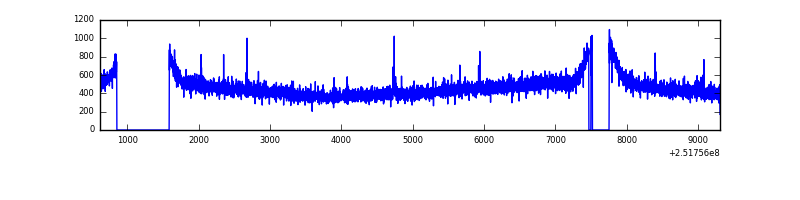 |
| D | 8690 | 7693 | 448 | 448 | 5.16% | 5.82% | 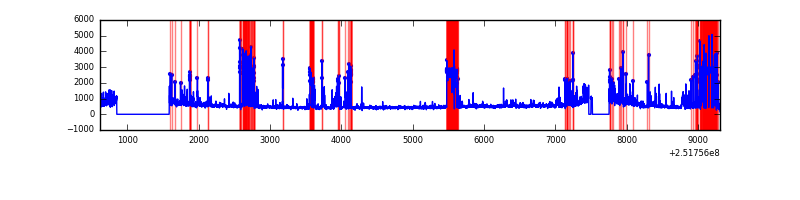 |
Top three noisy pixels from each quadrant. If the there are fewer than three noisy pixels in the level2.evt file, extra rows are filled as -1
| Pixel properties | Quadrant properties | ||||||
|---|---|---|---|---|---|---|---|
| Quadrant | DetID | PixID | Counts | Sigma | Mean | Median | Sigma |
| A | 14 | 63 | 560987 | 2995.46 | 913 | 893 | 187.0 |
| A | 1 | 162 | 151202 | 803.87 | 913 | 893 | 187.0 |
| A | 13 | 248 | 105471 | 559.3 | 913 | 893 | 187.0 |
| B | 4 | 239 | 844962 | 4884.94 | 906 | 881 | 172.8 |
| B | 11 | 51 | 139307 | 801.11 | 906 | 881 | 172.8 |
| B | 0 | 85 | 94408 | 541.27 | 906 | 881 | 172.8 |
| C | 15 | 208 | 9495 | 41.08 | 904 | 907 | 209.1 |
| C | 13 | 61 | 6649 | 27.47 | 904 | 907 | 209.1 |
| C | 14 | 234 | 3982 | 14.71 | 904 | 907 | 209.1 |
| D | 1 | 52 | 808317 | 3864.52 | 867 | 841 | 208.9 |
| D | 14 | 34 | 798118 | 3815.71 | 867 | 841 | 208.9 |
| D | 8 | 195 | 272745 | 1301.31 | 867 | 841 | 208.9 |
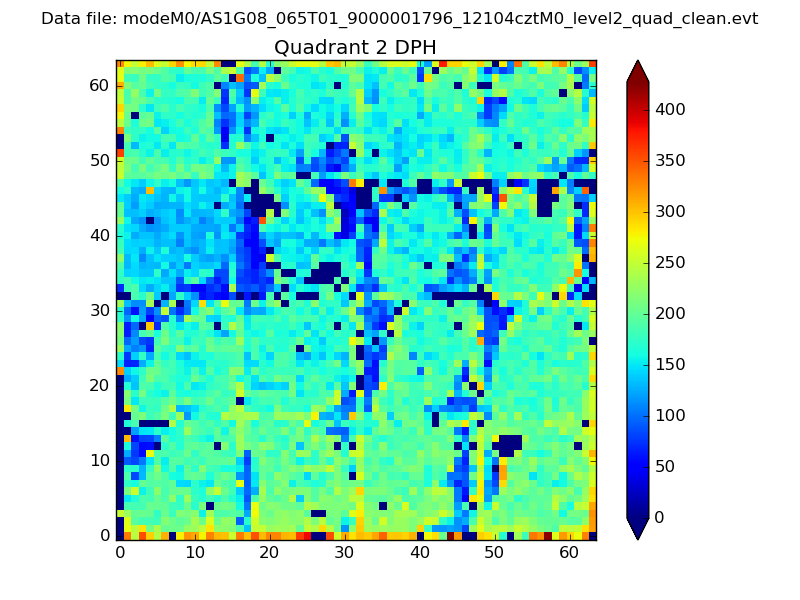
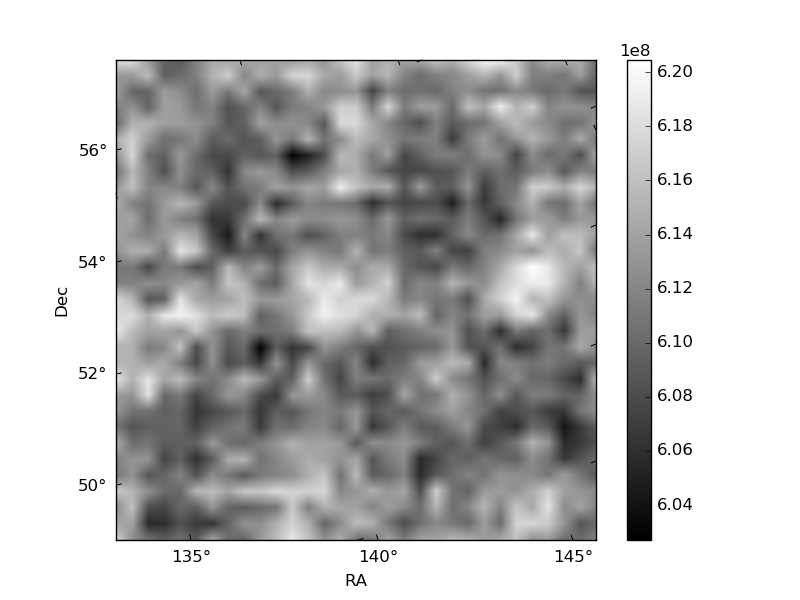
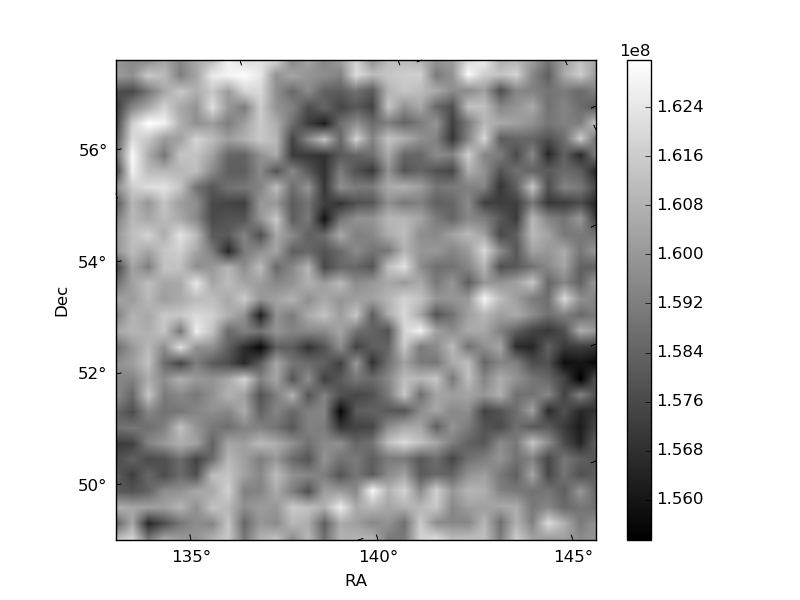
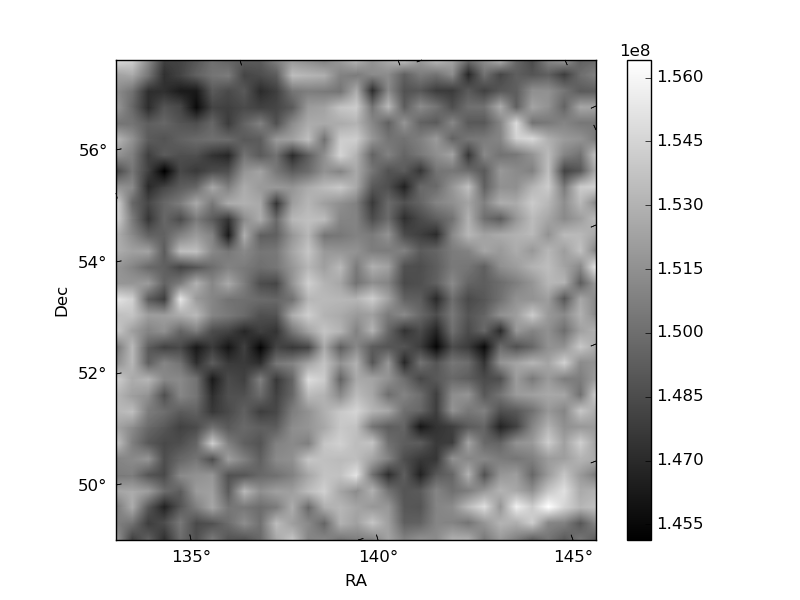
Histogram calculated using DETX and DETY for each event in the final _common_clean file
| Quadrant A | 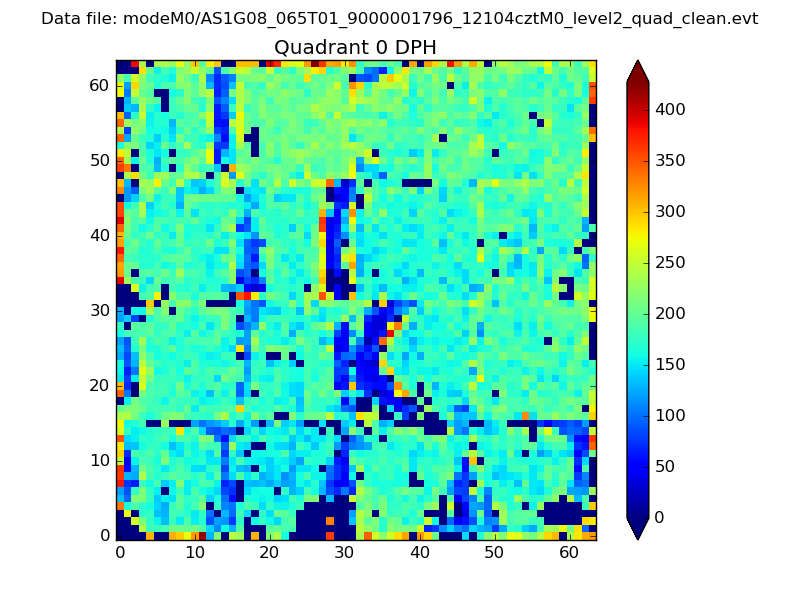 |
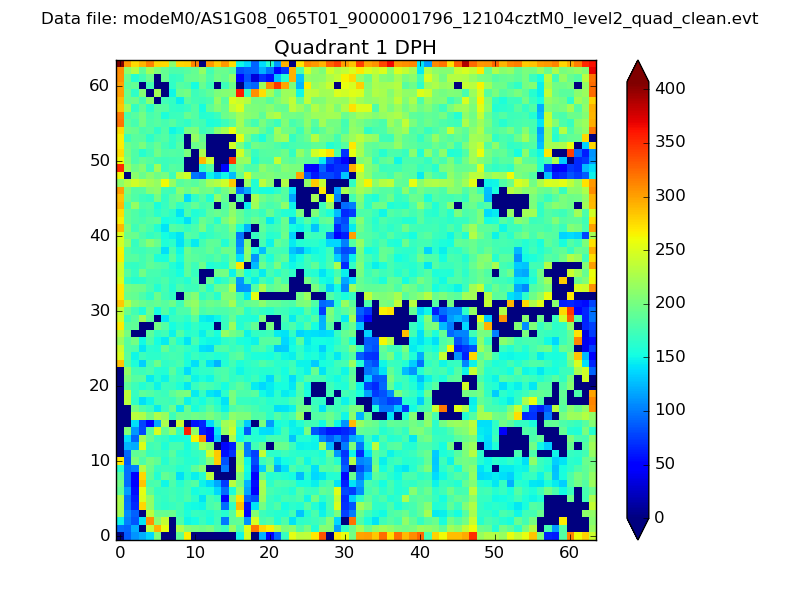 |
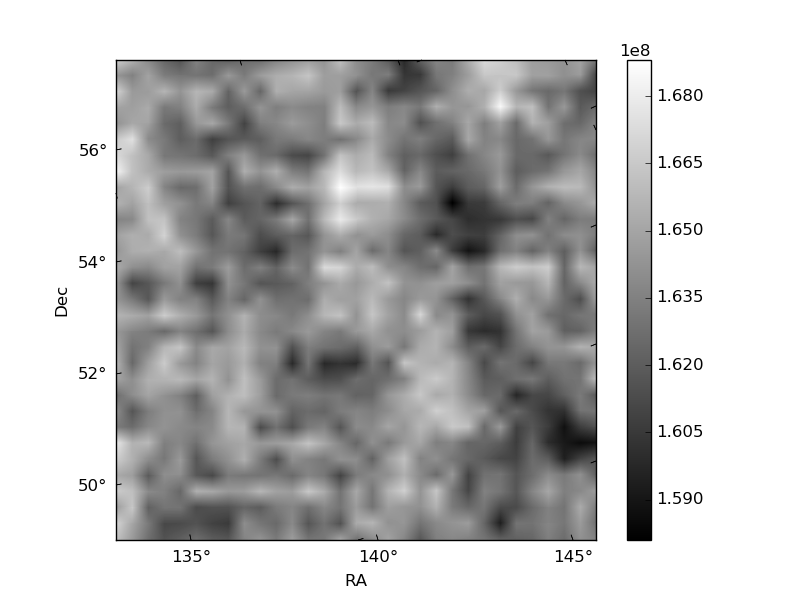
Quadrant B |
|---|---|---|---|
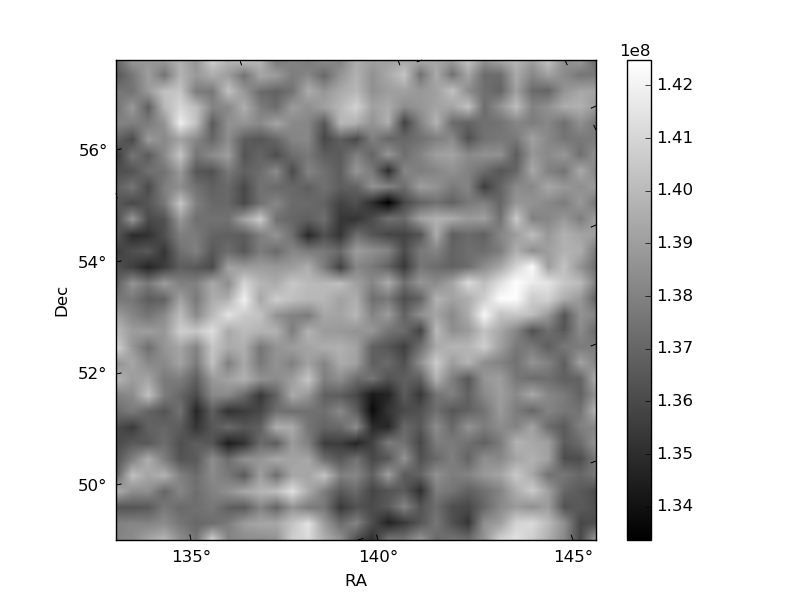
| Quadrant D | 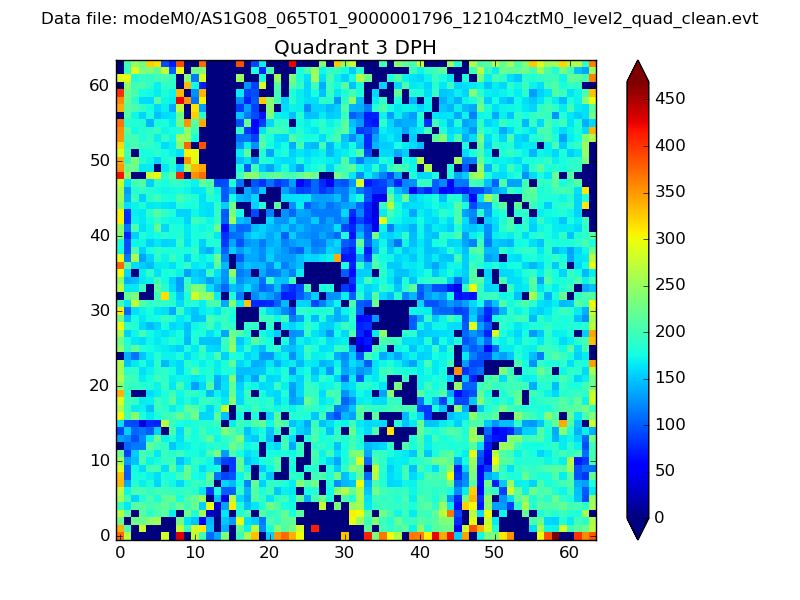 |
 |
Quadrant C |
| Plot type | Count rate plots | Images |
|---|---|---|
| Comparison with Poisson distribution Blue bars denote a histogram of data divided into 1 sec bins. Red curve is a Poisson curve with rate = median count rate of data. |
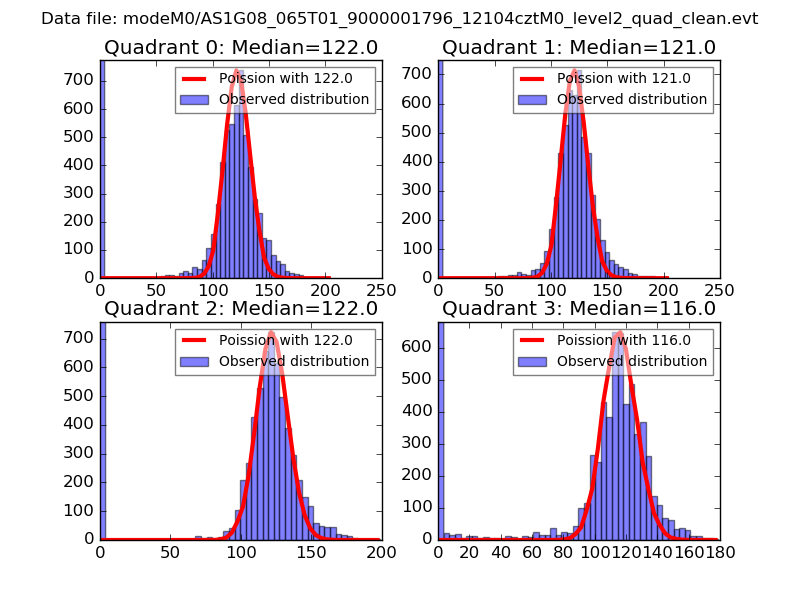 |
 |
| Quadrant-wise count rates Data is divided into 100 sec bins |
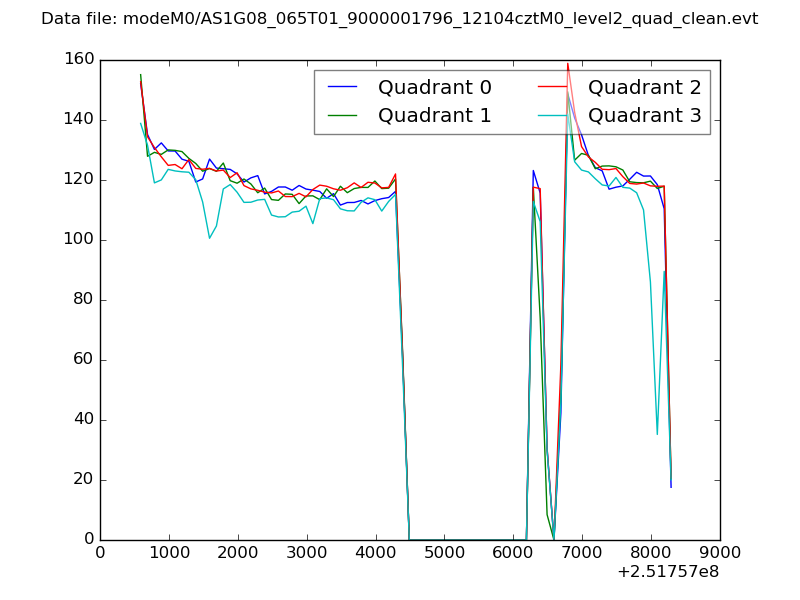 |
|
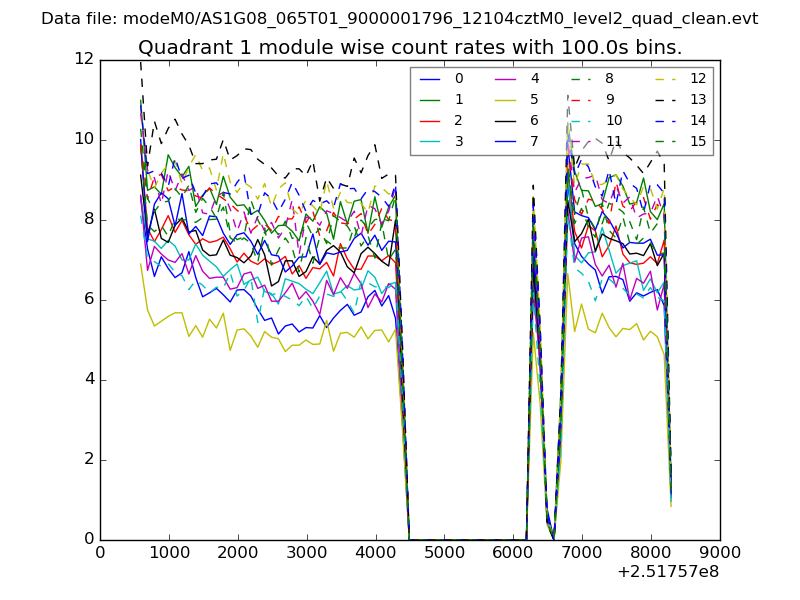
| Module-wise count rates for Quadrant A Data is divided into 100 sec bins |
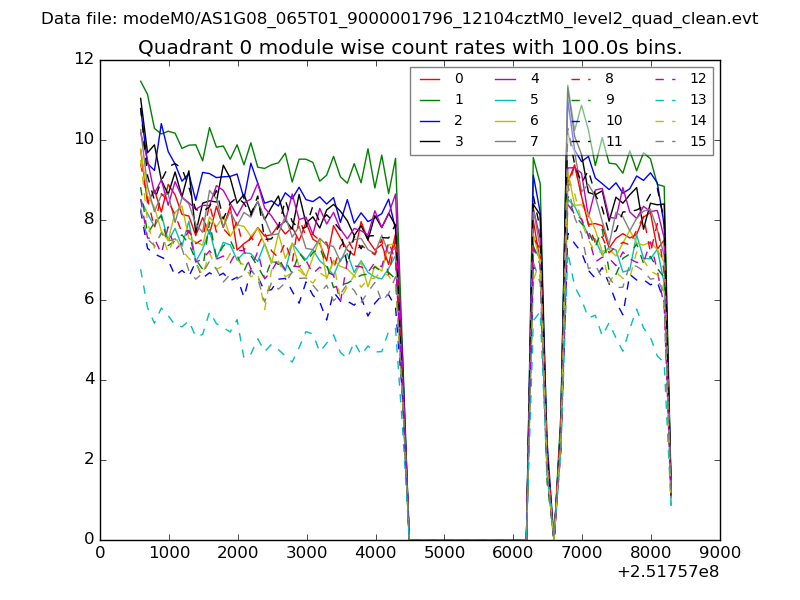 |
 |
| Module-wise count rates for Quadrant B Data is divided into 100 sec bins |
 |
 |
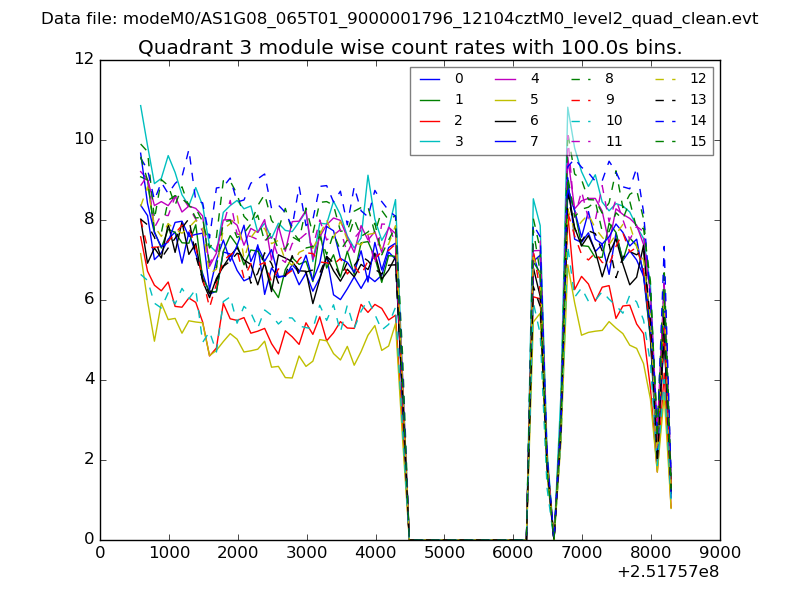
| Module-wise count rates for Quadrant C Data is divided into 100 sec bins |
 |
 |
| Module-wise count rates for Quadrant D Data is divided into 100 sec bins |
 |
 |
| Parameter | Plot |
|---|---|
| CZT HV Monitor |  |
| D_VDD | 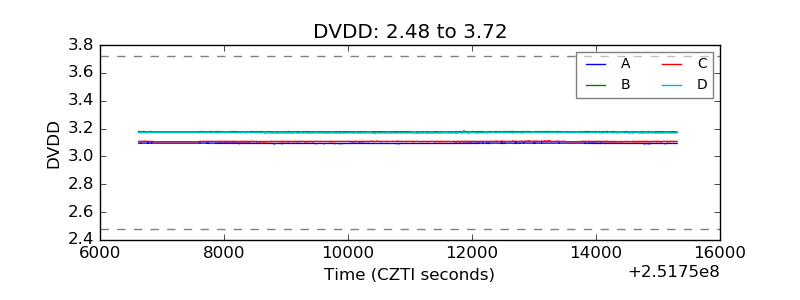 |
| Temperature 1 | 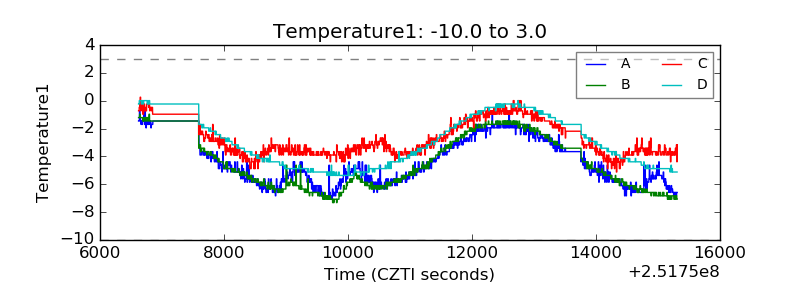 |
| Veto HV Monitor | 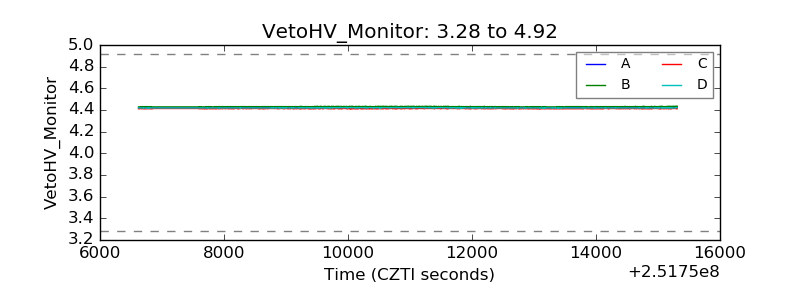 |
| Veto LLD | 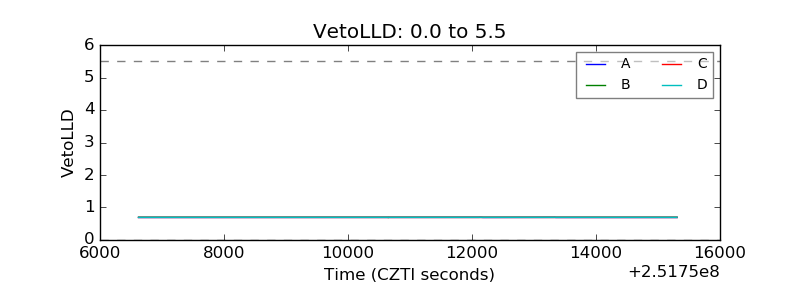 |
| Alpha Counter | 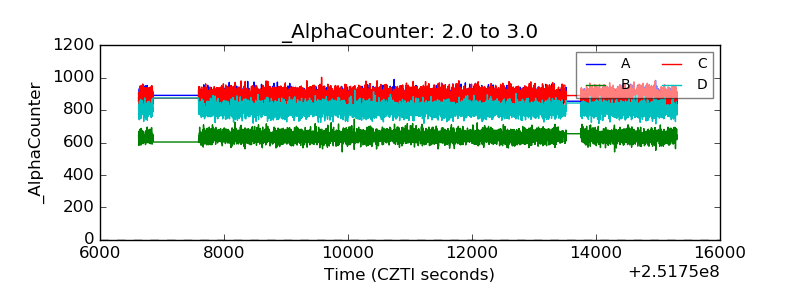 |
| _CPM_Rate | 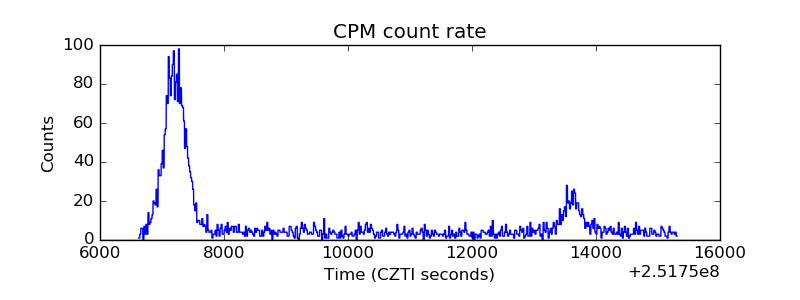 |
| CZT Counter | 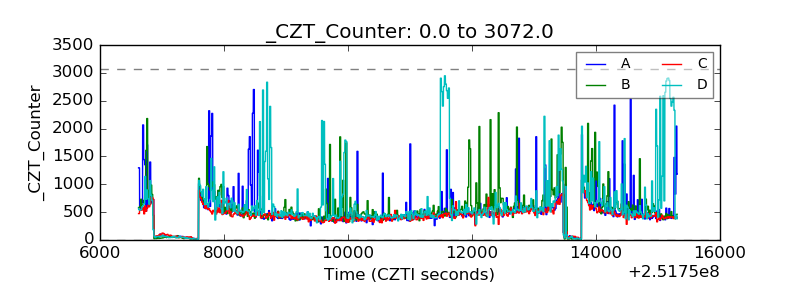 |
| +2.5 Volts monitor |  |
| +5 Volts monitor |  |
| _ROLL_ROT | 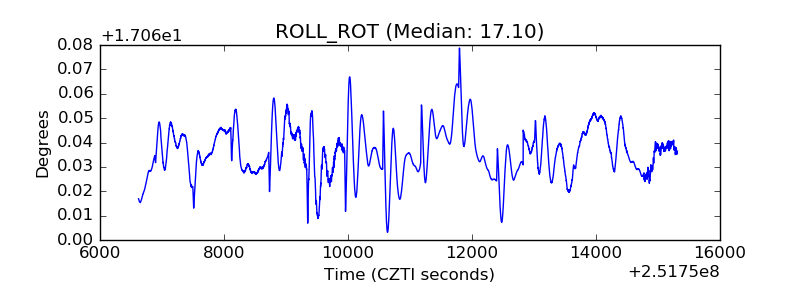 |
| _Roll_DEC | 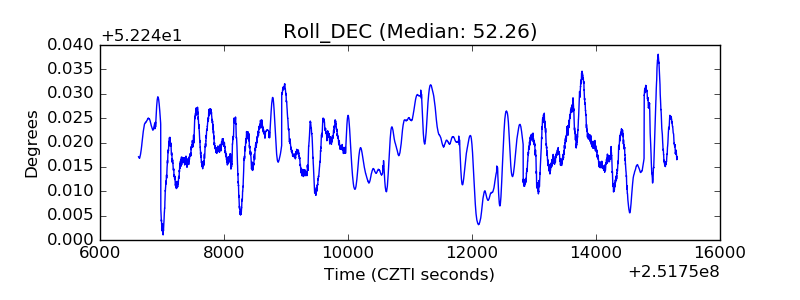 |
| _Roll_RA | 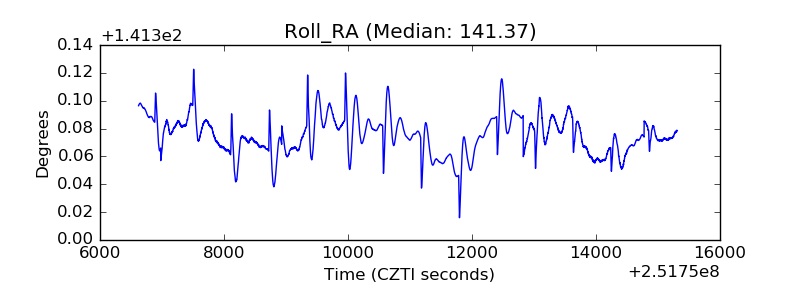 |
| Veto Counter | 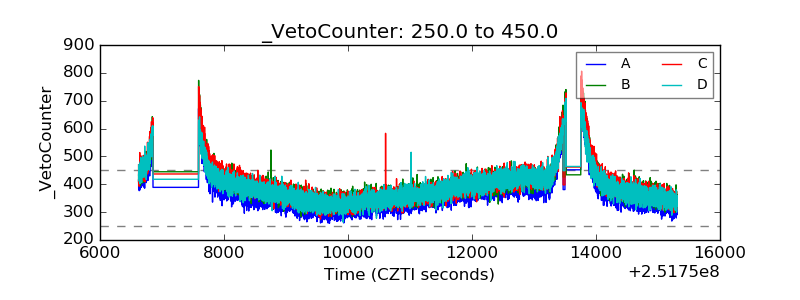 |