| Param | Original file | Final file |
|---|---|---|
| Filename | modeM0/AS1G08_065T01_9000001796_12105cztM0_level2.evt | modeM0/AS1G08_065T01_9000001796_12105cztM0_level2_quad_clean.evt |
| Size (bytes) | 671,250,240 | 115,246,080 |
| Size | 640.2 MB | 109.9 MB |
| Events in quadrant A | 4,711,019 | 748,597 |
| Events in quadrant B | 5,454,082 | 725,560 |
| Events in quadrant C | 3,796,403 | 752,646 |
| Events in quadrant D | 5,817,994 | 699,401 |
| Mode M0 | |||
|---|---|---|---|
| Quadrant | BADHDUFLAG | Total packets | Discarded packets |
| A | 0 | 19509 | 3 |
| B | 0 | 21759 | 2 |
| C | 0 | 17125 | 2 |
| D | 0 | 23041 | 2 |
| Mode M9 | |||
|---|---|---|---|
| Quadrant | BADHDUFLAG | Total packets | Discarded packets |
| A | 0 | 4 | 0 |
| B | 0 | 4 | 0 |
| C | 0 | 4 | 0 |
| D | 0 | 4 | 0 |
| Mode SS | |||
|---|---|---|---|
| Quadrant | BADHDUFLAG | Total packets | Discarded packets |
| A | 0 | 168 | 0 |
| B | 0 | 168 | 0 |
| C | 0 | 168 | 0 |
| D | 0 | 168 | 0 |
| Quadrant | Total seconds | Saturated seconds | Saturation percentage |
|---|---|---|---|
| A | 8111 | 328 | 4.043891% |
| B | 8111 | 646 | 7.964493% |
| C | 8111 | 65 | 0.801381% |
| D | 8111 | 452 | 5.572679% |
Noise dominated data is calculated using 1-second bins in cleaned event files. If a bin has >2000 counts, and if more than 50% of those come from <1% of pixels, then it is considered to be noise-dominated and hence unusable.
| Quadrant | # 1 sec bins | Bins with >0 counts | Bins with >2000 counts | High rate bins dominated by noise | Noise dominated (total time) | Noise dominated (detector-on time) | Marked lightcurve |
|---|---|---|---|---|---|---|---|
| A | 8472 | 8115 | 141 | 141 | 1.66% | 1.74% | 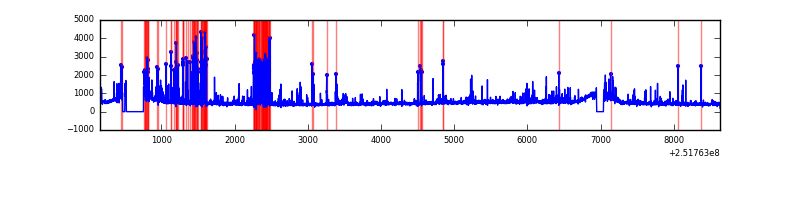 |
| B | 8472 | 8113 | 256 | 256 | 3.02% | 3.16% | 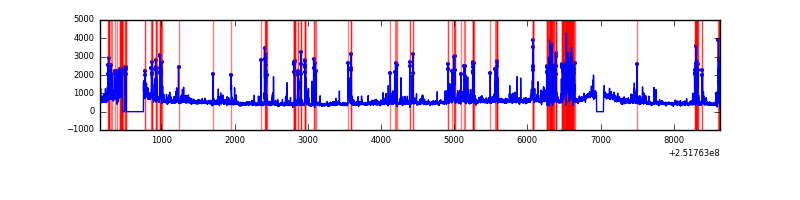 |
| C | 8472 | 8115 | 1 | 1 | 0.01% | 0.01% | 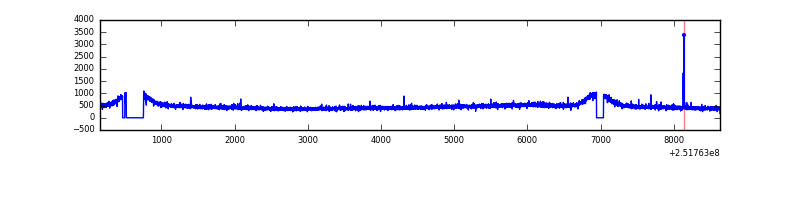 |
| D | 8472 | 8115 | 297 | 297 | 3.51% | 3.66% | 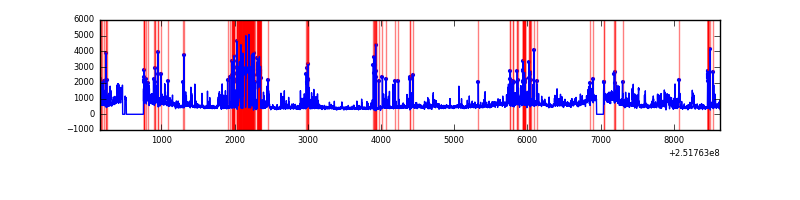 |
Top three noisy pixels from each quadrant. If the there are fewer than three noisy pixels in the level2.evt file, extra rows are filled as -1
| Pixel properties | Quadrant properties | ||||||
|---|---|---|---|---|---|---|---|
| Quadrant | DetID | PixID | Counts | Sigma | Mean | Median | Sigma |
| A | 14 | 63 | 542803 | 2708.11 | 979 | 959 | 200.1 |
| A | 1 | 162 | 154970 | 769.74 | 979 | 959 | 200.1 |
| A | 1 | 178 | 64786 | 319.0 | 979 | 959 | 200.1 |
| B | 4 | 239 | 1391252 | 7545.46 | 957 | 930 | 184.3 |
| B | 11 | 51 | 165623 | 893.81 | 957 | 930 | 184.3 |
| B | 15 | 204 | 74705 | 400.39 | 957 | 930 | 184.3 |
| C | 15 | 208 | 18113 | 76.06 | 966 | 969 | 225.4 |
| C | 13 | 61 | 7083 | 27.12 | 966 | 969 | 225.4 |
| C | 8 | 128 | 3864 | 12.84 | 966 | 969 | 225.4 |
| D | 14 | 34 | 878715 | 3863.15 | 937 | 910 | 227.2 |
| D | 1 | 52 | 616522 | 2709.26 | 937 | 910 | 227.2 |
| D | 8 | 195 | 295425 | 1296.14 | 937 | 910 | 227.2 |
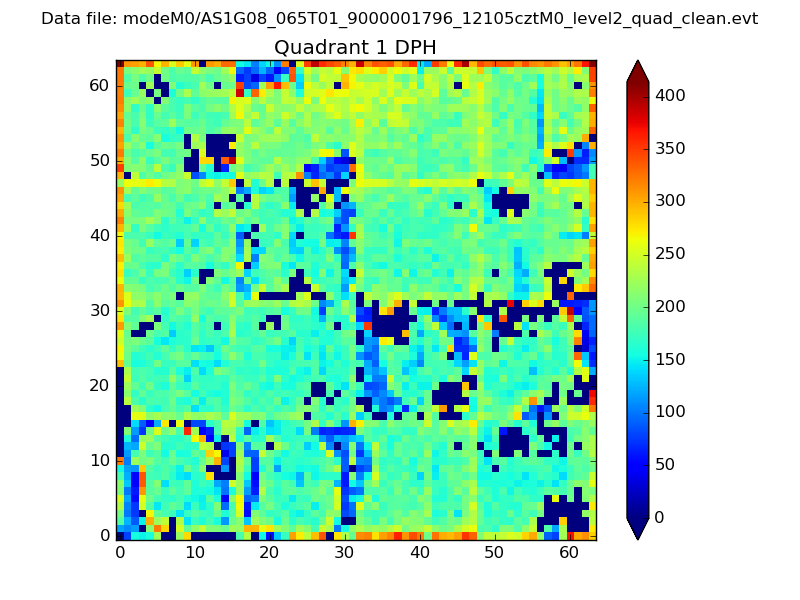
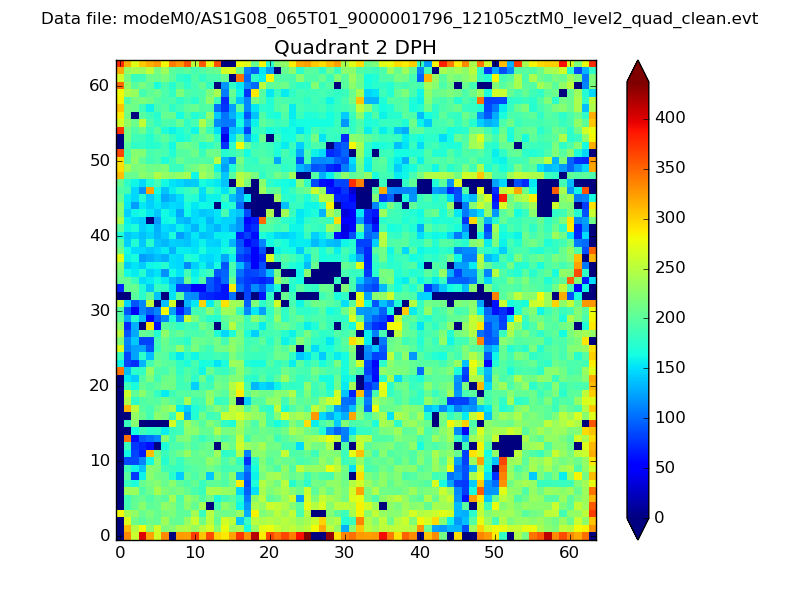
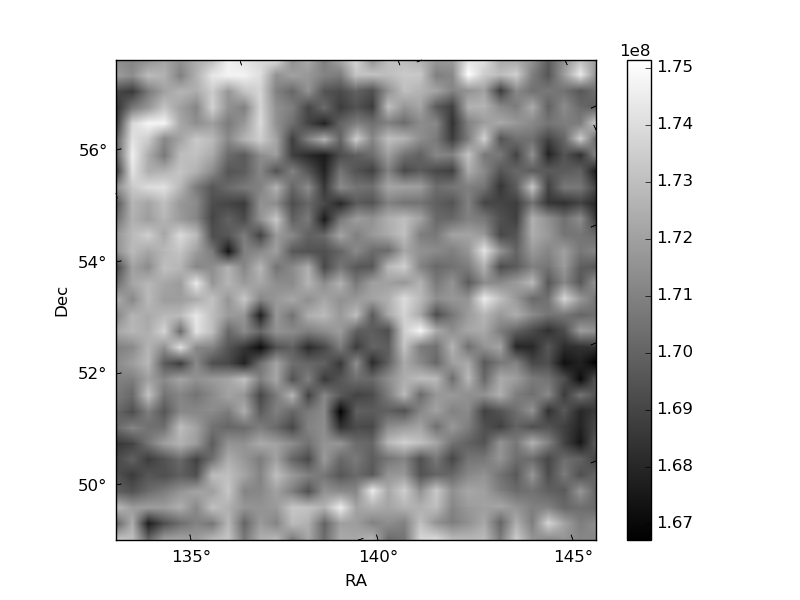
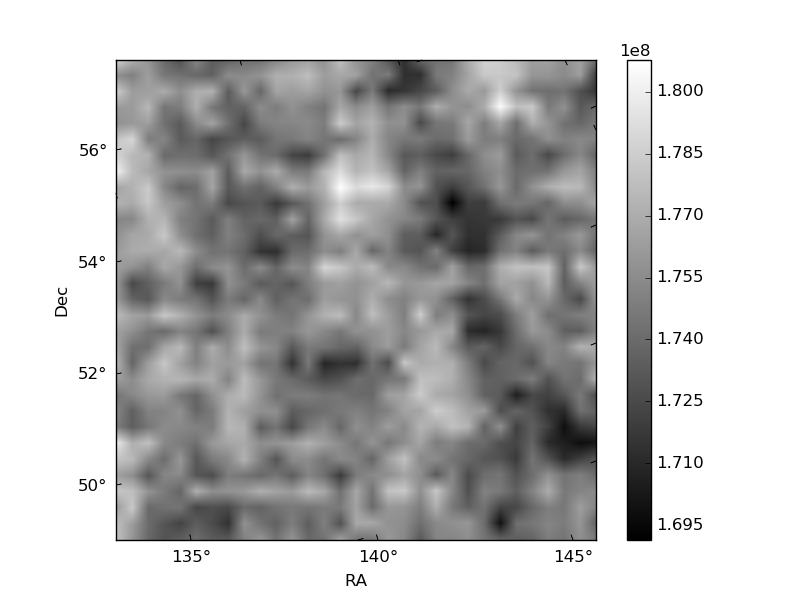
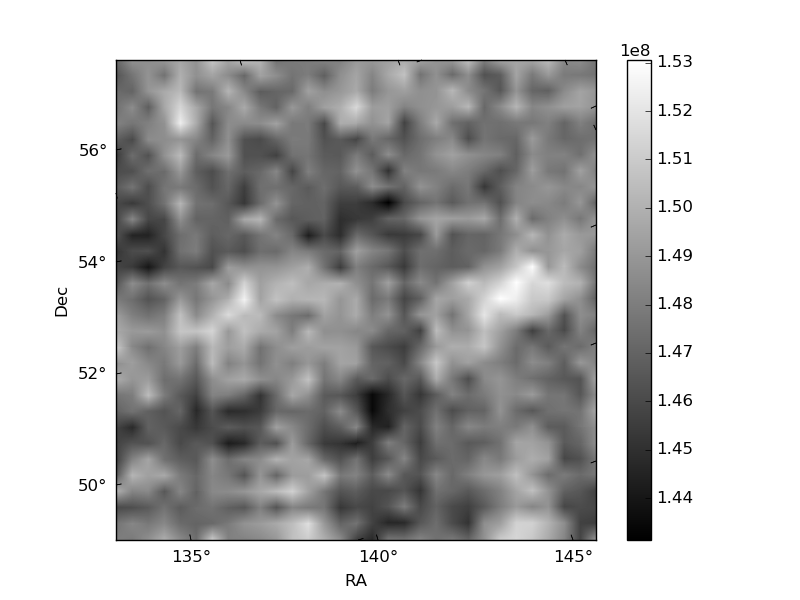
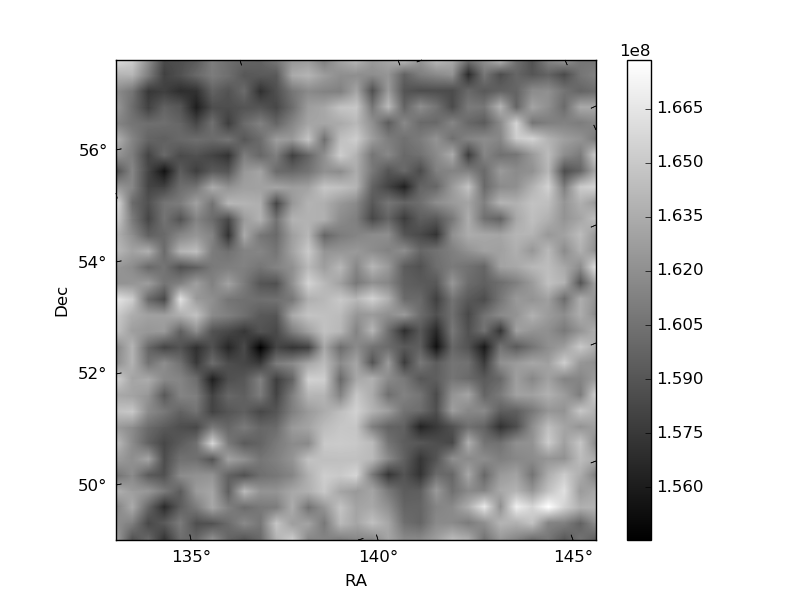
Histogram calculated using DETX and DETY for each event in the final _common_clean file
| Quadrant A |  |
 |
Quadrant B |
|---|---|---|---|
| Quadrant D |  |
 |
Quadrant C |
| Plot type | Count rate plots | Images |
|---|---|---|
| Comparison with Poisson distribution Blue bars denote a histogram of data divided into 1 sec bins. Red curve is a Poisson curve with rate = median count rate of data. |
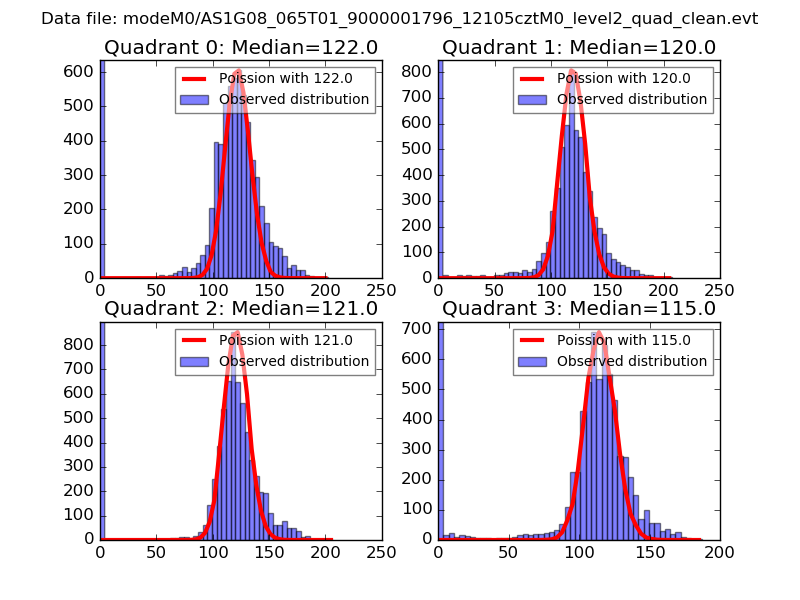 |
 |
| Quadrant-wise count rates Data is divided into 100 sec bins |
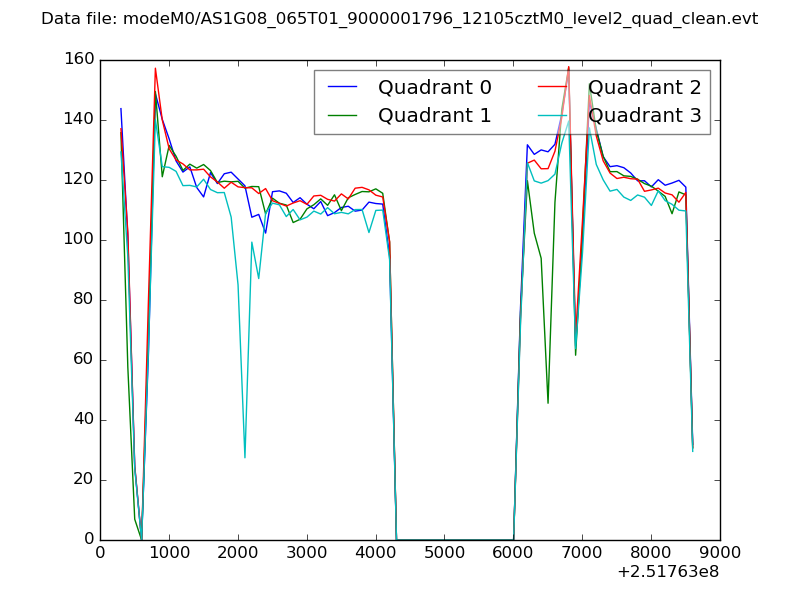 |
|
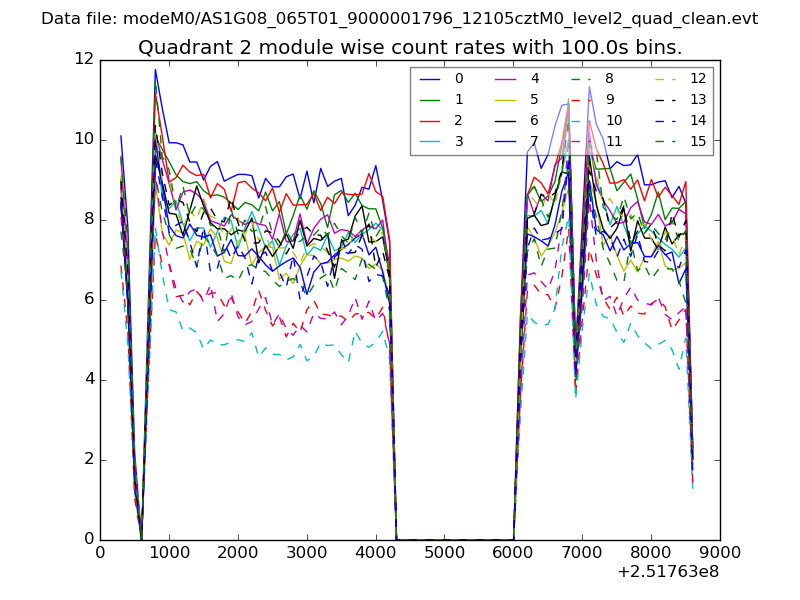
| Module-wise count rates for Quadrant A Data is divided into 100 sec bins |
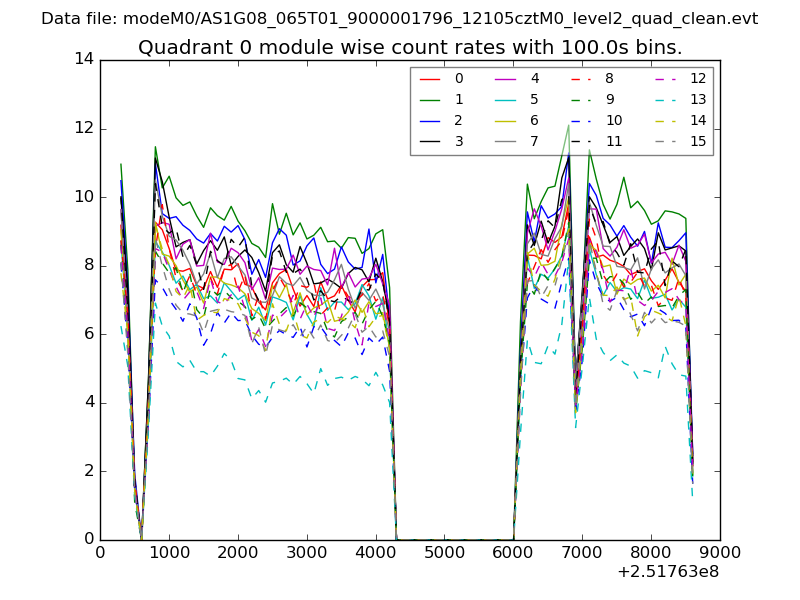 |
 |
| Module-wise count rates for Quadrant B Data is divided into 100 sec bins |
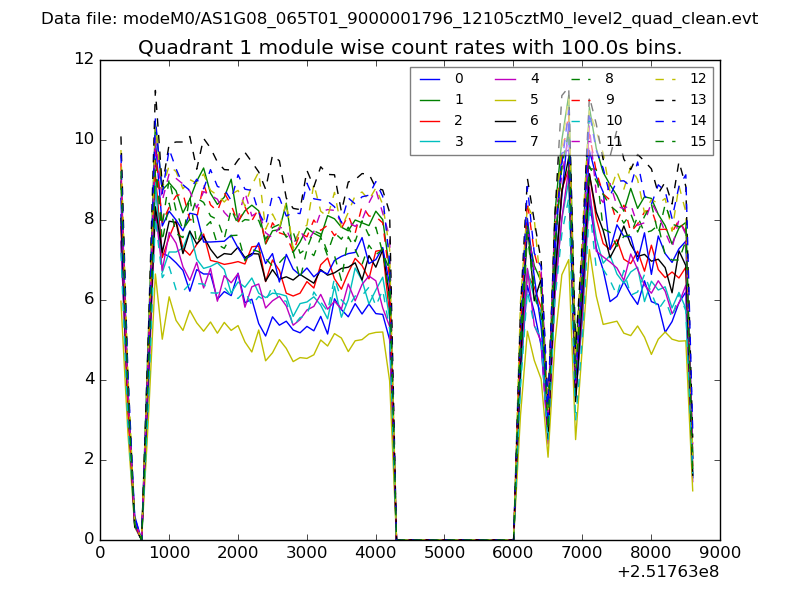 |
 |
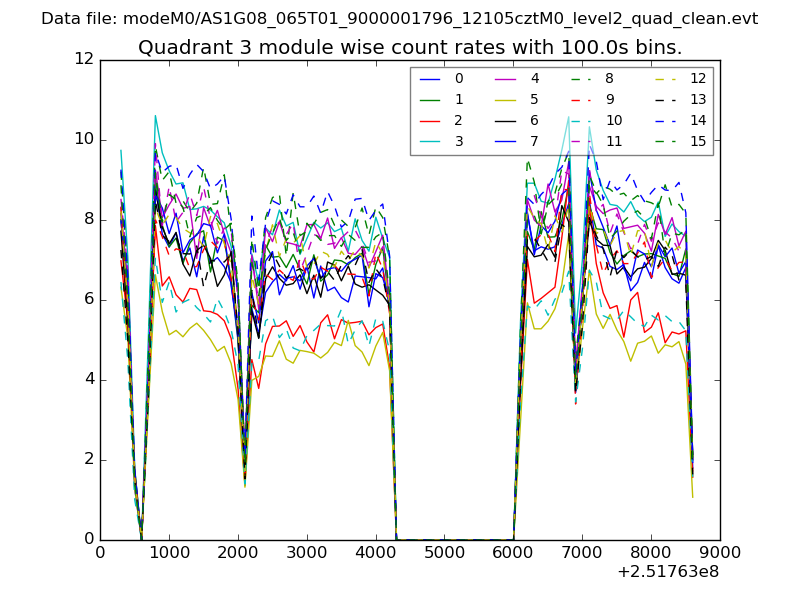
| Module-wise count rates for Quadrant C Data is divided into 100 sec bins |
 |
 |
| Module-wise count rates for Quadrant D Data is divided into 100 sec bins |
 |
 |
| Parameter | Plot |
|---|---|
| CZT HV Monitor | 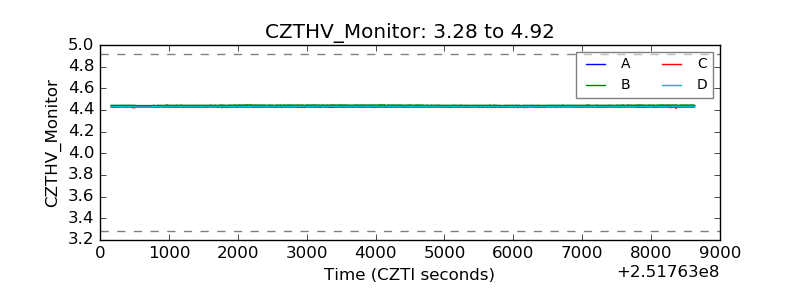 |
| D_VDD | 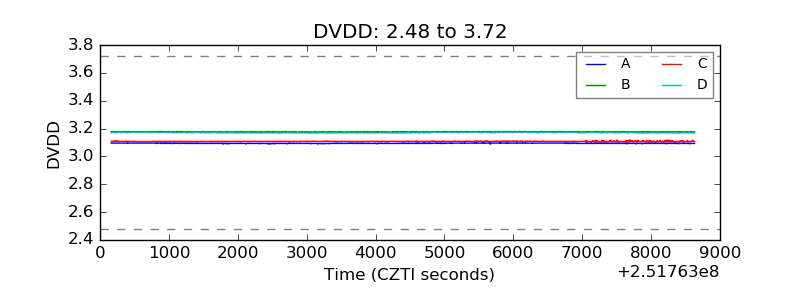 |
| Temperature 1 | 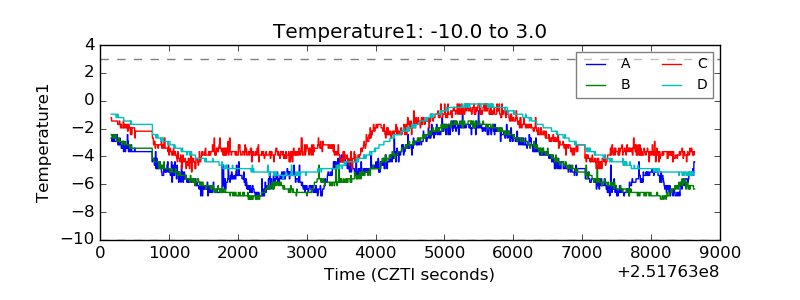 |
| Veto HV Monitor | 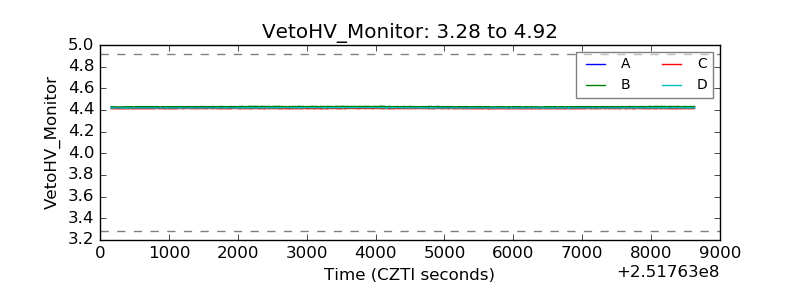 |
| Veto LLD | 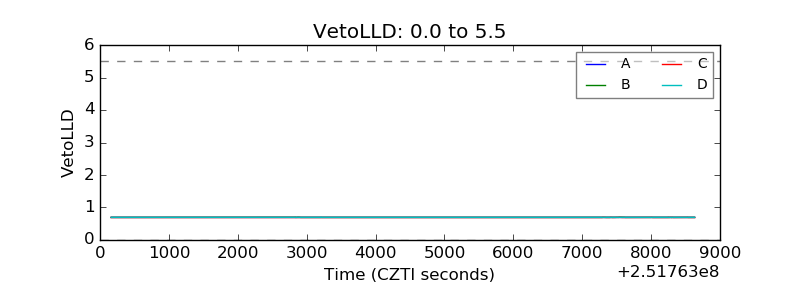 |
| Alpha Counter | 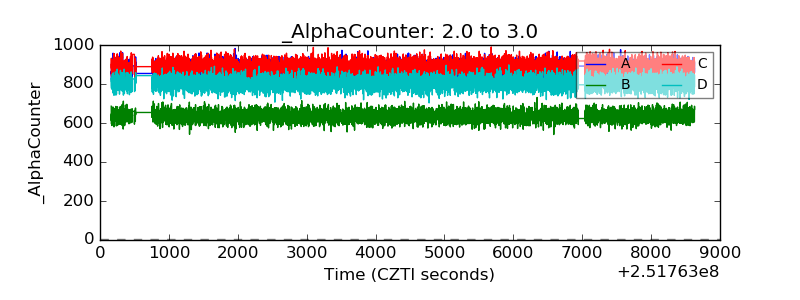 |
| _CPM_Rate | 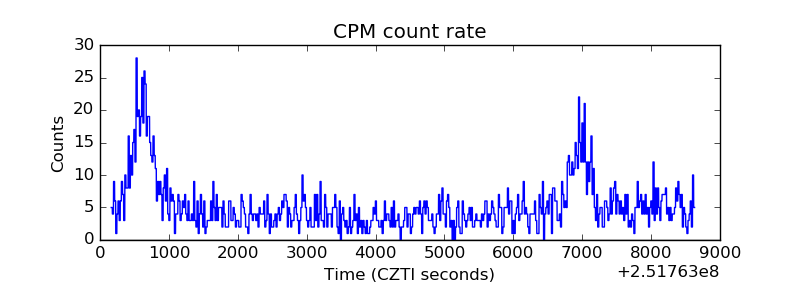 |
| CZT Counter | 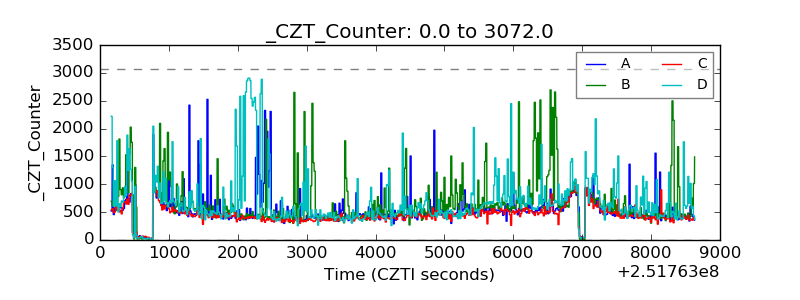 |
| +2.5 Volts monitor |  |
| +5 Volts monitor | 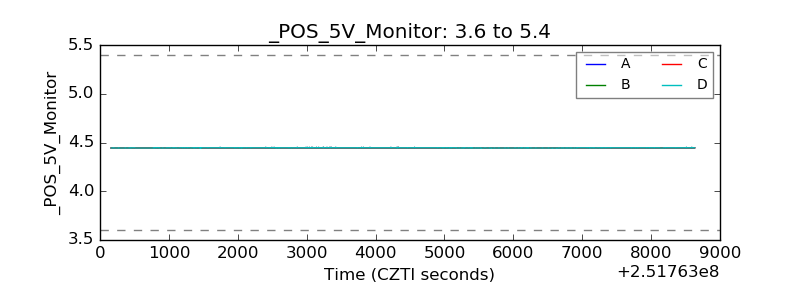 |
| _ROLL_ROT | 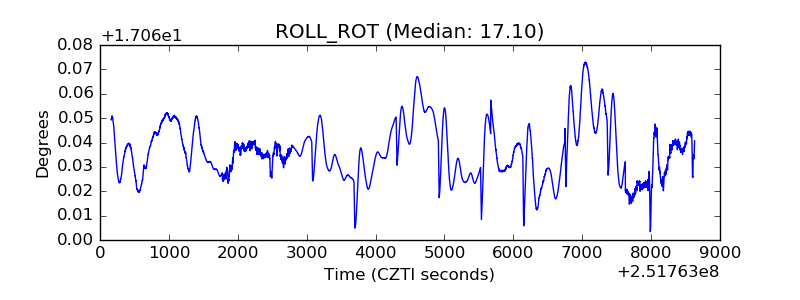 |
| _Roll_DEC | 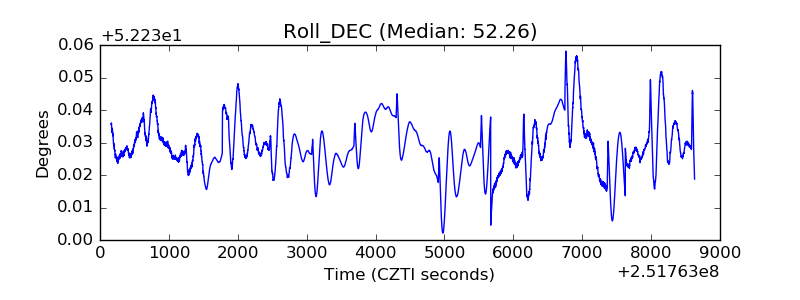 |
| _Roll_RA | 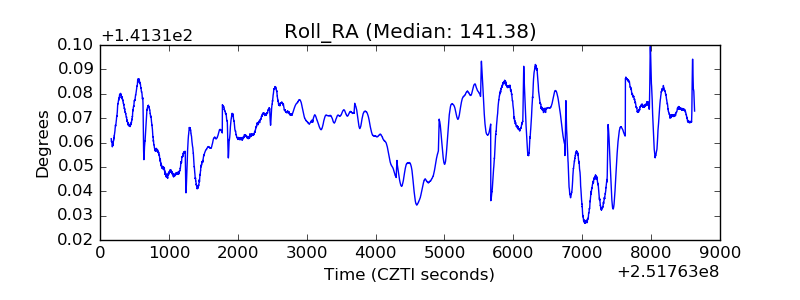 |
| Veto Counter |  |