| Param | Original file | Final file |
|---|---|---|
| Filename | modeM0/AS1G08_065T01_9000001796_12106cztM0_level2.evt | modeM0/AS1G08_065T01_9000001796_12106cztM0_level2_quad_clean.evt |
| Size (bytes) | 667,981,440 | 119,240,640 |
| Size | 637.0 MB | 113.7 MB |
| Events in quadrant A | 4,200,880 | 783,277 |
| Events in quadrant B | 5,965,217 | 739,933 |
| Events in quadrant C | 3,801,130 | 779,094 |
| Events in quadrant D | 5,705,455 | 737,096 |
| Mode M0 | |||
|---|---|---|---|
| Quadrant | BADHDUFLAG | Total packets | Discarded packets |
| A | 0 | 18183 | 3 |
| B | 0 | 23283 | 2 |
| C | 0 | 17258 | 2 |
| D | 0 | 22775 | 2 |
| Mode M9 | |||
|---|---|---|---|
| Quadrant | BADHDUFLAG | Total packets | Discarded packets |
| A | 0 | 4 | 0 |
| B | 0 | 4 | 0 |
| C | 0 | 4 | 0 |
| D | 0 | 4 | 0 |
| Mode SS | |||
|---|---|---|---|
| Quadrant | BADHDUFLAG | Total packets | Discarded packets |
| A | 0 | 168 | 0 |
| B | 0 | 168 | 0 |
| C | 0 | 168 | 0 |
| D | 0 | 168 | 0 |
| Quadrant | Total seconds | Saturated seconds | Saturation percentage |
|---|---|---|---|
| A | 8225 | 199 | 2.419453% |
| B | 8225 | 746 | 9.069909% |
| C | 8225 | 77 | 0.936170% |
| D | 8225 | 386 | 4.693009% |
Noise dominated data is calculated using 1-second bins in cleaned event files. If a bin has >2000 counts, and if more than 50% of those come from <1% of pixels, then it is considered to be noise-dominated and hence unusable.
| Quadrant | # 1 sec bins | Bins with >0 counts | Bins with >2000 counts | High rate bins dominated by noise | Noise dominated (total time) | Noise dominated (detector-on time) | Marked lightcurve |
|---|---|---|---|---|---|---|---|
| A | 8661 | 8229 | 22 | 22 | 0.25% | 0.27% | 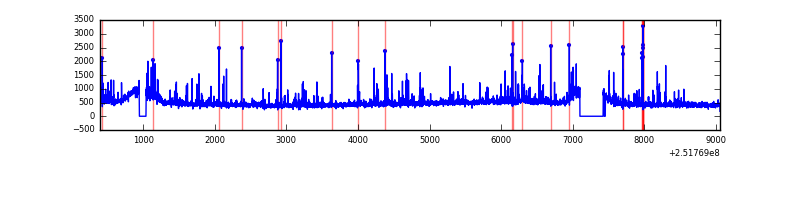 |
| B | 8661 | 8229 | 354 | 354 | 4.09% | 4.30% | 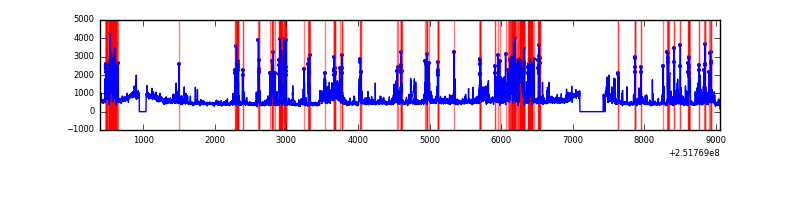 |
| C | 8661 | 8229 | 1 | 1 | 0.01% | 0.01% | 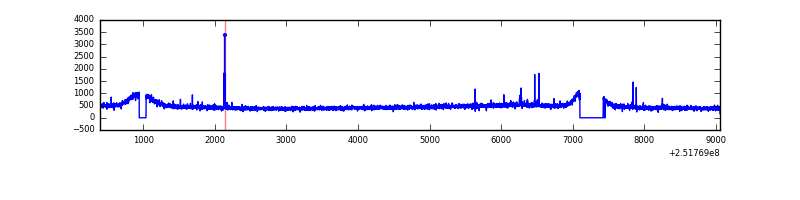 |
| D | 8661 | 8229 | 222 | 222 | 2.56% | 2.70% | 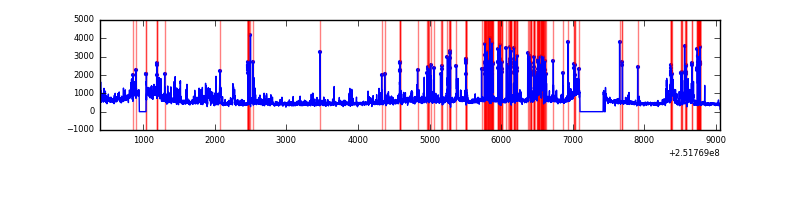 |
Top three noisy pixels from each quadrant. If the there are fewer than three noisy pixels in the level2.evt file, extra rows are filled as -1
| Pixel properties | Quadrant properties | ||||||
|---|---|---|---|---|---|---|---|
| Quadrant | DetID | PixID | Counts | Sigma | Mean | Median | Sigma |
| A | 1 | 162 | 154446 | 764.45 | 984 | 965 | 200.8 |
| A | 1 | 178 | 66441 | 326.12 | 984 | 965 | 200.8 |
| A | 1 | 161 | 63175 | 309.85 | 984 | 965 | 200.8 |
| B | 4 | 239 | 1909544 | 10452.86 | 950 | 927 | 182.6 |
| B | 15 | 204 | 166003 | 904.07 | 950 | 927 | 182.6 |
| B | 11 | 51 | 123172 | 669.5 | 950 | 927 | 182.6 |
| C | 15 | 208 | 22364 | 95.47 | 961 | 965 | 224.1 |
| C | 8 | 128 | 11003 | 44.78 | 961 | 965 | 224.1 |
| C | 14 | 234 | 10713 | 43.49 | 961 | 965 | 224.1 |
| D | 1 | 52 | 1213974 | 5295.84 | 937 | 909 | 229.1 |
| D | 8 | 195 | 398543 | 1735.94 | 937 | 909 | 229.1 |
| D | 4 | 95 | 230592 | 1002.72 | 937 | 909 | 229.1 |
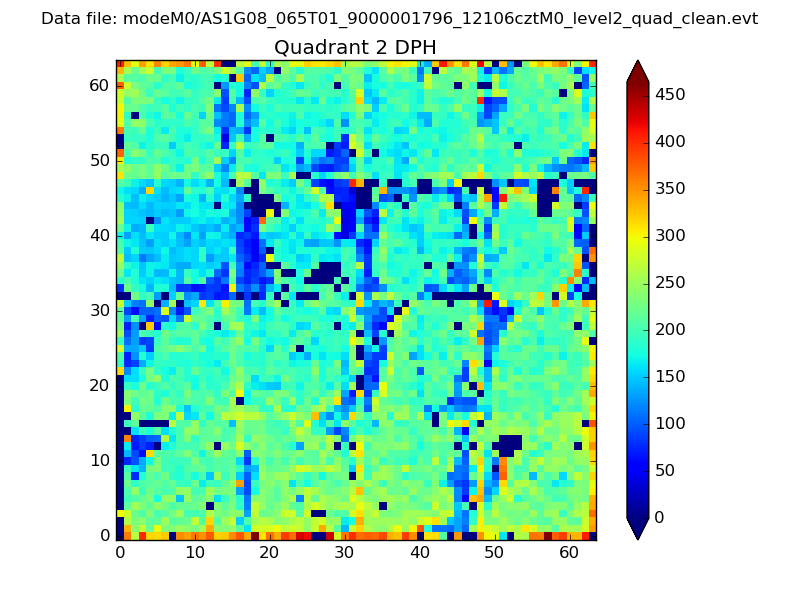
Histogram calculated using DETX and DETY for each event in the final _common_clean file
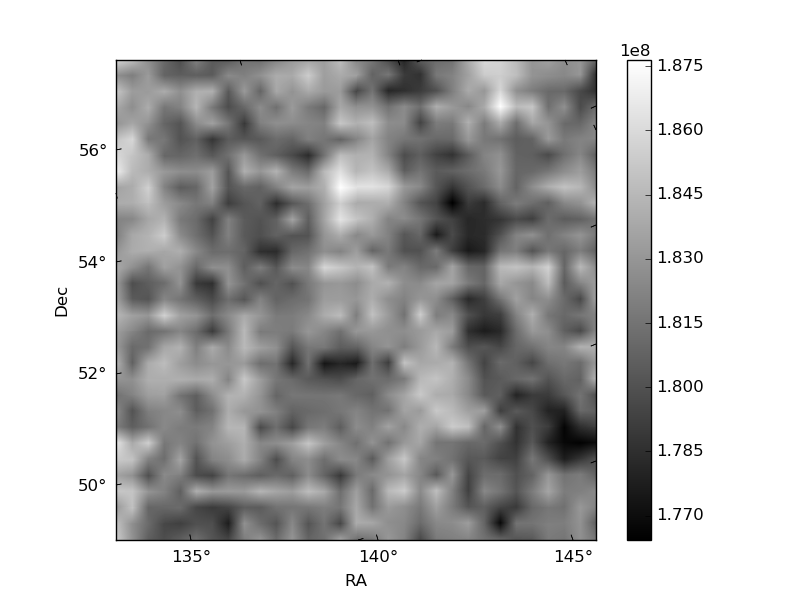
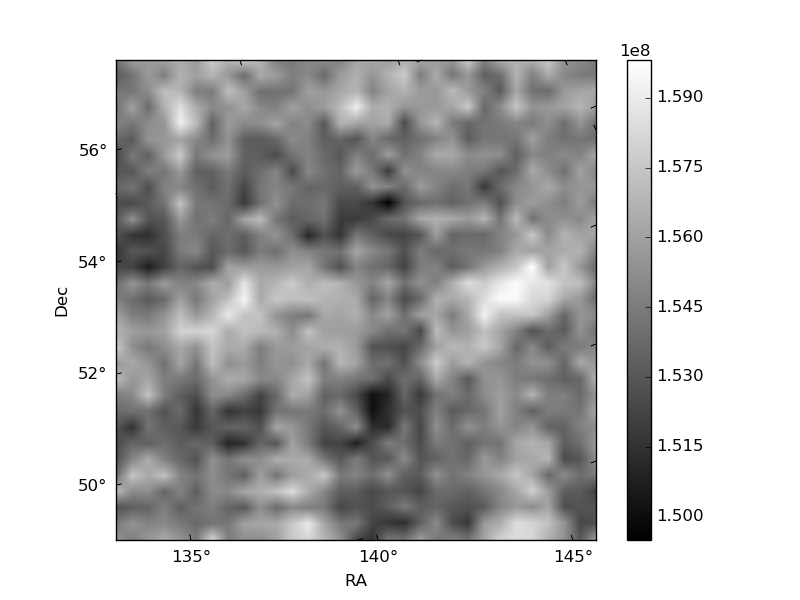
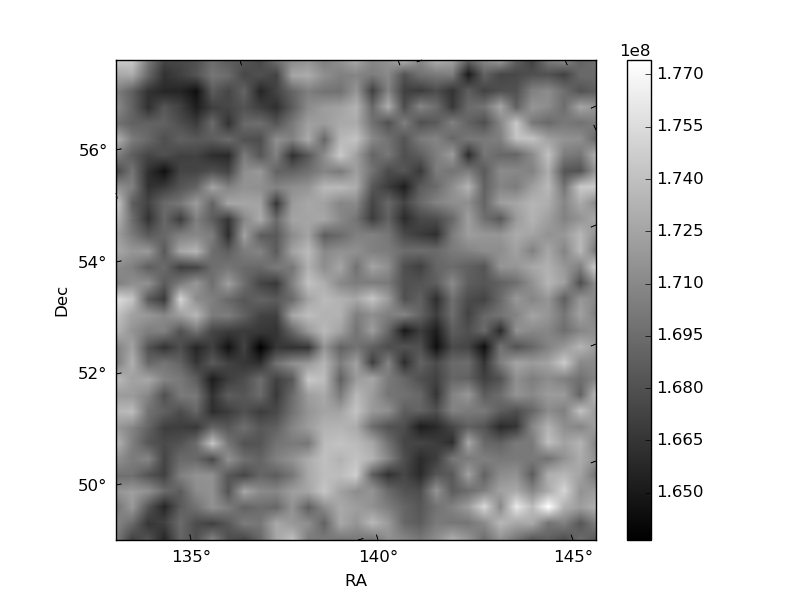
| Quadrant A | 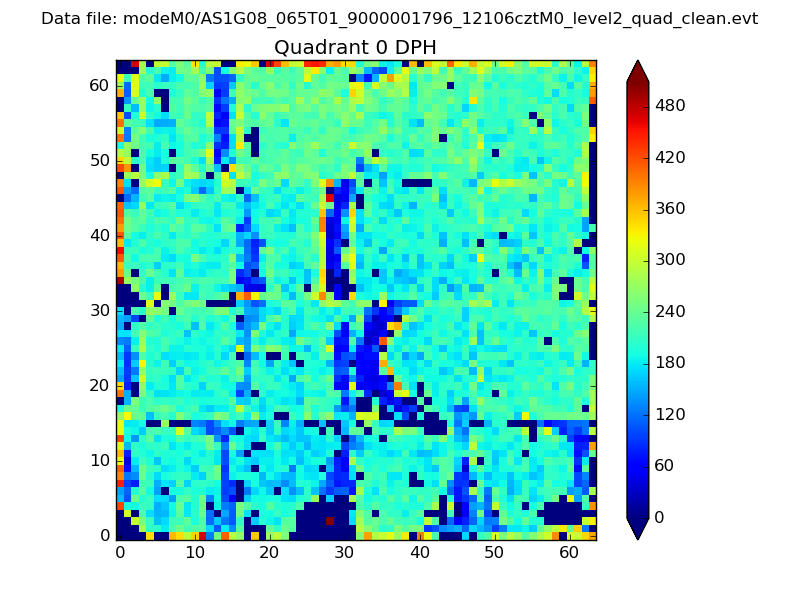 |
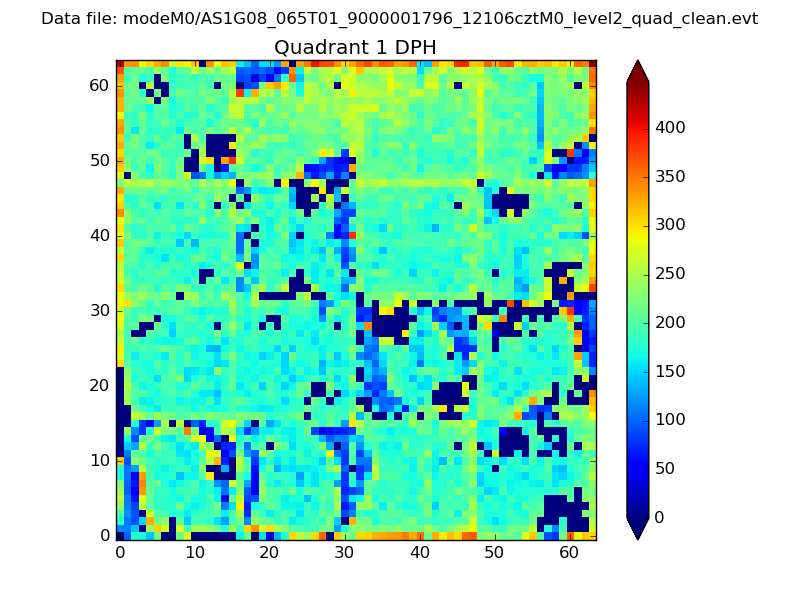 |
Quadrant B |
|---|---|---|---|
| Quadrant D | 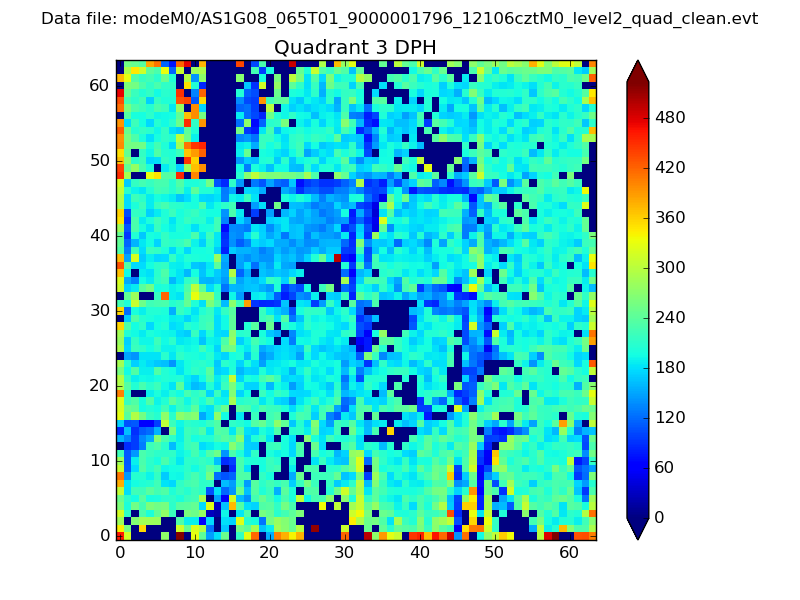 |
 |
Quadrant C |
| Plot type | Count rate plots | Images |
|---|---|---|
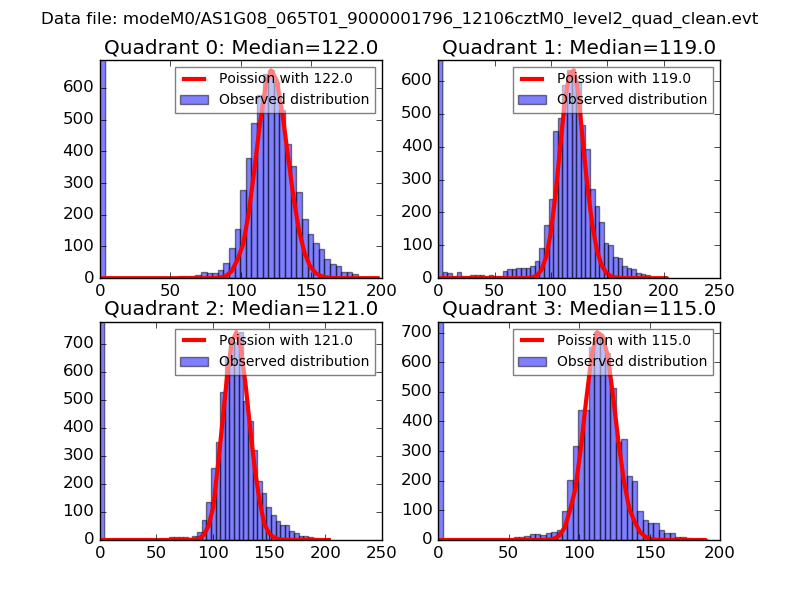
| Comparison with Poisson distribution Blue bars denote a histogram of data divided into 1 sec bins. Red curve is a Poisson curve with rate = median count rate of data. |
 |
 |
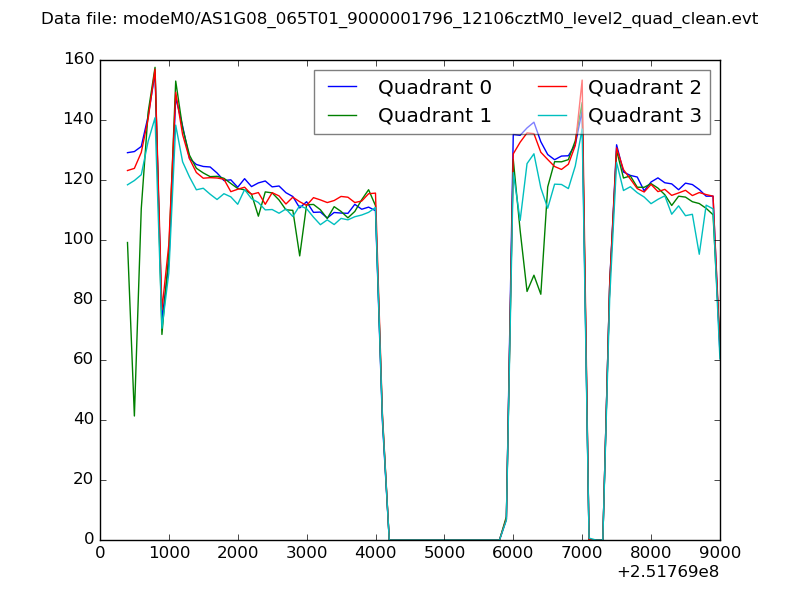
| Quadrant-wise count rates Data is divided into 100 sec bins |
 |
|
| Module-wise count rates for Quadrant A Data is divided into 100 sec bins |
 |
 |
| Module-wise count rates for Quadrant B Data is divided into 100 sec bins |
 |
 |
| Module-wise count rates for Quadrant C Data is divided into 100 sec bins |
 |
 |
| Module-wise count rates for Quadrant D Data is divided into 100 sec bins |
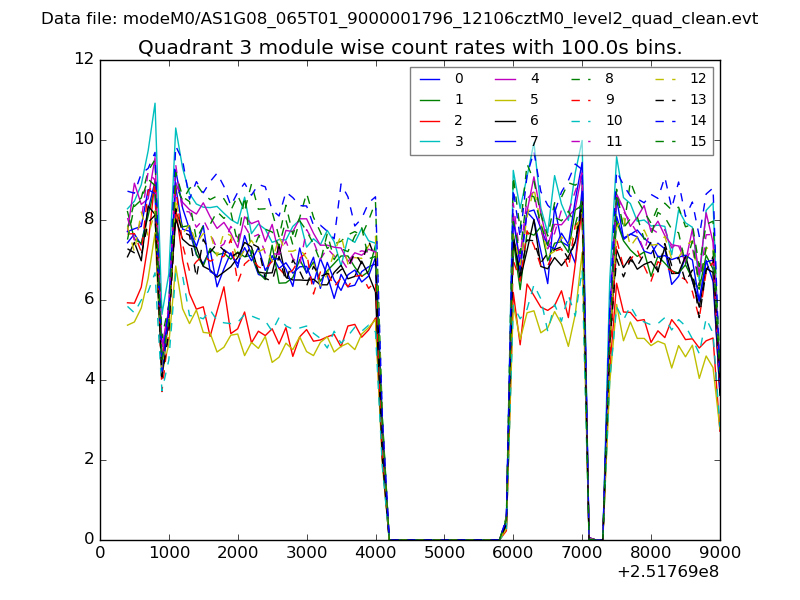 |
 |
| Parameter | Plot |
|---|---|
| CZT HV Monitor |  |
| D_VDD | 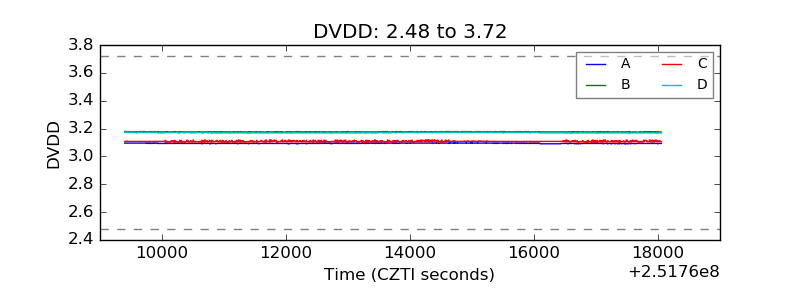 |
| Temperature 1 | 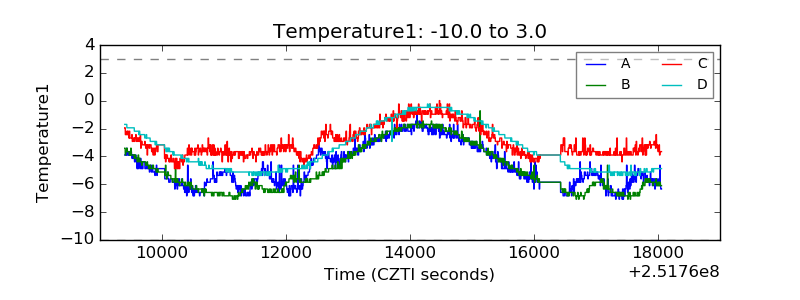 |
| Veto HV Monitor | 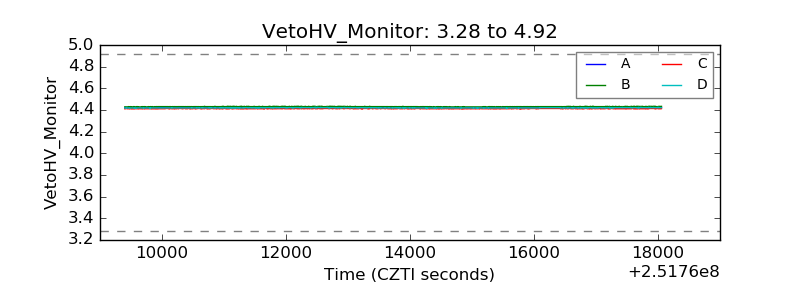 |
| Veto LLD | 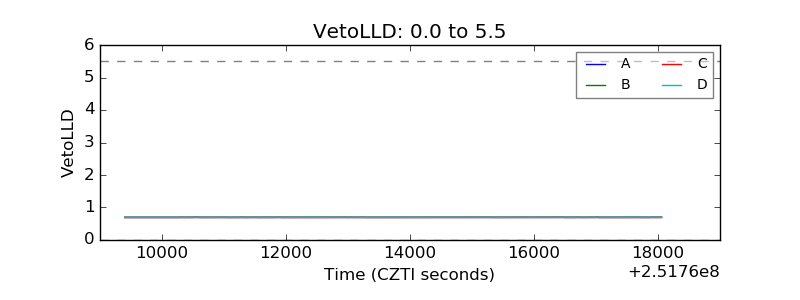 |
| Alpha Counter | 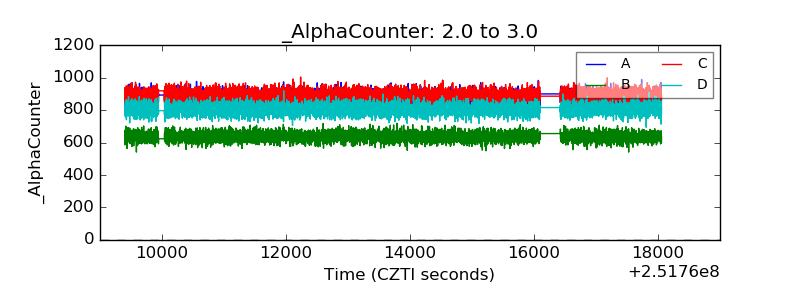 |
| _CPM_Rate | 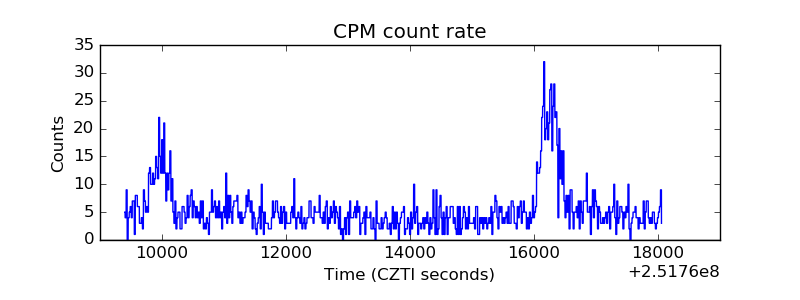 |
| CZT Counter | 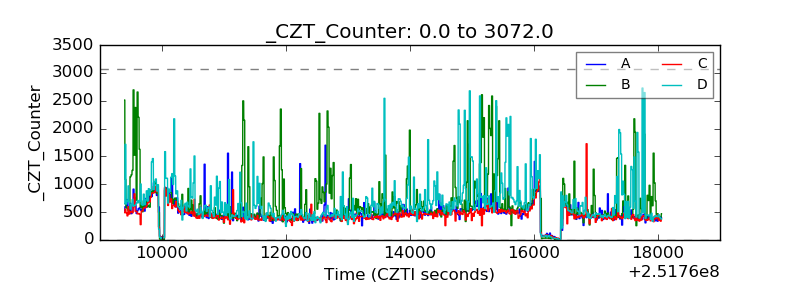 |
| +2.5 Volts monitor | 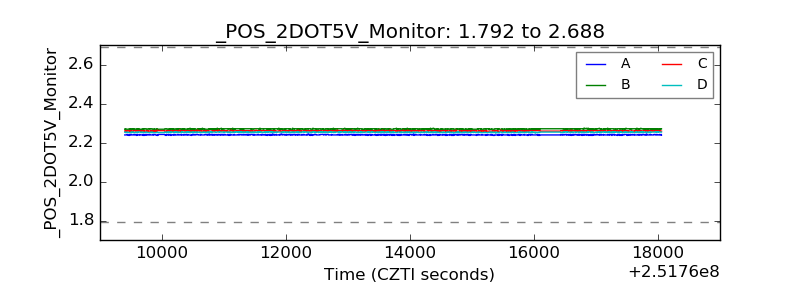 |
| +5 Volts monitor |  |
| _ROLL_ROT | 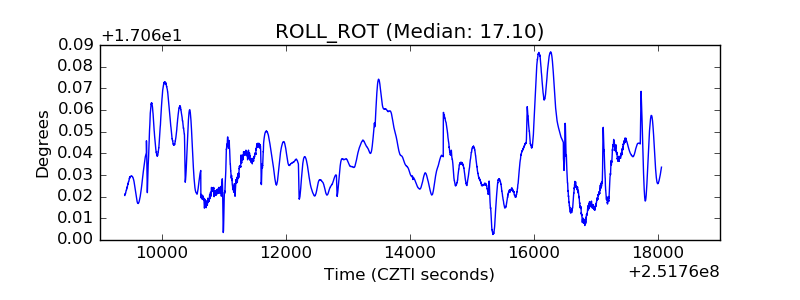 |
| _Roll_DEC | 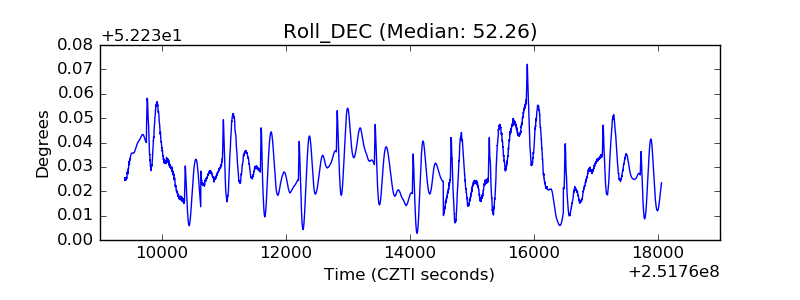 |
| _Roll_RA | 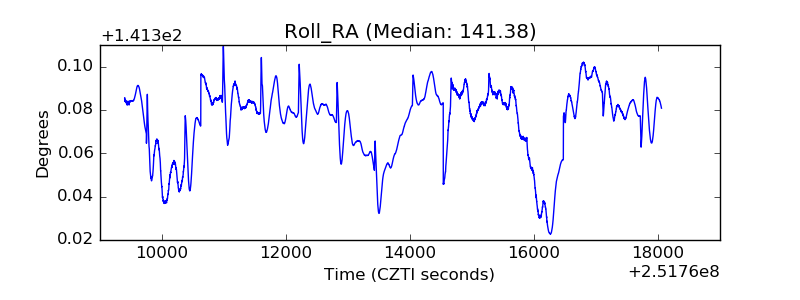 |
| Veto Counter |  |