| Param | Original file | Final file |
|---|---|---|
| Filename | modeM0/AS1G08_065T01_9000001796_12108cztM0_level2.evt | modeM0/AS1G08_065T01_9000001796_12108cztM0_level2_quad_clean.evt |
| Size (bytes) | 1,067,742,720 | 182,767,680 |
| Size | 1018.3 MB | 174.3 MB |
| Events in quadrant A | 6,832,540 | 1,176,622 |
| Events in quadrant B | 10,015,537 | 1,141,376 |
| Events in quadrant C | 6,003,735 | 1,174,340 |
| Events in quadrant D | 8,577,866 | 1,115,652 |
| Mode M0 | |||
|---|---|---|---|
| Quadrant | BADHDUFLAG | Total packets | Discarded packets |
| A | 0 | 29552 | 4 |
| B | 0 | 39002 | 3 |
| C | 0 | 27458 | 3 |
| D | 0 | 34730 | 3 |
| Mode M9 | |||
|---|---|---|---|
| Quadrant | BADHDUFLAG | Total packets | Discarded packets |
| A | 0 | 15 | 0 |
| B | 0 | 15 | 0 |
| C | 0 | 15 | 0 |
| D | 0 | 15 | 0 |
| Mode SS | |||
|---|---|---|---|
| Quadrant | BADHDUFLAG | Total packets | Discarded packets |
| A | 0 | 276 | 0 |
| B | 0 | 276 | 0 |
| C | 0 | 276 | 0 |
| D | 0 | 276 | 0 |
| Quadrant | Total seconds | Saturated seconds | Saturation percentage |
|---|---|---|---|
| A | 13412 | 273 | 2.035491% |
| B | 13412 | 1016 | 7.575306% |
| C | 13412 | 83 | 0.618849% |
| D | 13412 | 610 | 4.548166% |
Noise dominated data is calculated using 1-second bins in cleaned event files. If a bin has >2000 counts, and if more than 50% of those come from <1% of pixels, then it is considered to be noise-dominated and hence unusable.
| Quadrant | # 1 sec bins | Bins with >0 counts | Bins with >2000 counts | High rate bins dominated by noise | Noise dominated (total time) | Noise dominated (detector-on time) | Marked lightcurve |
|---|---|---|---|---|---|---|---|
| A | 15013 | 13417 | 48 | 48 | 0.32% | 0.36% | 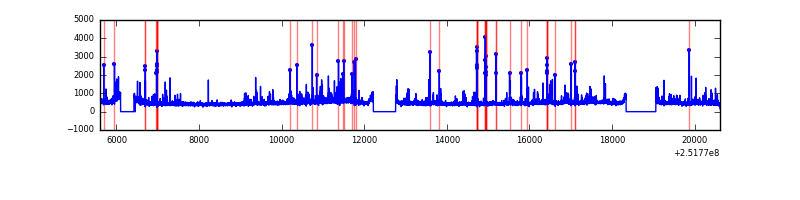 |
| B | 15013 | 13416 | 574 | 574 | 3.82% | 4.28% | 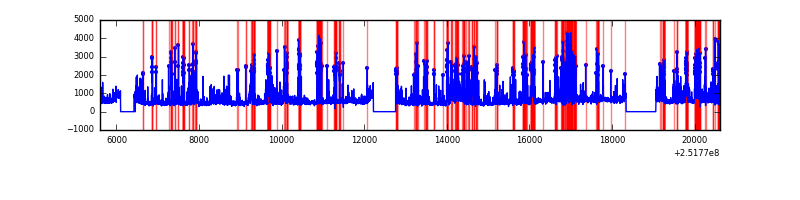 |
| C | 15013 | 13417 | 6 | 6 | 0.04% | 0.04% | 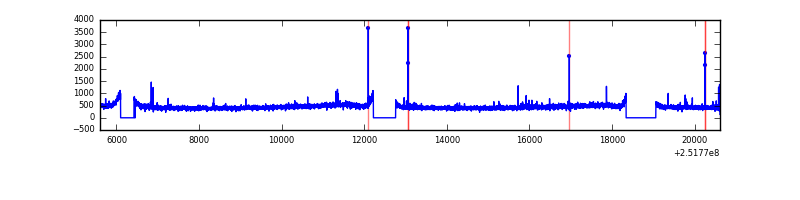 |
| D | 15013 | 13417 | 389 | 389 | 2.59% | 2.90% | 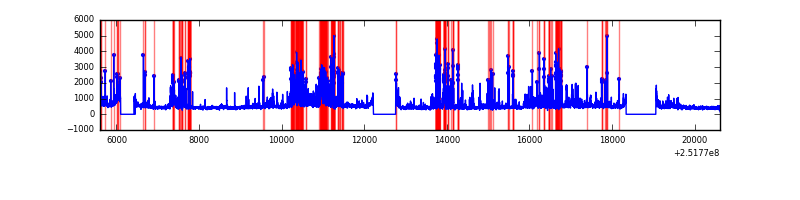 |
Top three noisy pixels from each quadrant. If the there are fewer than three noisy pixels in the level2.evt file, extra rows are filled as -1
| Pixel properties | Quadrant properties | ||||||
|---|---|---|---|---|---|---|---|
| Quadrant | DetID | PixID | Counts | Sigma | Mean | Median | Sigma |
| A | 1 | 162 | 279433 | 880.02 | 1562 | 1525 | 315.8 |
| A | 14 | 63 | 200303 | 629.45 | 1562 | 1525 | 315.8 |
| A | 1 | 178 | 105215 | 328.34 | 1562 | 1525 | 315.8 |
| B | 4 | 239 | 3213449 | 10997.7 | 1525 | 1484 | 292.1 |
| B | 4 | 206 | 365900 | 1247.75 | 1525 | 1484 | 292.1 |
| B | 11 | 51 | 174857 | 593.63 | 1525 | 1484 | 292.1 |
| C | 15 | 208 | 47729 | 131.48 | 1516 | 1524 | 351.4 |
| C | 14 | 234 | 20095 | 52.84 | 1516 | 1524 | 351.4 |
| C | 13 | 61 | 11327 | 27.89 | 1516 | 1524 | 351.4 |
| D | 1 | 52 | 1930189 | 5401.61 | 1490 | 1444 | 357.1 |
| D | 8 | 195 | 348207 | 971.14 | 1490 | 1444 | 357.1 |
| D | 14 | 34 | 318210 | 887.13 | 1490 | 1444 | 357.1 |
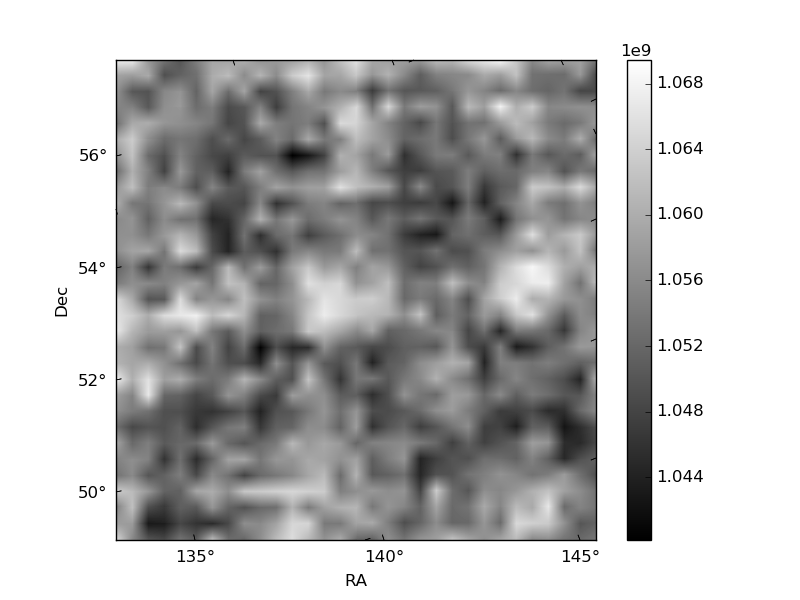
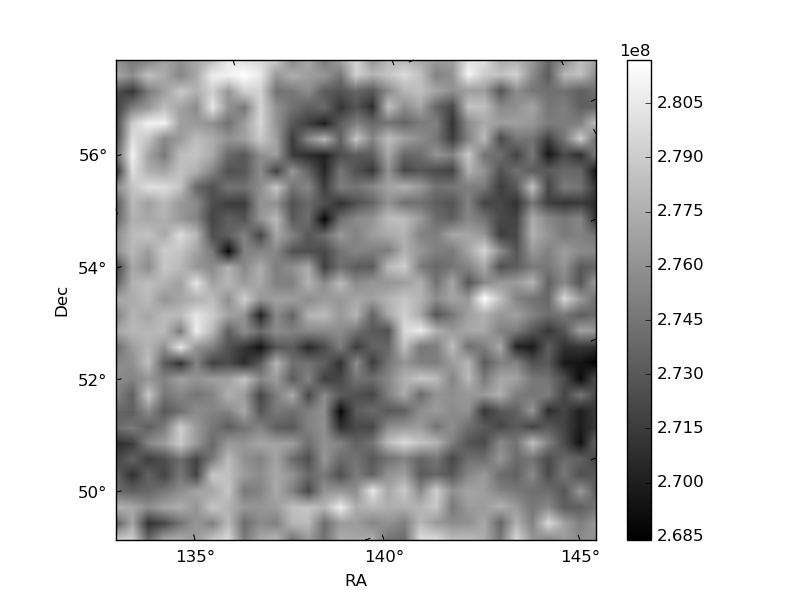
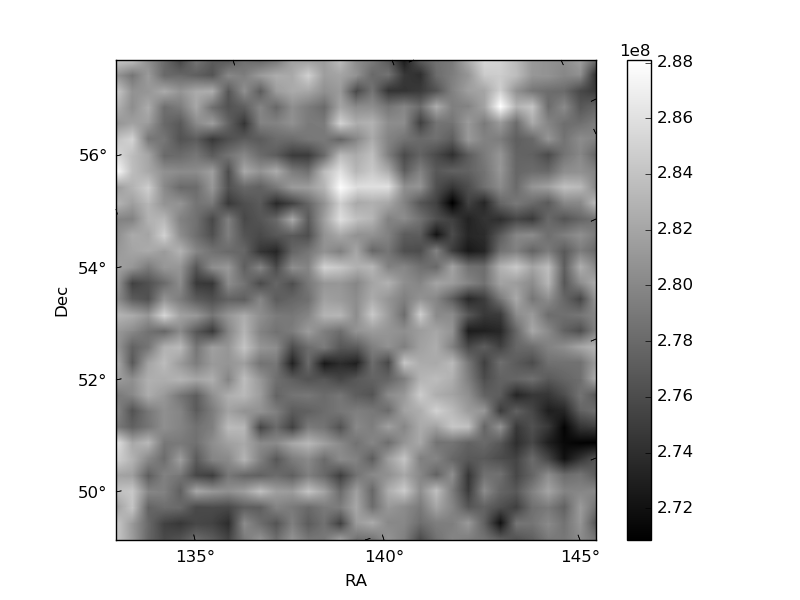
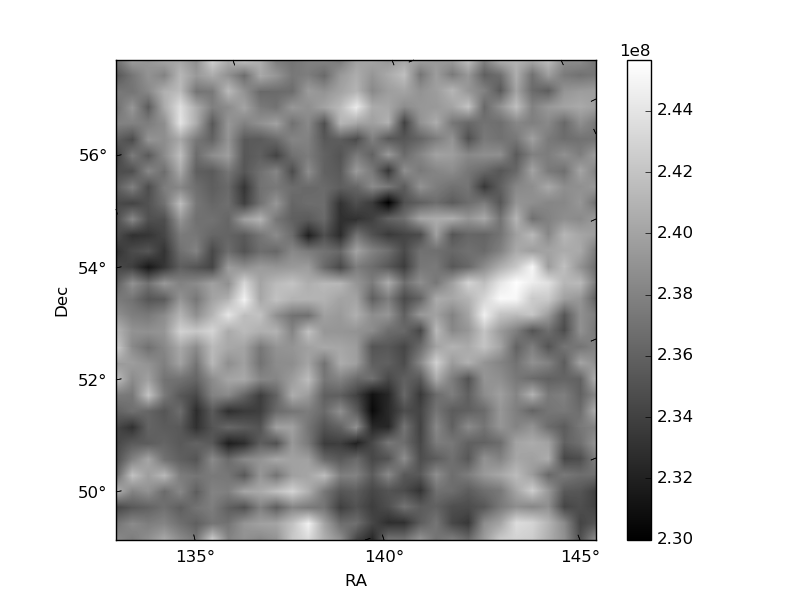
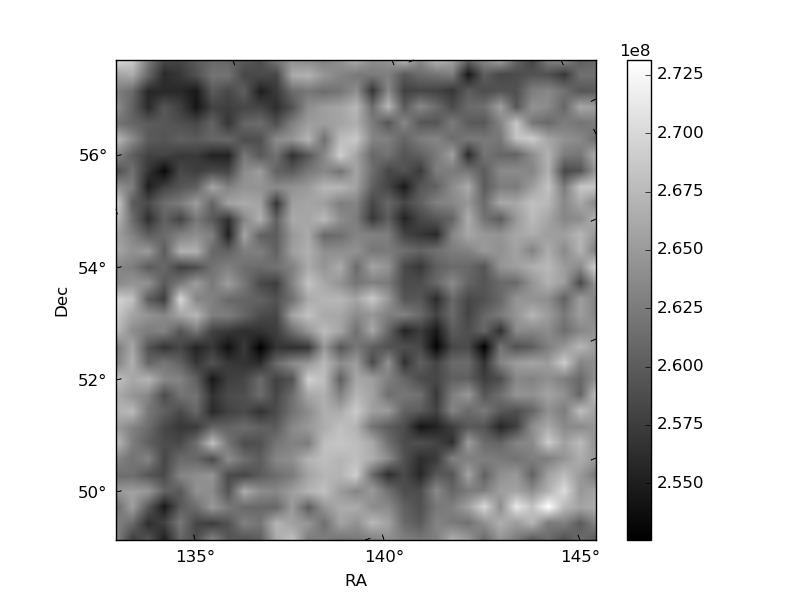
Histogram calculated using DETX and DETY for each event in the final _common_clean file
| Quadrant A | 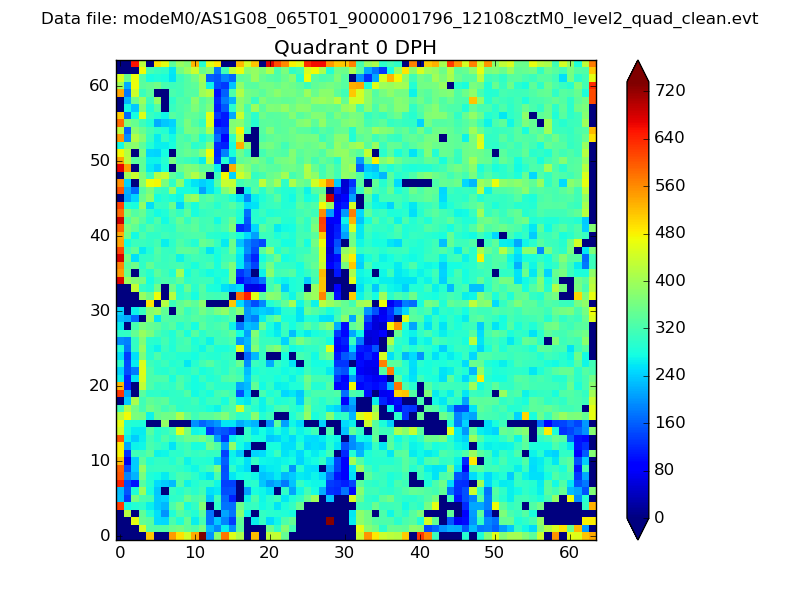 |
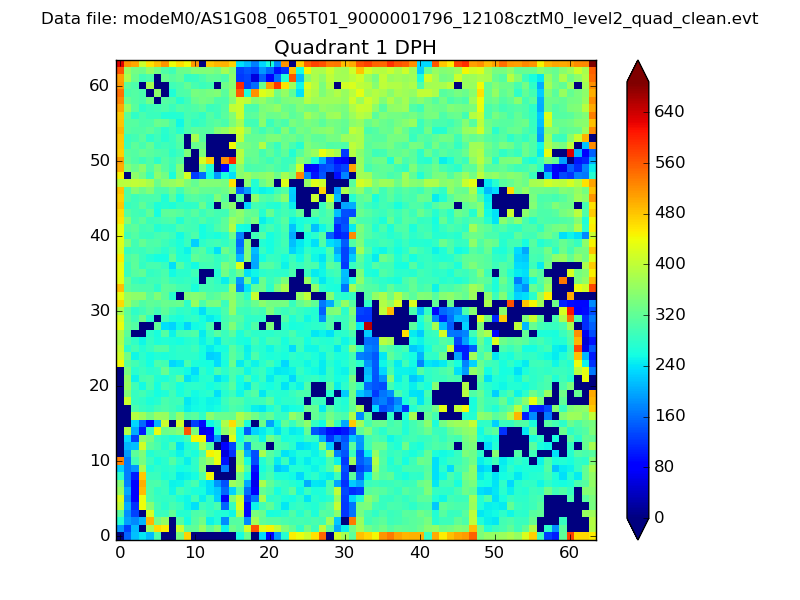 |
Quadrant B |
|---|---|---|---|
| Quadrant D | 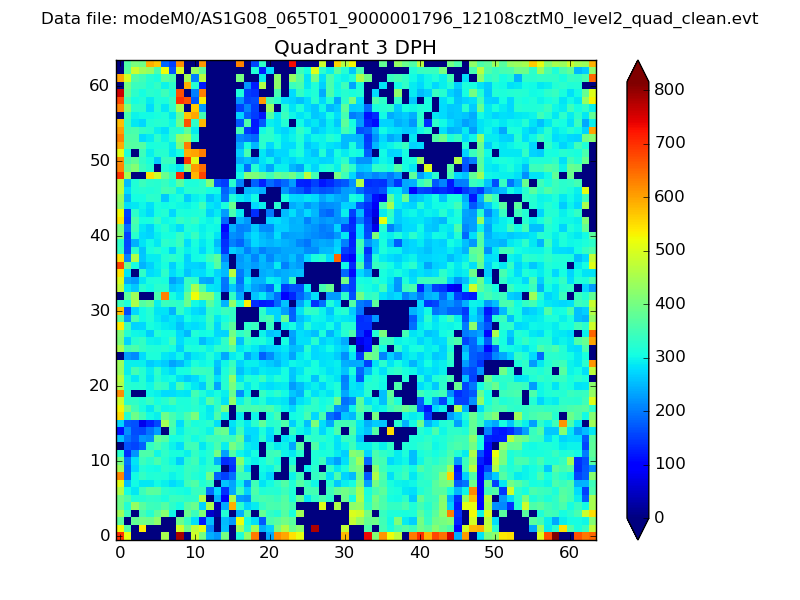 |
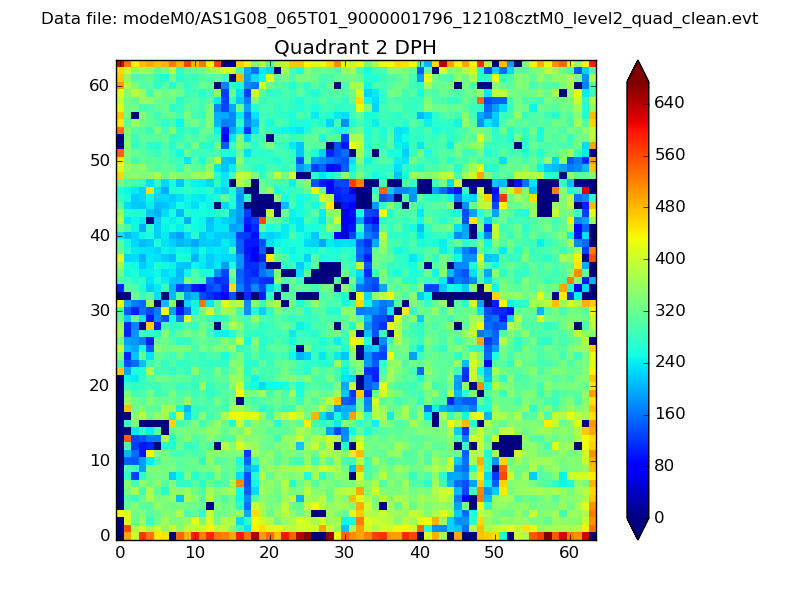 |
Quadrant C |
| Plot type | Count rate plots | Images |
|---|---|---|
| Comparison with Poisson distribution Blue bars denote a histogram of data divided into 1 sec bins. Red curve is a Poisson curve with rate = median count rate of data. |
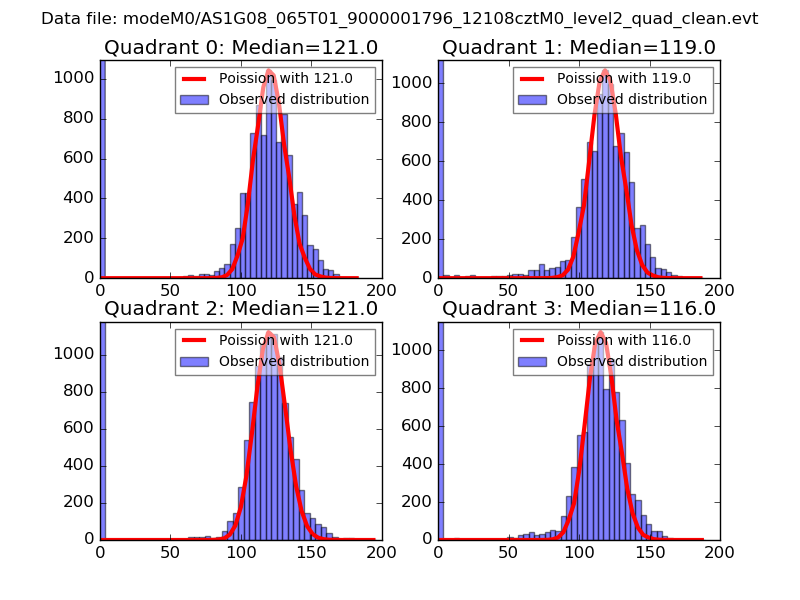 |
 |
| Quadrant-wise count rates Data is divided into 100 sec bins |
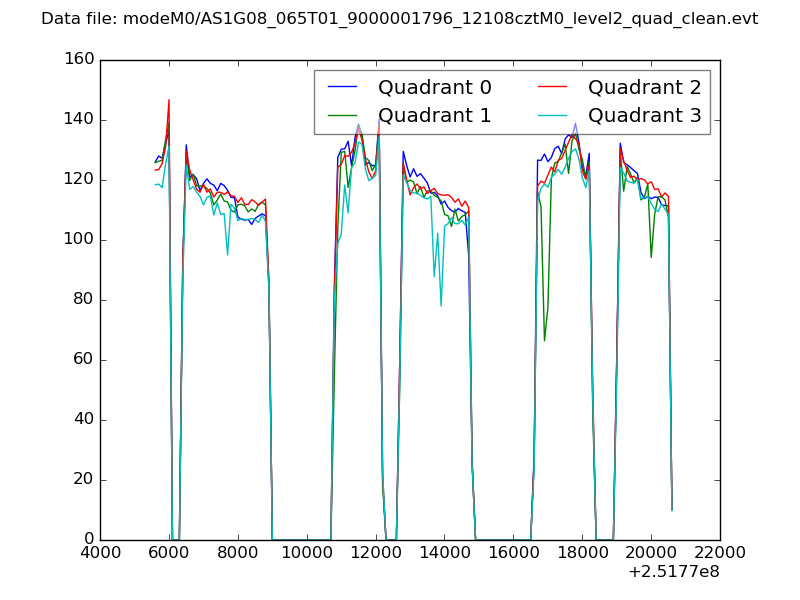 |
|
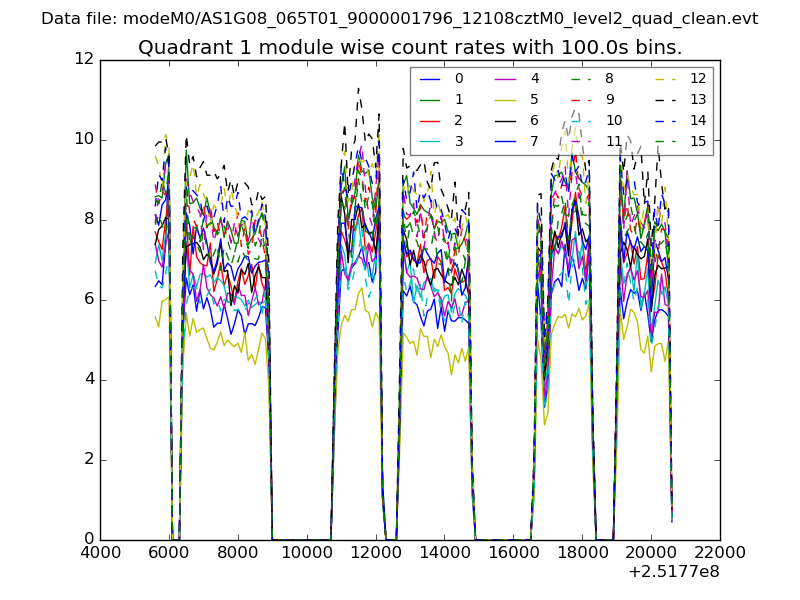
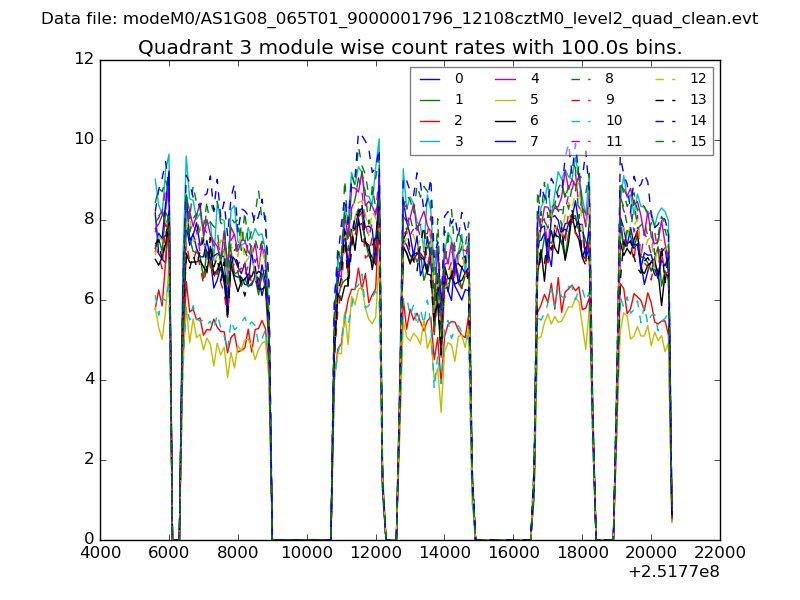
| Module-wise count rates for Quadrant A Data is divided into 100 sec bins |
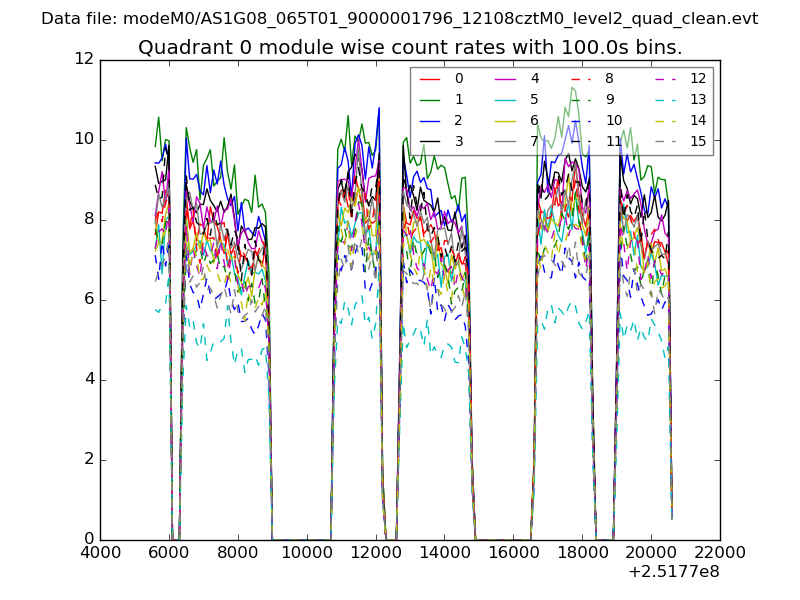 |
 |
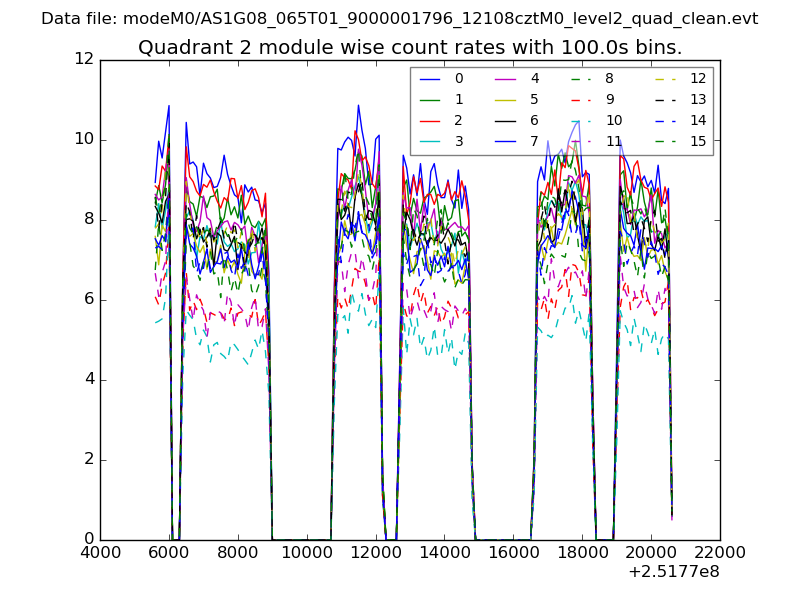
| Module-wise count rates for Quadrant B Data is divided into 100 sec bins |
 |
 |
| Module-wise count rates for Quadrant C Data is divided into 100 sec bins |
 |
 |
| Module-wise count rates for Quadrant D Data is divided into 100 sec bins |
 |
 |
| Parameter | Plot |
|---|---|
| CZT HV Monitor | 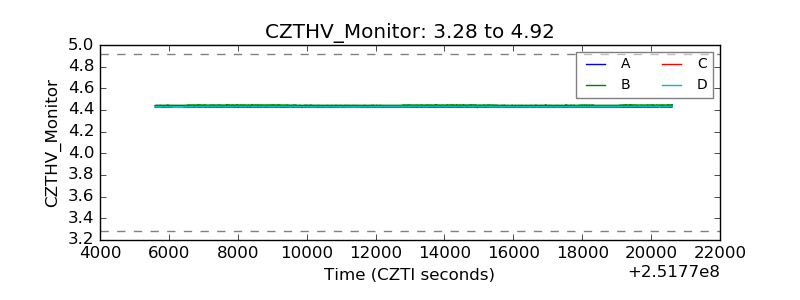 |
| D_VDD | 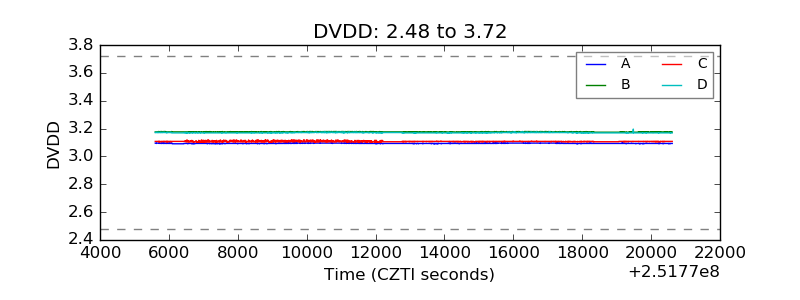 |
| Temperature 1 | 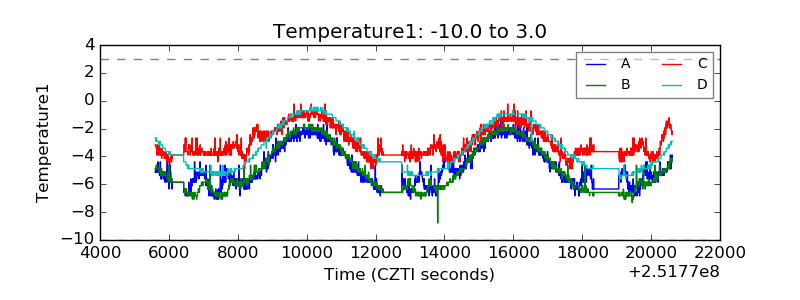 |
| Veto HV Monitor | 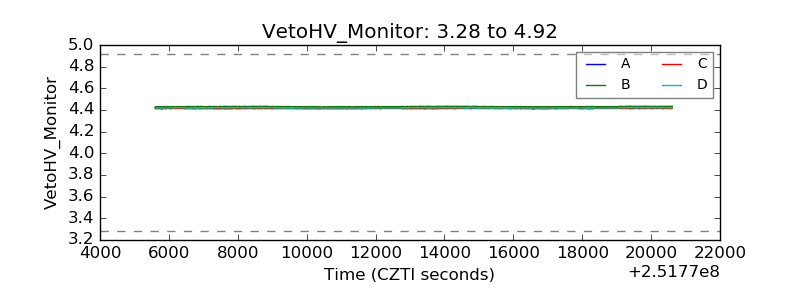 |
| Veto LLD |  |
| Alpha Counter | 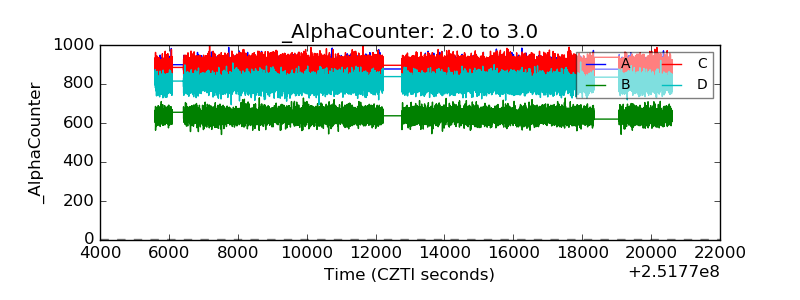 |
| _CPM_Rate | 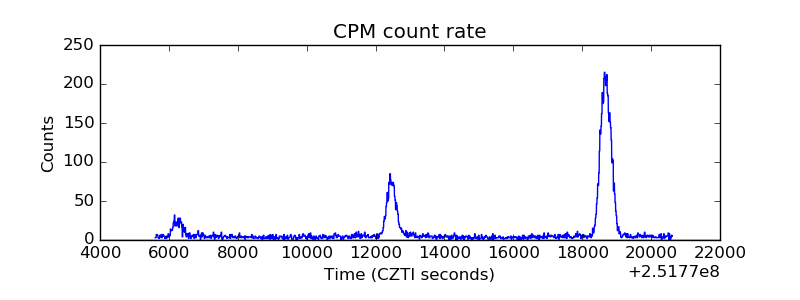 |
| CZT Counter | 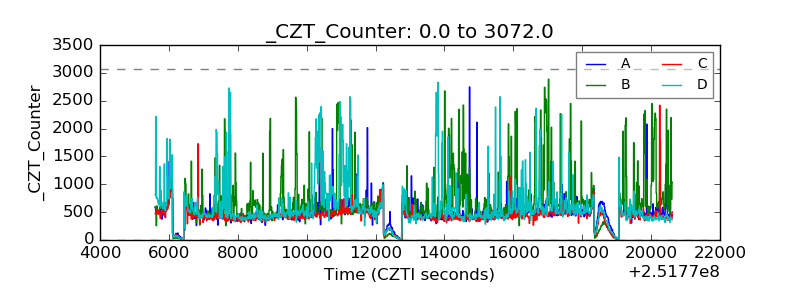 |
| +2.5 Volts monitor |  |
| +5 Volts monitor |  |
| _ROLL_ROT | 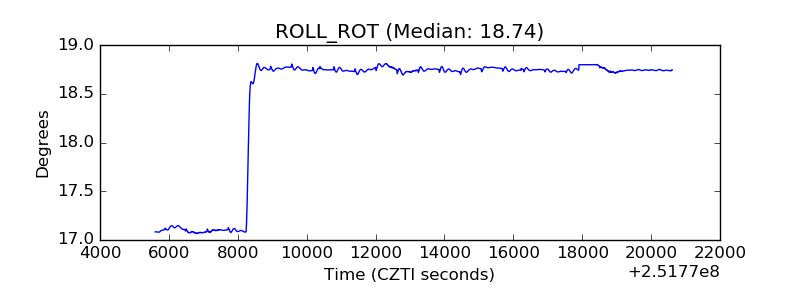 |
| _Roll_DEC | 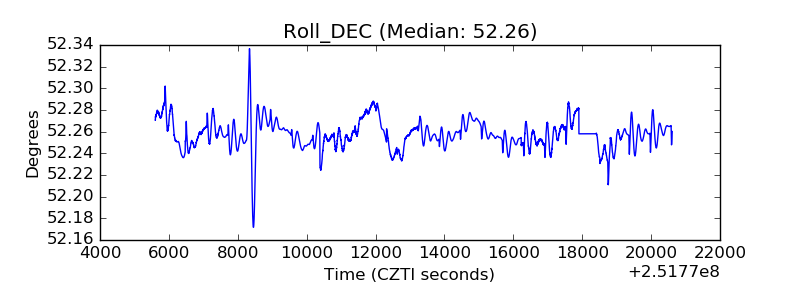 |
| _Roll_RA | 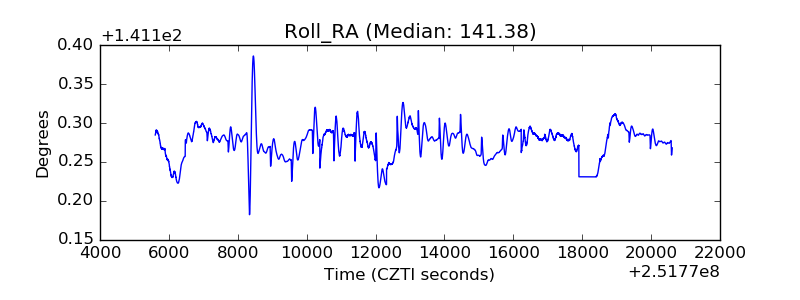 |
| Veto Counter | 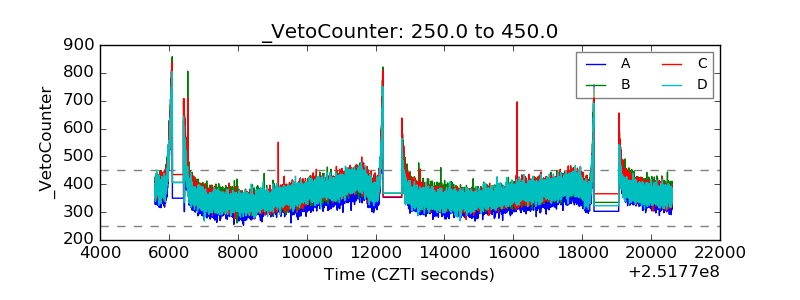 |