| Param | Original file | Final file |
|---|---|---|
| Filename | modeM0/AS1G08_065T01_9000001796_12109cztM0_level2.evt | modeM0/AS1G08_065T01_9000001796_12109cztM0_level2_quad_clean.evt |
| Size (bytes) | 452,750,400 | 77,319,360 |
| Size | 431.8 MB | 73.7 MB |
| Events in quadrant A | 2,884,042 | 494,774 |
| Events in quadrant B | 4,675,258 | 467,759 |
| Events in quadrant C | 2,647,110 | 490,577 |
| Events in quadrant D | 3,102,509 | 474,121 |
| Mode M0 | |||
|---|---|---|---|
| Quadrant | BADHDUFLAG | Total packets | Discarded packets |
| A | 0 | 12355 | 2 |
| B | 0 | 17956 | 1 |
| C | 0 | 12043 | 1 |
| D | 0 | 13201 | 1 |
| Mode M9 | |||
|---|---|---|---|
| Quadrant | BADHDUFLAG | Total packets | Discarded packets |
| A | 0 | 9 | 0 |
| B | 0 | 9 | 0 |
| C | 0 | 9 | 0 |
| D | 0 | 9 | 0 |
| Mode SS | |||
|---|---|---|---|
| Quadrant | BADHDUFLAG | Total packets | Discarded packets |
| A | 0 | 120 | 0 |
| B | 0 | 120 | 0 |
| C | 0 | 120 | 0 |
| D | 0 | 120 | 0 |
| Quadrant | Total seconds | Saturated seconds | Saturation percentage |
|---|---|---|---|
| A | 5925 | 71 | 1.198312% |
| B | 5925 | 508 | 8.573840% |
| C | 5925 | 25 | 0.421941% |
| D | 5925 | 141 | 2.379747% |
Noise dominated data is calculated using 1-second bins in cleaned event files. If a bin has >2000 counts, and if more than 50% of those come from <1% of pixels, then it is considered to be noise-dominated and hence unusable.
| Quadrant | # 1 sec bins | Bins with >0 counts | Bins with >2000 counts | High rate bins dominated by noise | Noise dominated (total time) | Noise dominated (detector-on time) | Marked lightcurve |
|---|---|---|---|---|---|---|---|
| A | 6811 | 5926 | 4 | 4 | 0.06% | 0.07% | 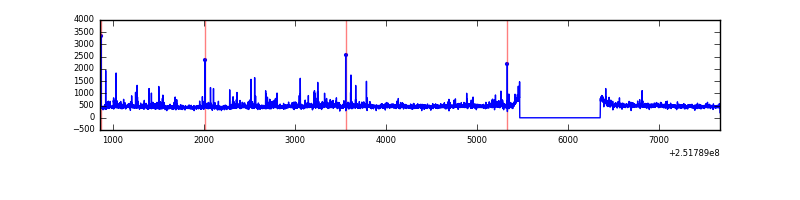 |
| B | 6811 | 5927 | 326 | 326 | 4.79% | 5.50% | 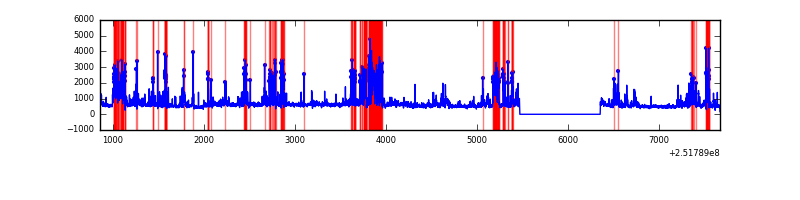 |
| C | 6811 | 5927 | 4 | 4 | 0.06% | 0.07% | 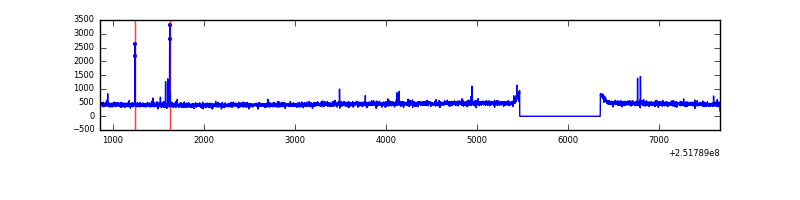 |
| D | 6811 | 5927 | 79 | 79 | 1.16% | 1.33% | 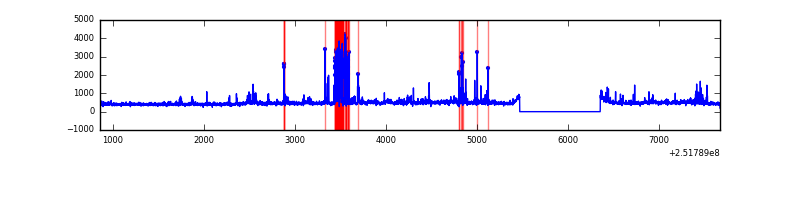 |
Top three noisy pixels from each quadrant. If the there are fewer than three noisy pixels in the level2.evt file, extra rows are filled as -1
| Pixel properties | Quadrant properties | ||||||
|---|---|---|---|---|---|---|---|
| Quadrant | DetID | PixID | Counts | Sigma | Mean | Median | Sigma |
| A | 1 | 162 | 73533 | 513.57 | 696 | 682 | 141.9 |
| A | 1 | 178 | 33183 | 229.12 | 696 | 682 | 141.9 |
| A | 1 | 161 | 30638 | 211.18 | 696 | 682 | 141.9 |
| B | 4 | 239 | 1316380 | 10167.58 | 669 | 652 | 129.4 |
| B | 4 | 206 | 336677 | 2596.71 | 669 | 652 | 129.4 |
| B | 0 | 85 | 199311 | 1535.18 | 669 | 652 | 129.4 |
| C | 15 | 208 | 24416 | 152.8 | 669 | 671 | 155.4 |
| C | 14 | 234 | 9266 | 55.31 | 669 | 671 | 155.4 |
| C | 13 | 61 | 4965 | 27.63 | 669 | 671 | 155.4 |
| D | 1 | 52 | 307404 | 1902.18 | 666 | 645 | 161.3 |
| D | 8 | 195 | 91080 | 560.78 | 666 | 645 | 161.3 |
| D | 10 | 50 | 55258 | 338.65 | 666 | 645 | 161.3 |
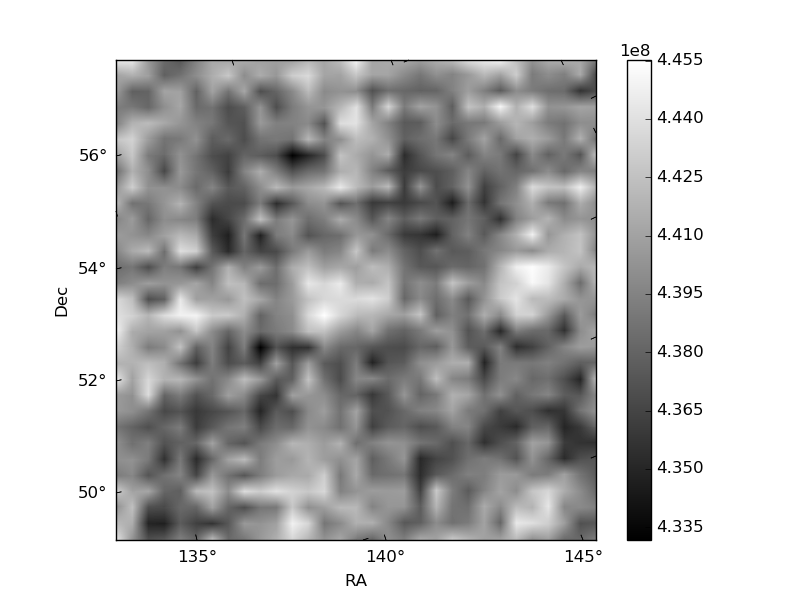
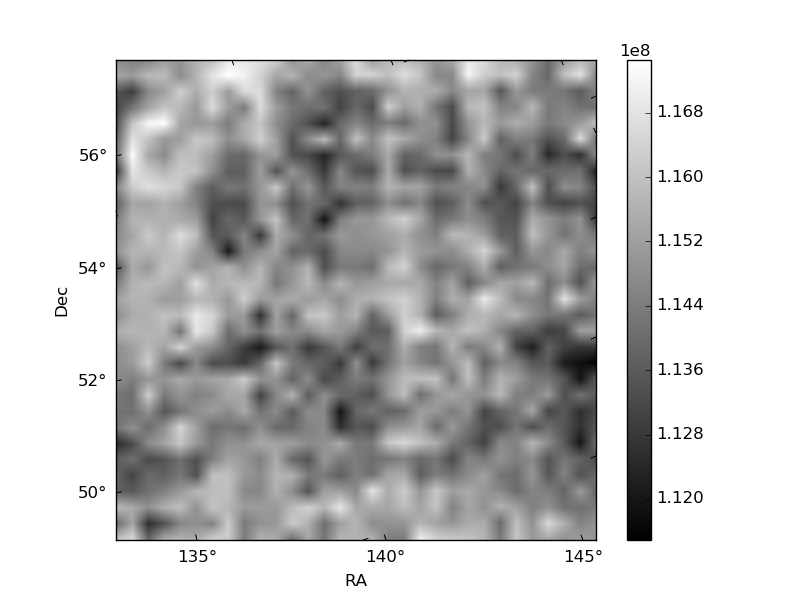
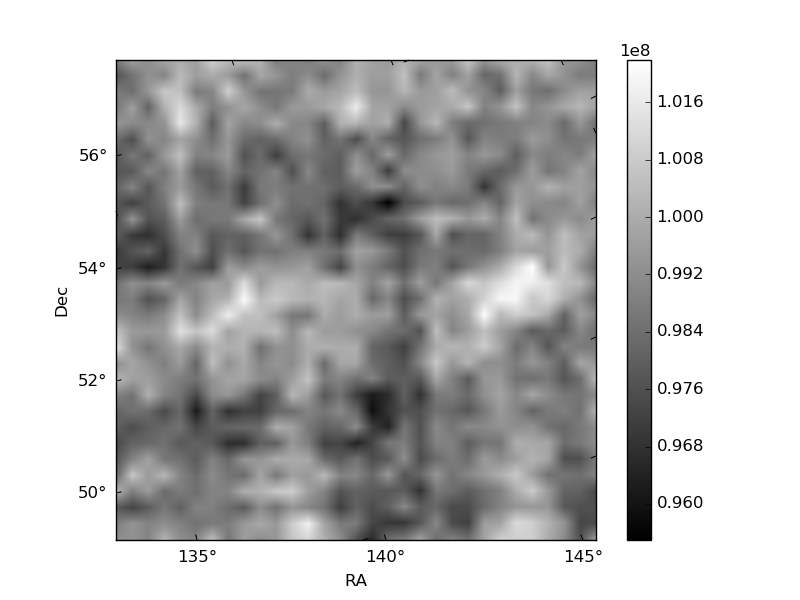
Histogram calculated using DETX and DETY for each event in the final _common_clean file
| Quadrant A | 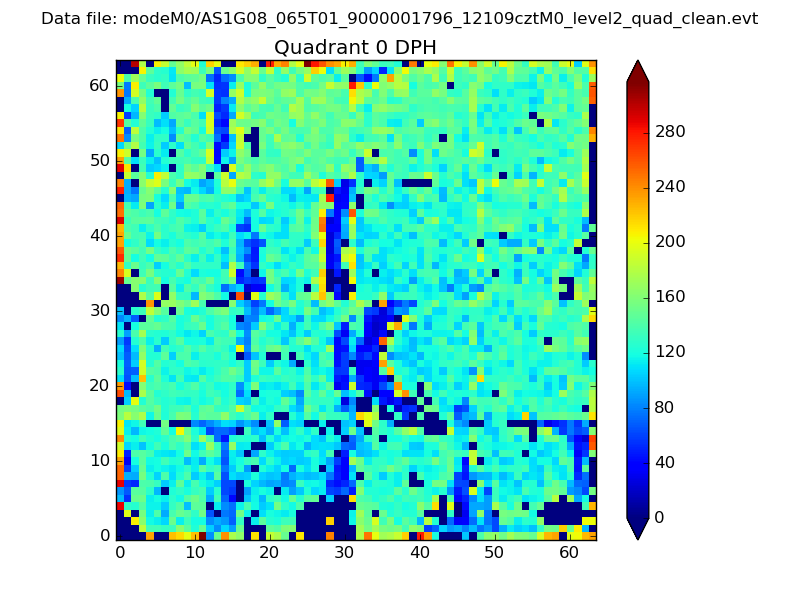 |
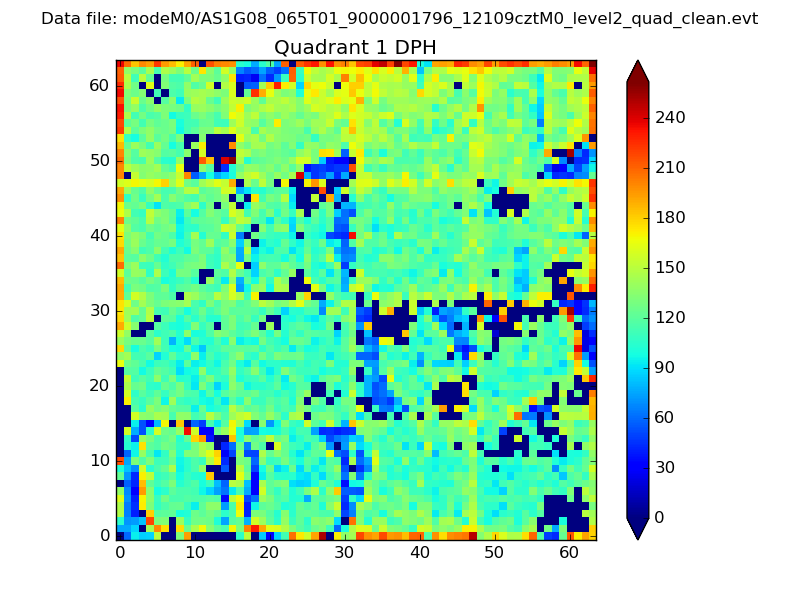 |
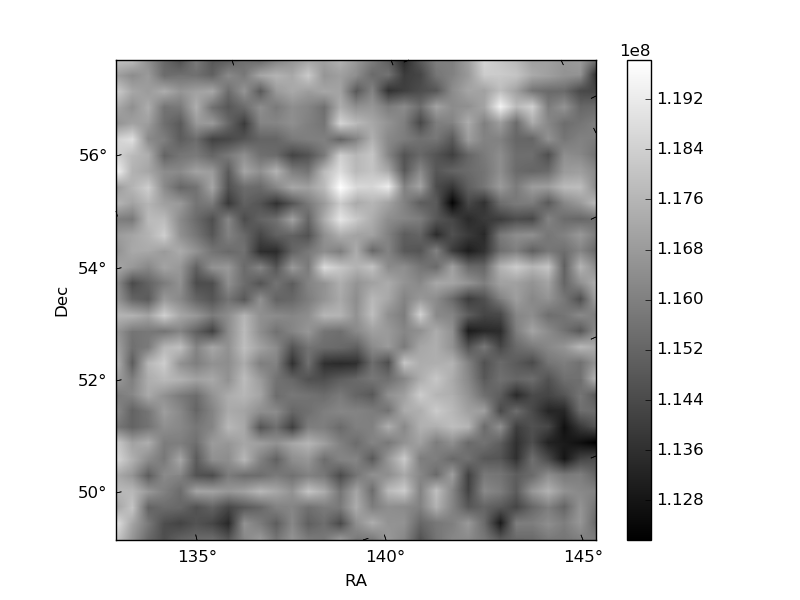
Quadrant B |
|---|---|---|---|
| Quadrant D | 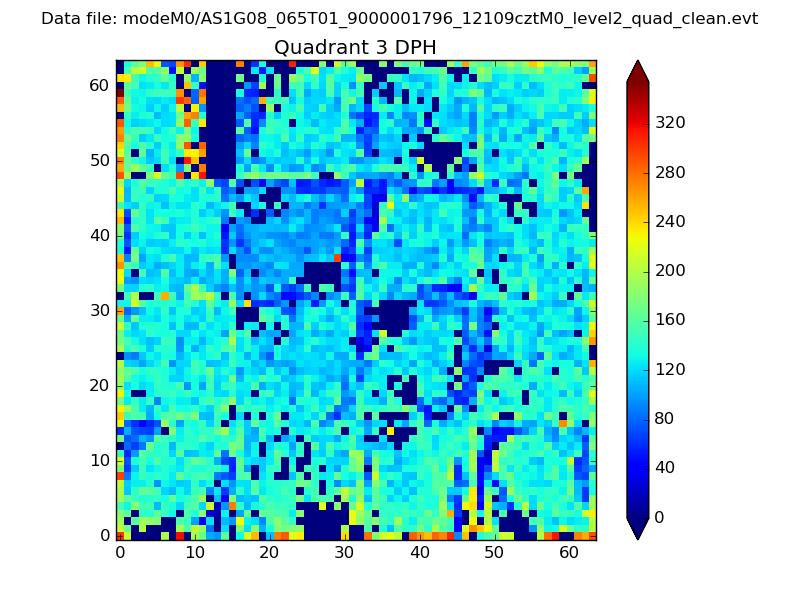 |
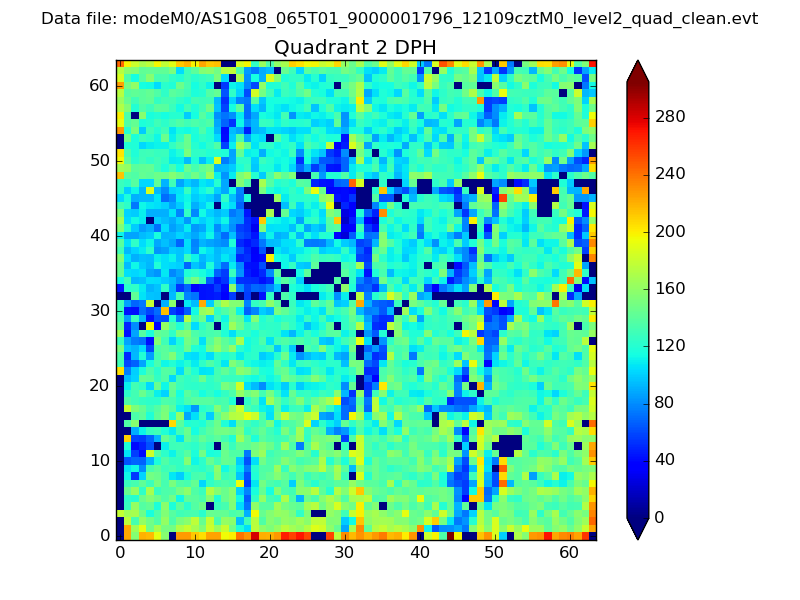 |
Quadrant C |
| Plot type | Count rate plots | Images |
|---|---|---|
| Comparison with Poisson distribution Blue bars denote a histogram of data divided into 1 sec bins. Red curve is a Poisson curve with rate = median count rate of data. |
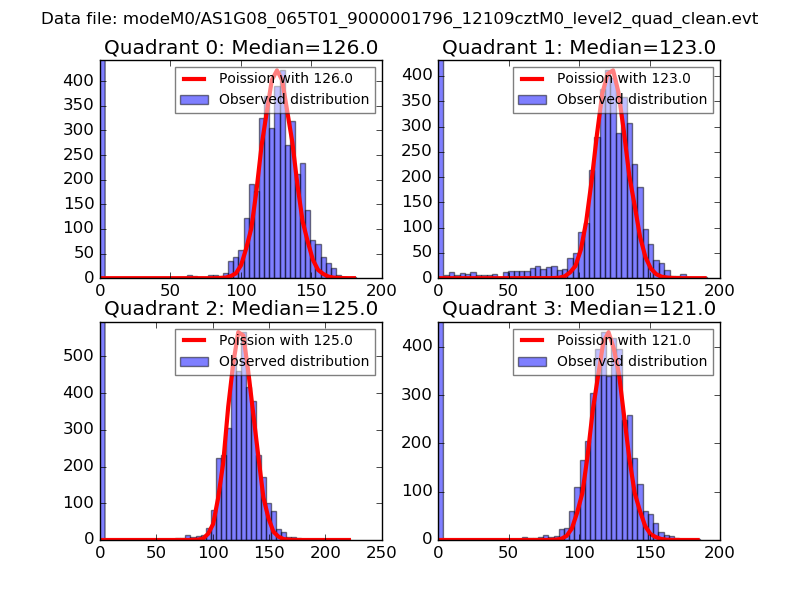 |
 |
| Quadrant-wise count rates Data is divided into 100 sec bins |
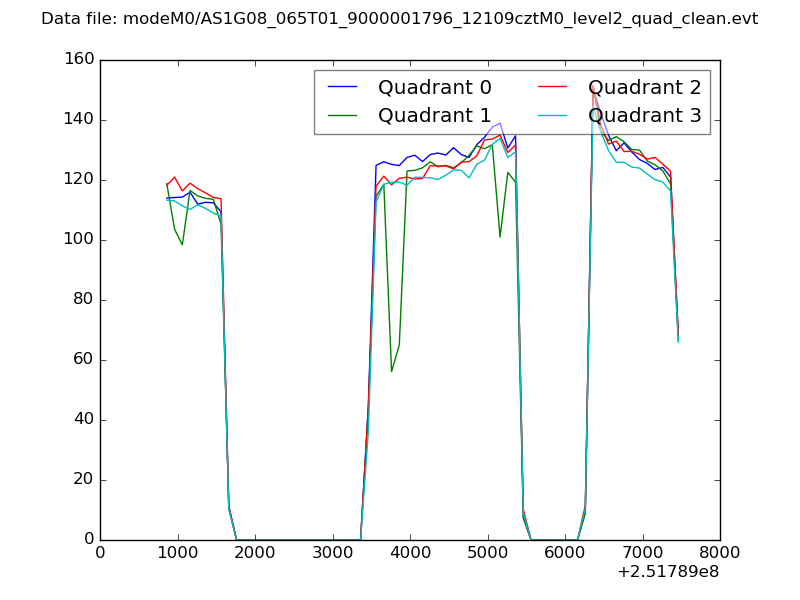 |
|
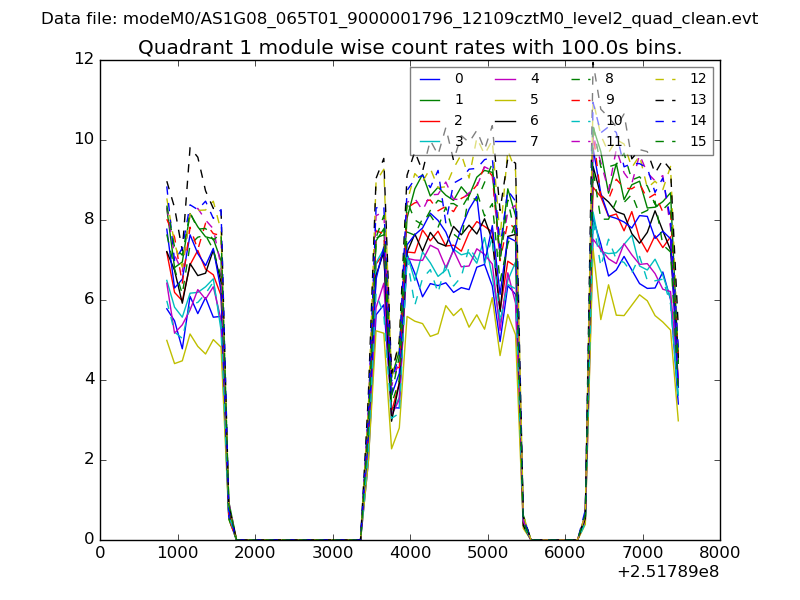
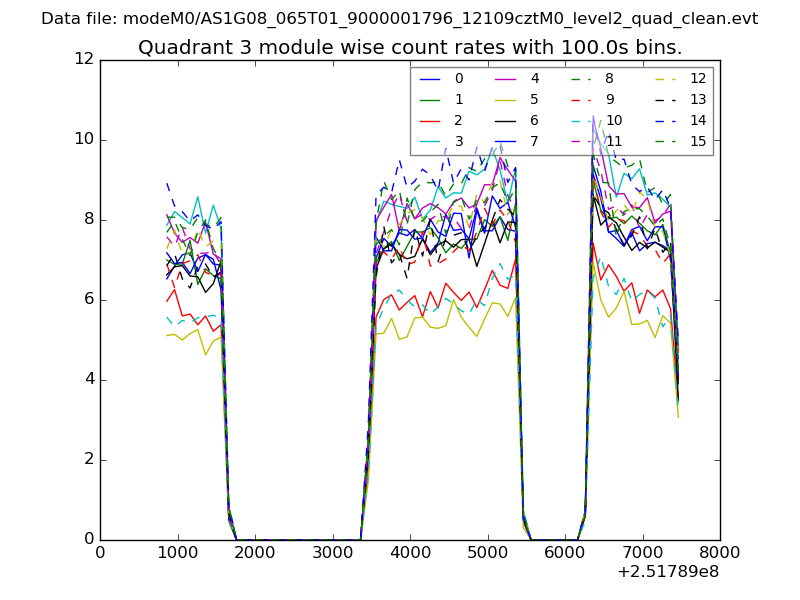
| Module-wise count rates for Quadrant A Data is divided into 100 sec bins |
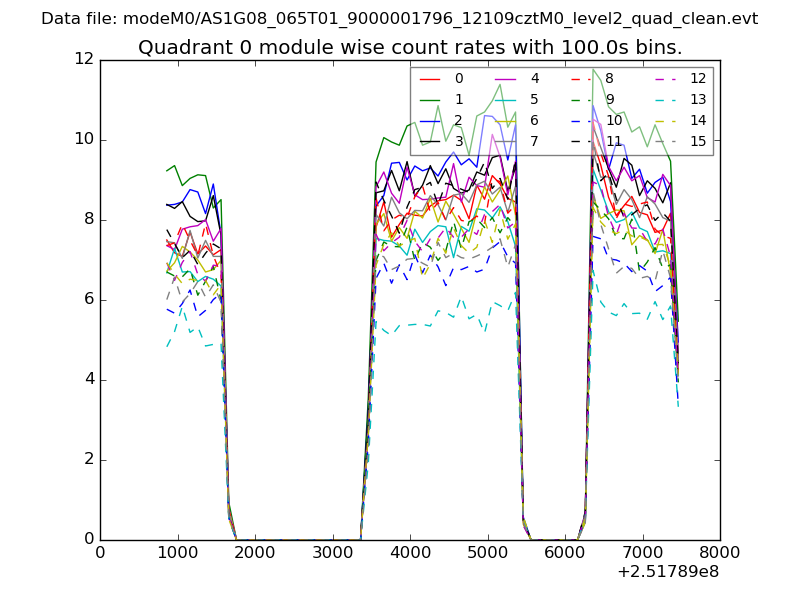 |
 |
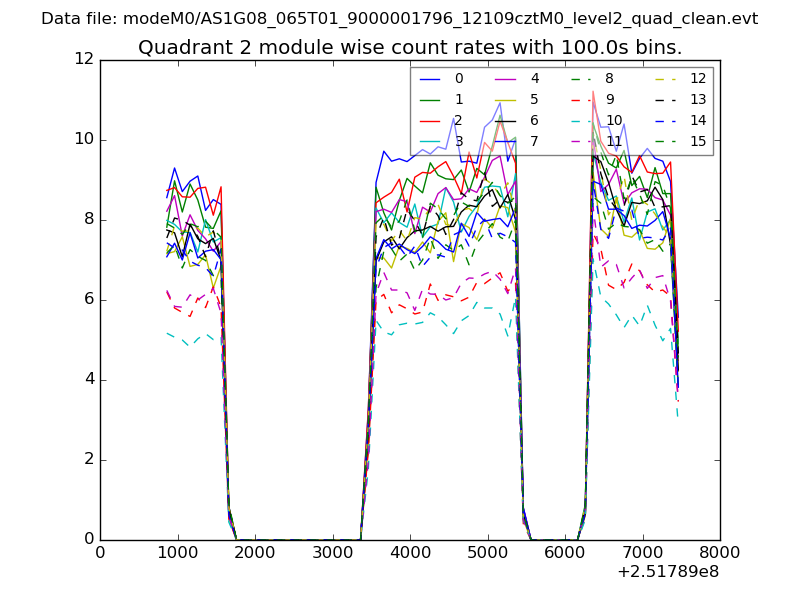
| Module-wise count rates for Quadrant B Data is divided into 100 sec bins |
 |
 |
| Module-wise count rates for Quadrant C Data is divided into 100 sec bins |
 |
 |
| Module-wise count rates for Quadrant D Data is divided into 100 sec bins |
 |
 |
| Parameter | Plot |
|---|---|
| CZT HV Monitor | 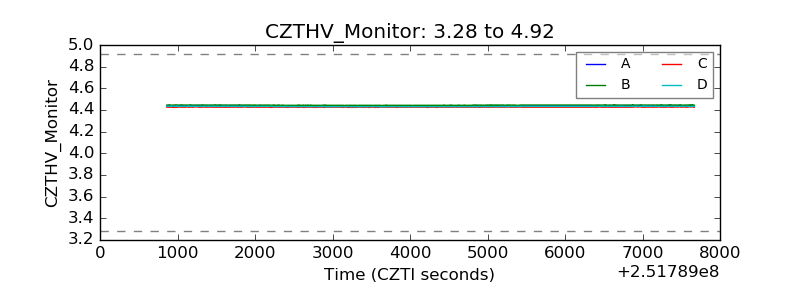 |
| D_VDD | 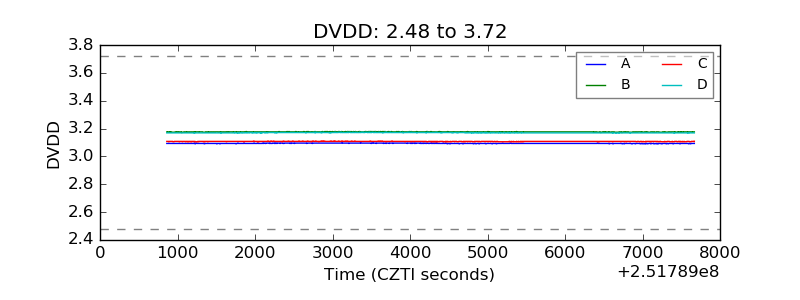 |
| Temperature 1 | 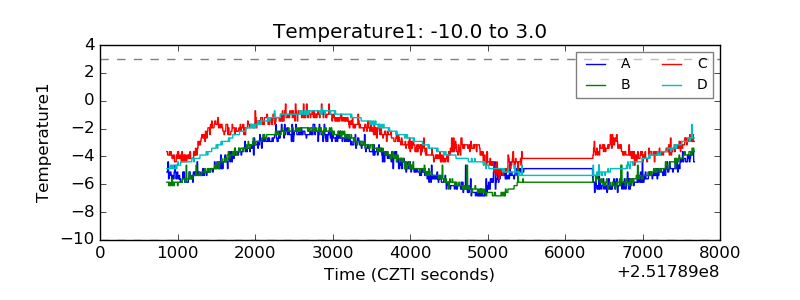 |
| Veto HV Monitor | 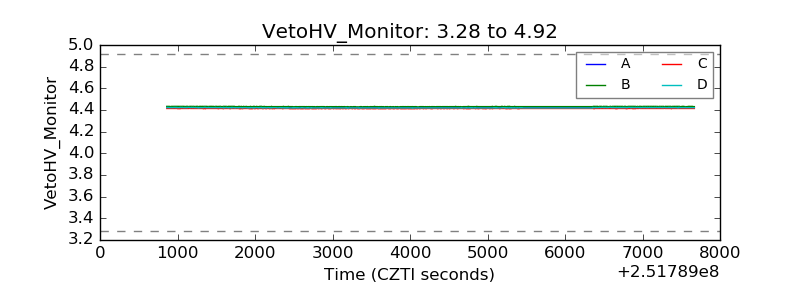 |
| Veto LLD | 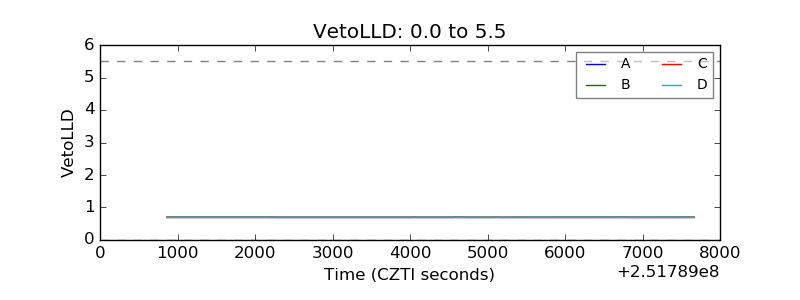 |
| Alpha Counter | 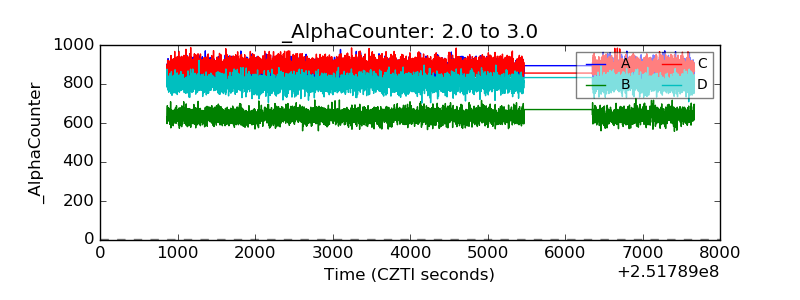 |
| _CPM_Rate | 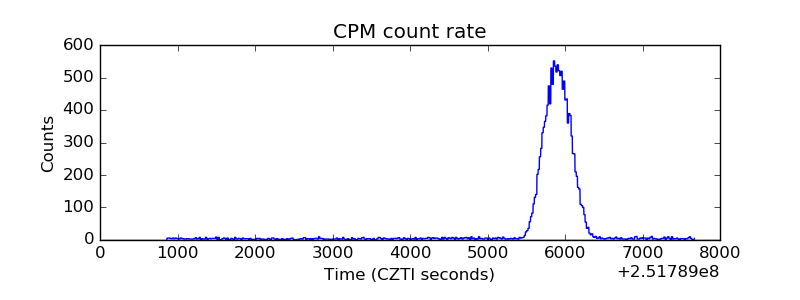 |
| CZT Counter | 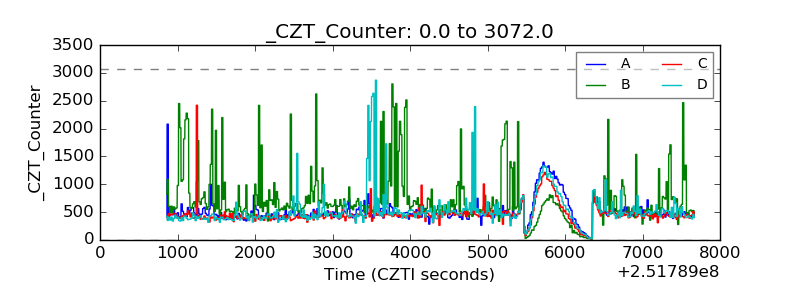 |
| +2.5 Volts monitor |  |
| +5 Volts monitor |  |
| _ROLL_ROT | 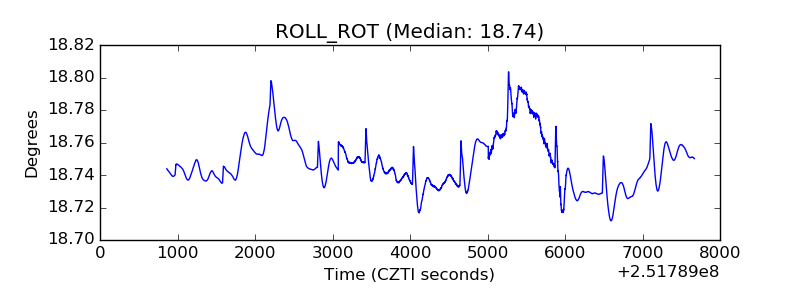 |
| _Roll_DEC | 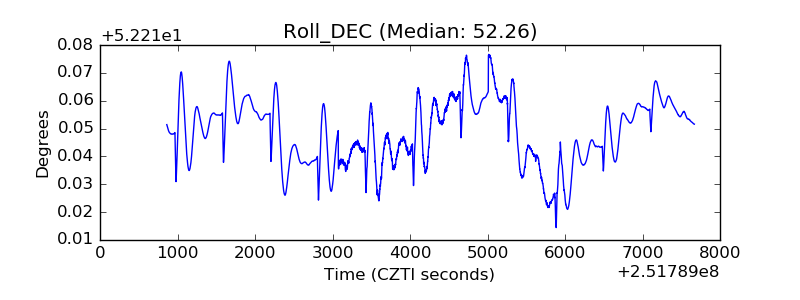 |
| _Roll_RA | 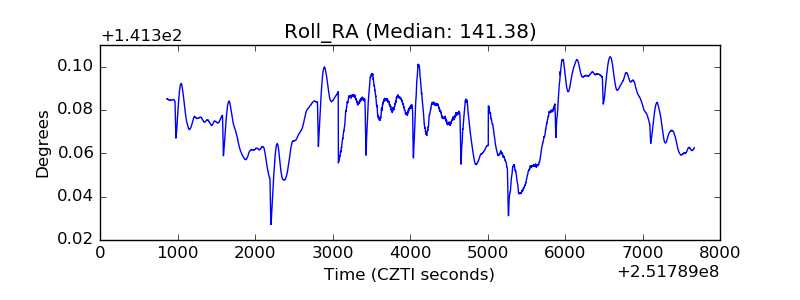 |
| Veto Counter | 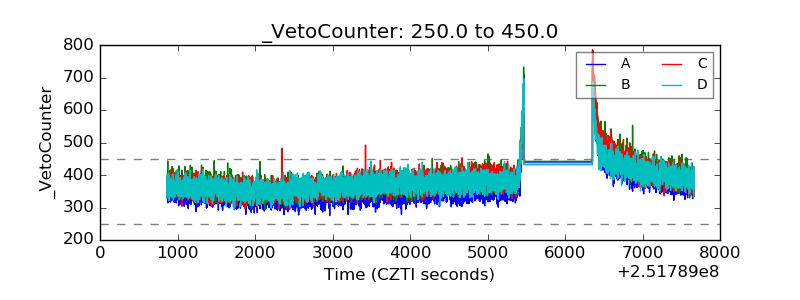 |