| Param | Original file | Final file |
|---|---|---|
| Filename | modeM0/AS1G08_065T01_9000001796_12110cztM0_level2.evt | modeM0/AS1G08_065T01_9000001796_12110cztM0_level2_quad_clean.evt |
| Size (bytes) | 502,761,600 | 86,074,560 |
| Size | 479.5 MB | 82.1 MB |
| Events in quadrant A | 3,435,343 | 544,281 |
| Events in quadrant B | 4,352,530 | 537,783 |
| Events in quadrant C | 3,087,571 | 536,658 |
| Events in quadrant D | 3,891,487 | 516,002 |
| Mode M0 | |||
|---|---|---|---|
| Quadrant | BADHDUFLAG | Total packets | Discarded packets |
| A | 0 | 14407 | 3 |
| B | 0 | 17265 | 2 |
| C | 0 | 13776 | 2 |
| D | 0 | 15829 | 2 |
| Mode M9 | |||
|---|---|---|---|
| Quadrant | BADHDUFLAG | Total packets | Discarded packets |
| A | 0 | 12 | 0 |
| B | 0 | 12 | 0 |
| C | 0 | 12 | 0 |
| D | 0 | 13 | 0 |
| Mode SS | |||
|---|---|---|---|
| Quadrant | BADHDUFLAG | Total packets | Discarded packets |
| A | 0 | 138 | 0 |
| B | 0 | 138 | 0 |
| C | 0 | 138 | 0 |
| D | 0 | 138 | 0 |
| Quadrant | Total seconds | Saturated seconds | Saturation percentage |
|---|---|---|---|
| A | 6765 | 97 | 1.433851% |
| B | 6765 | 231 | 3.414634% |
| C | 6765 | 40 | 0.591279% |
| D | 6765 | 106 | 1.566888% |
Noise dominated data is calculated using 1-second bins in cleaned event files. If a bin has >2000 counts, and if more than 50% of those come from <1% of pixels, then it is considered to be noise-dominated and hence unusable.
| Quadrant | # 1 sec bins | Bins with >0 counts | Bins with >2000 counts | High rate bins dominated by noise | Noise dominated (total time) | Noise dominated (detector-on time) | Marked lightcurve |
|---|---|---|---|---|---|---|---|
| A | 7811 | 6766 | 12 | 12 | 0.15% | 0.18% | 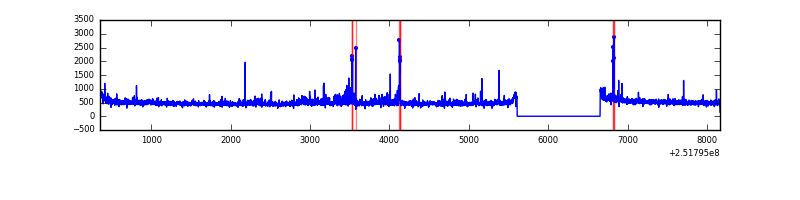 |
| B | 7811 | 6766 | 91 | 91 | 1.17% | 1.34% | 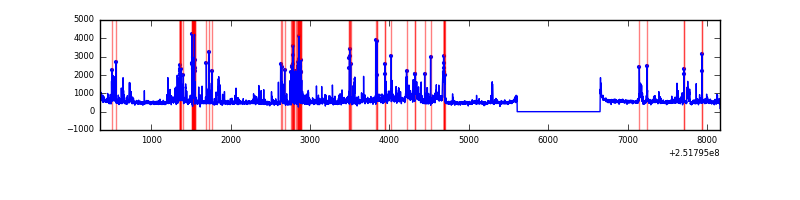 |
| C | 7811 | 6767 | 1 | 1 | 0.01% | 0.01% | 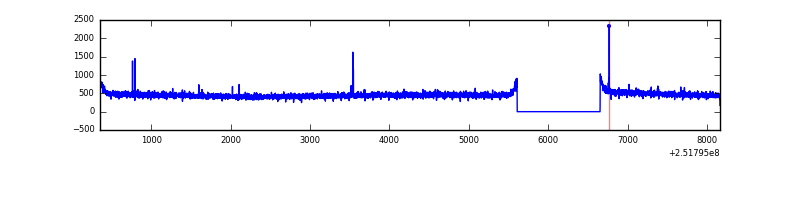 |
| D | 7811 | 6766 | 55 | 55 | 0.70% | 0.81% | 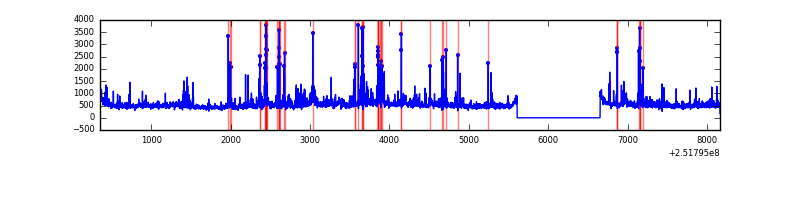 |
Top three noisy pixels from each quadrant. If the there are fewer than three noisy pixels in the level2.evt file, extra rows are filled as -1
| Pixel properties | Quadrant properties | ||||||
|---|---|---|---|---|---|---|---|
| Quadrant | DetID | PixID | Counts | Sigma | Mean | Median | Sigma |
| A | 14 | 63 | 76500 | 452.02 | 824 | 807 | 167.5 |
| A | 1 | 162 | 59875 | 352.74 | 824 | 807 | 167.5 |
| A | 5 | 16 | 40165 | 235.04 | 824 | 807 | 167.5 |
| B | 4 | 239 | 524583 | 3348.85 | 812 | 792 | 156.4 |
| B | 0 | 85 | 299171 | 1907.68 | 812 | 792 | 156.4 |
| B | 4 | 206 | 115265 | 731.88 | 812 | 792 | 156.4 |
| C | 14 | 234 | 12016 | 61.69 | 788 | 788 | 182.0 |
| C | 13 | 61 | 5765 | 27.34 | 788 | 788 | 182.0 |
| C | 15 | 208 | 3007 | 12.19 | 788 | 788 | 182.0 |
| D | 1 | 52 | 329201 | 1750.57 | 786 | 764 | 187.6 |
| D | 8 | 195 | 238247 | 1265.79 | 786 | 764 | 187.6 |
| D | 10 | 50 | 82867 | 437.61 | 786 | 764 | 187.6 |
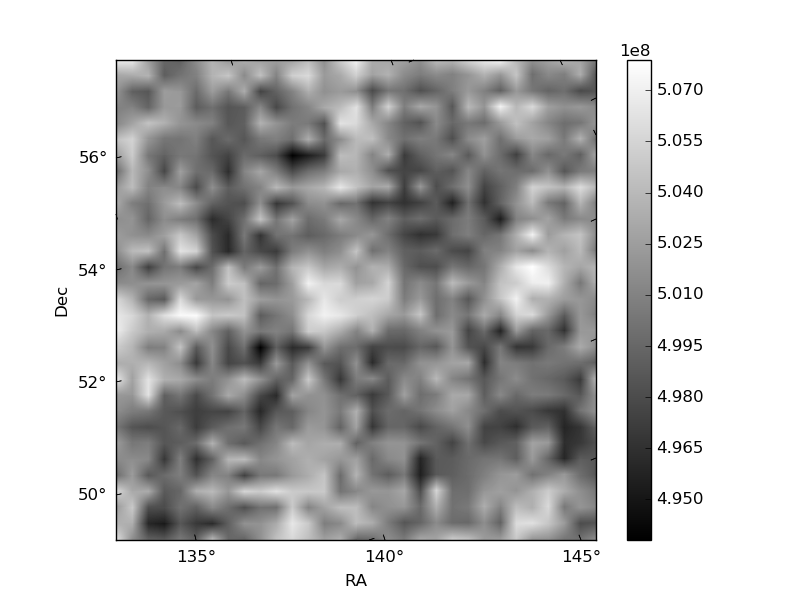
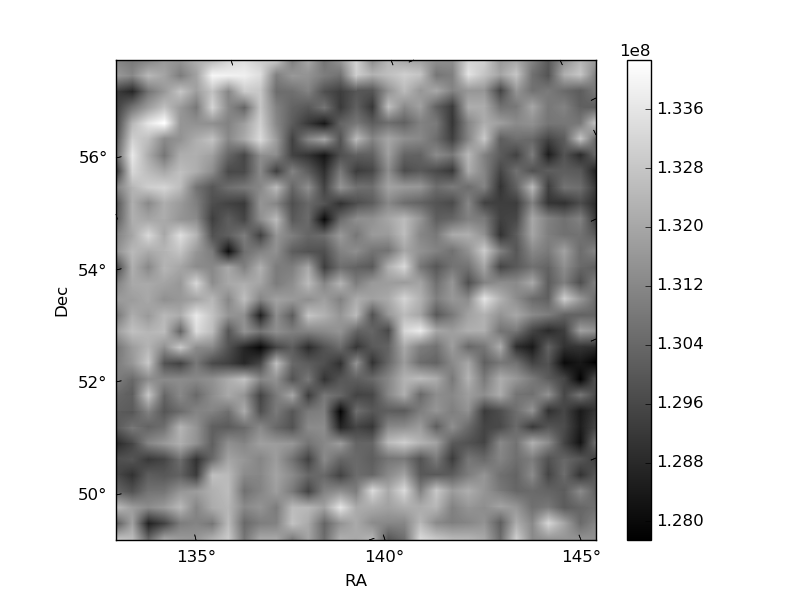
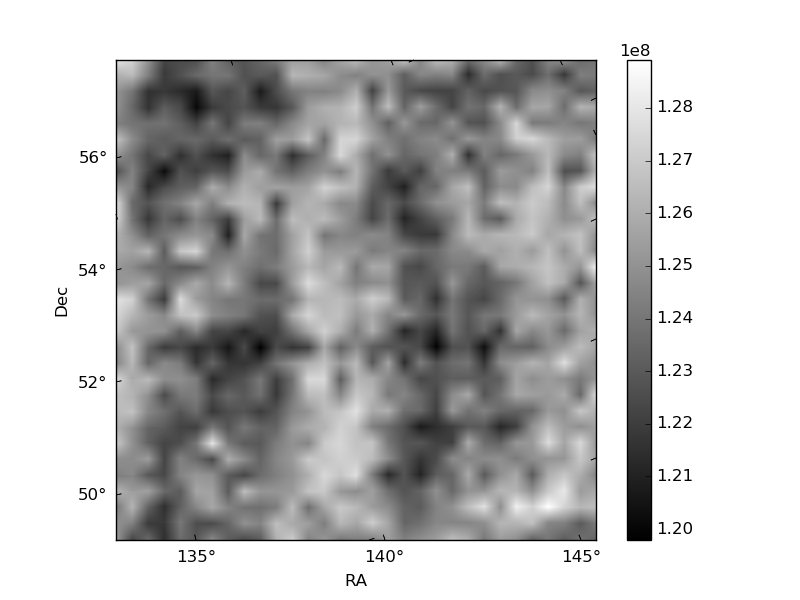
Histogram calculated using DETX and DETY for each event in the final _common_clean file
| Quadrant A | 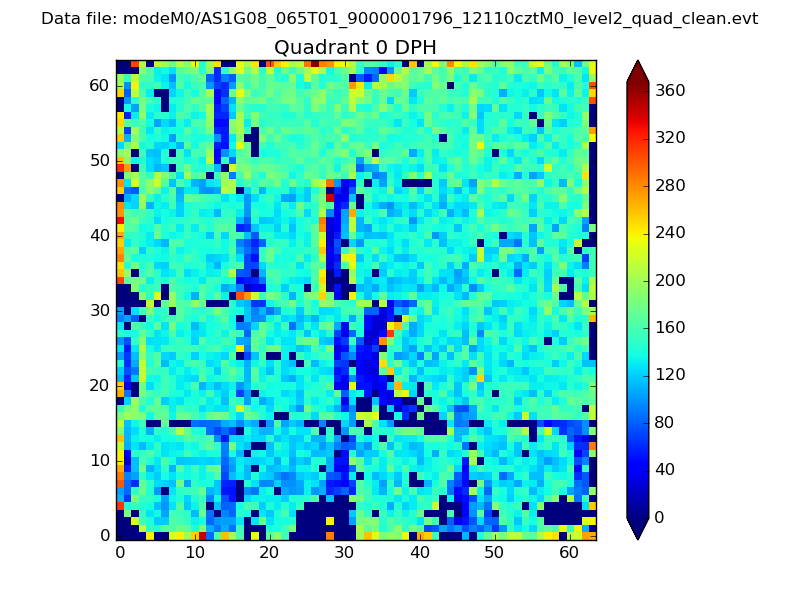 |
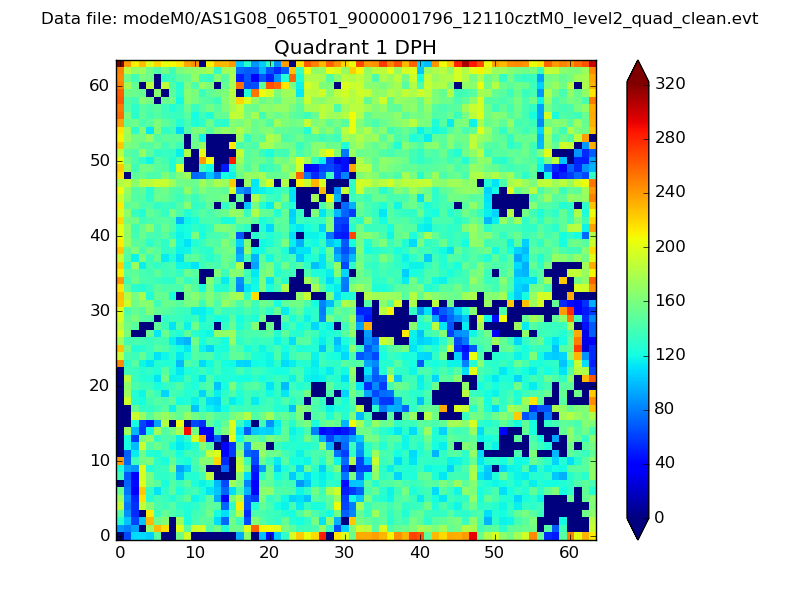 |
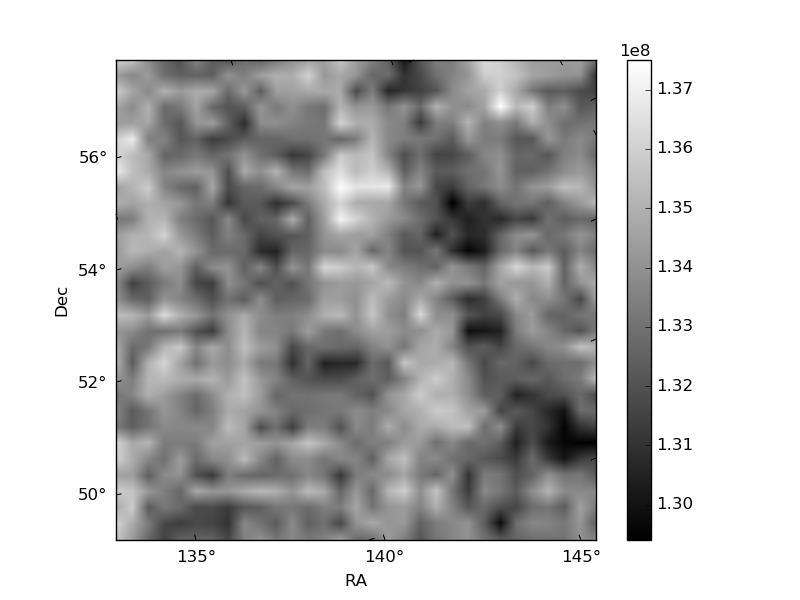
Quadrant B |
|---|---|---|---|
| Quadrant D | 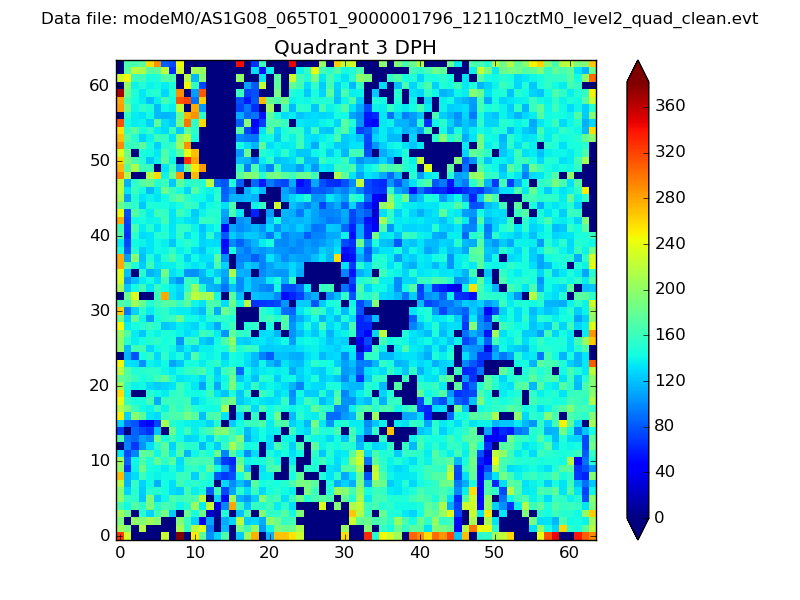 |
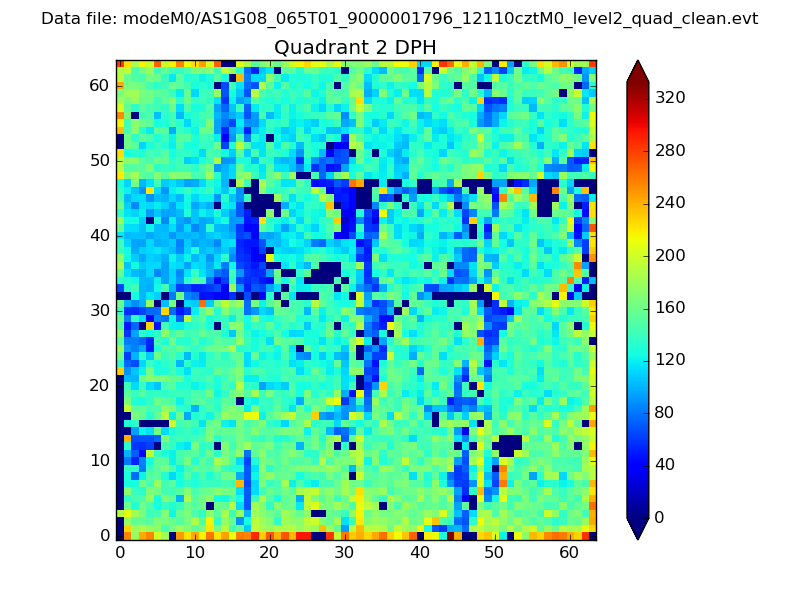 |
Quadrant C |
| Plot type | Count rate plots | Images |
|---|---|---|
| Comparison with Poisson distribution Blue bars denote a histogram of data divided into 1 sec bins. Red curve is a Poisson curve with rate = median count rate of data. |
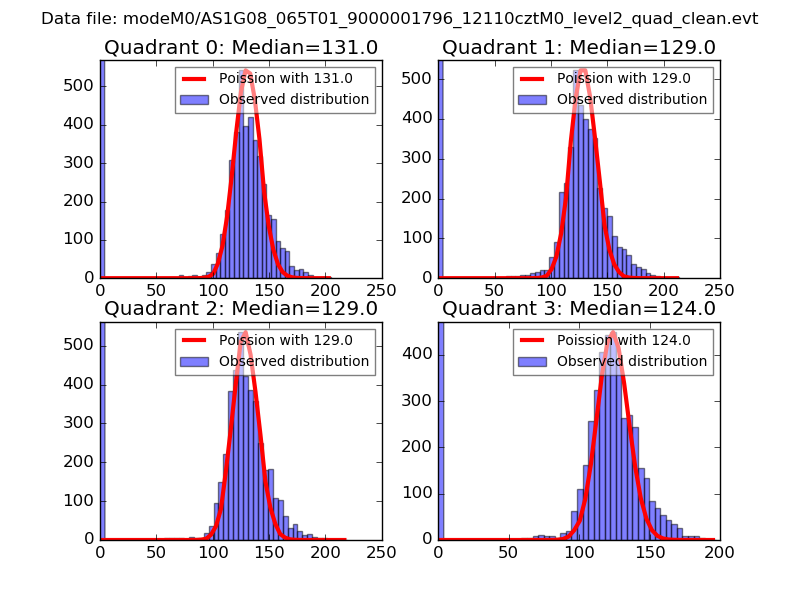 |
 |
| Quadrant-wise count rates Data is divided into 100 sec bins |
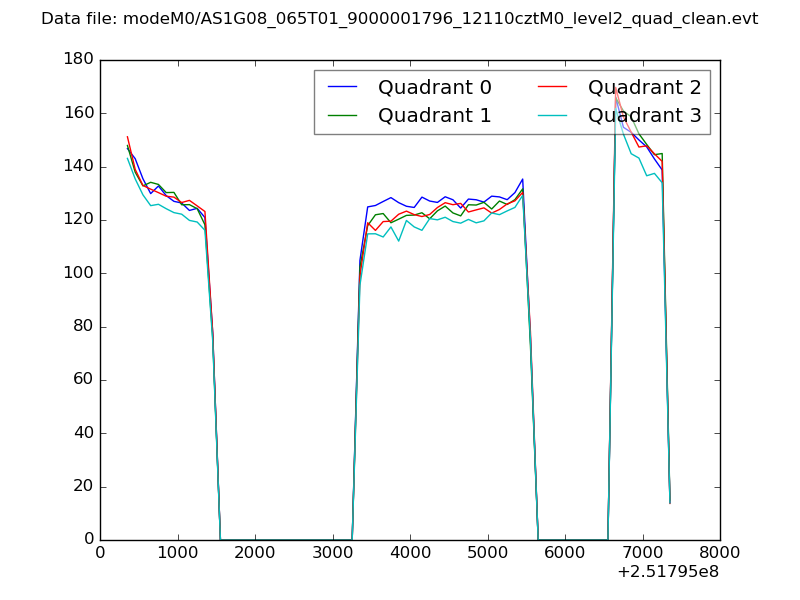 |
|
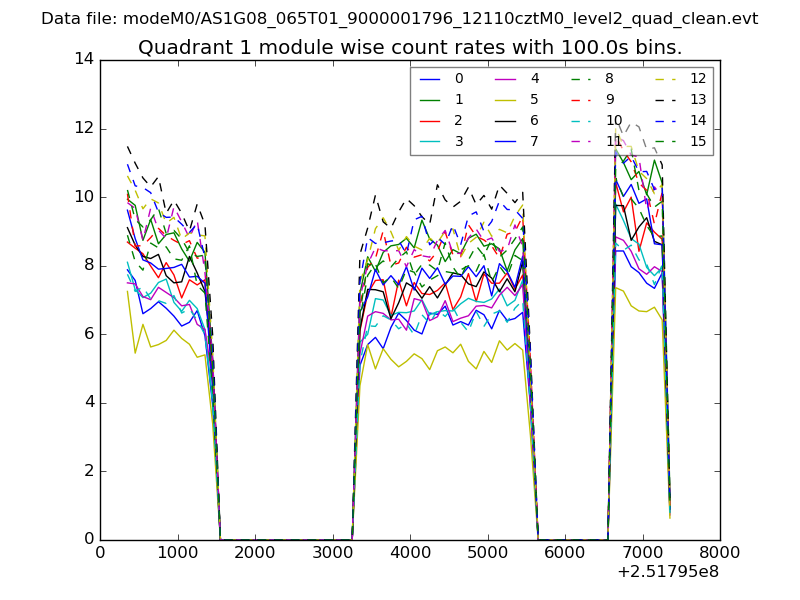
| Module-wise count rates for Quadrant A Data is divided into 100 sec bins |
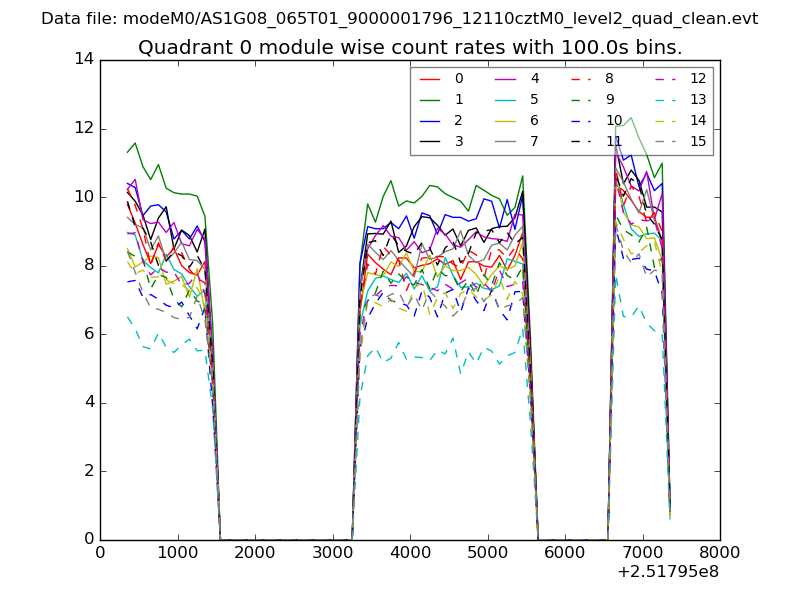 |
 |
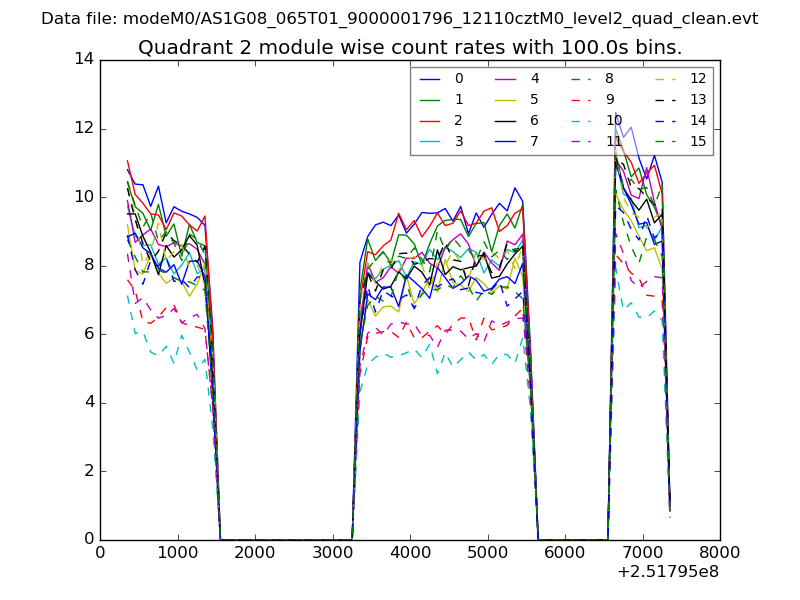
| Module-wise count rates for Quadrant B Data is divided into 100 sec bins |
 |
 |
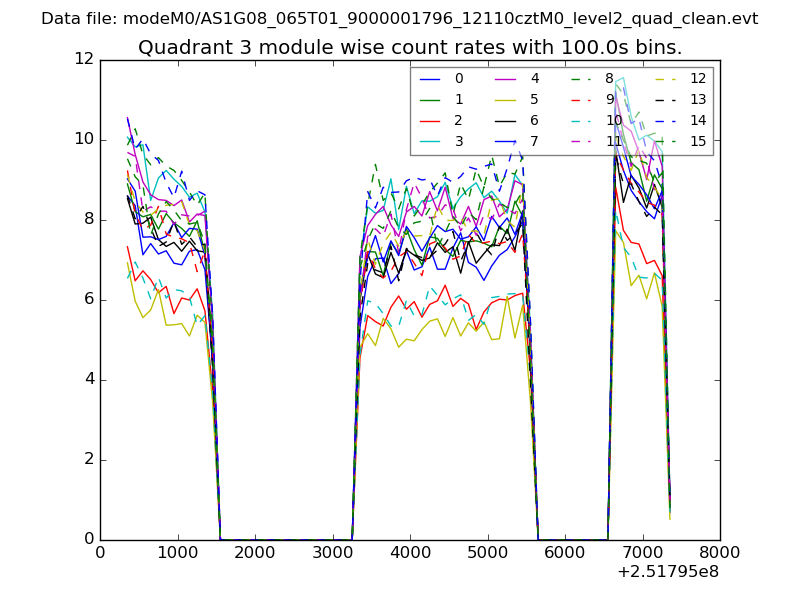
| Module-wise count rates for Quadrant C Data is divided into 100 sec bins |
 |
 |
| Module-wise count rates for Quadrant D Data is divided into 100 sec bins |
 |
 |
| Parameter | Plot |
|---|---|
| CZT HV Monitor | 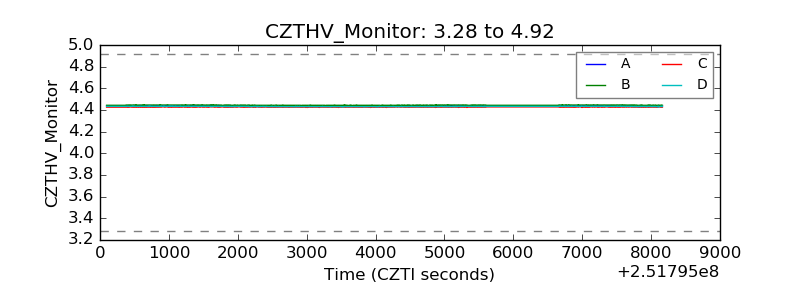 |
| D_VDD | 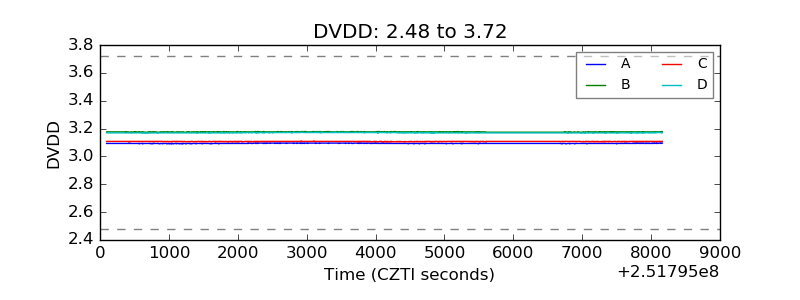 |
| Temperature 1 | 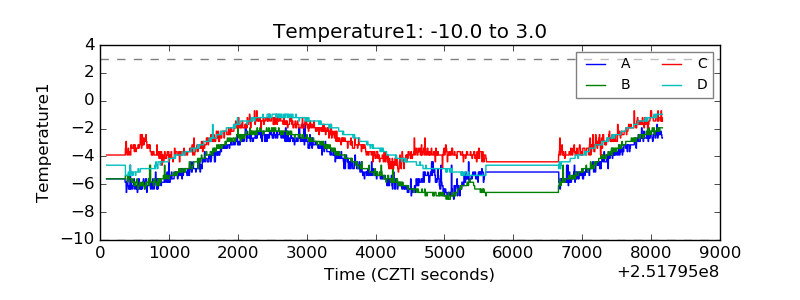 |
| Veto HV Monitor | 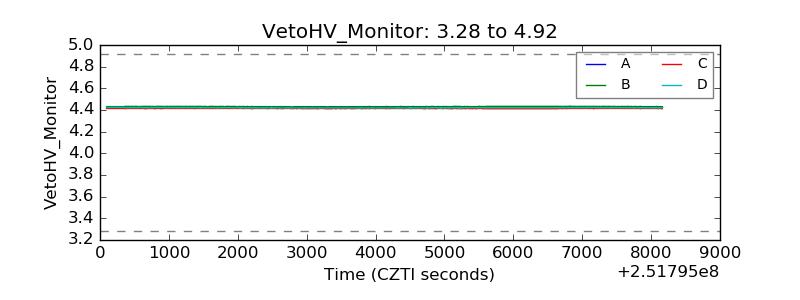 |
| Veto LLD |  |
| Alpha Counter | 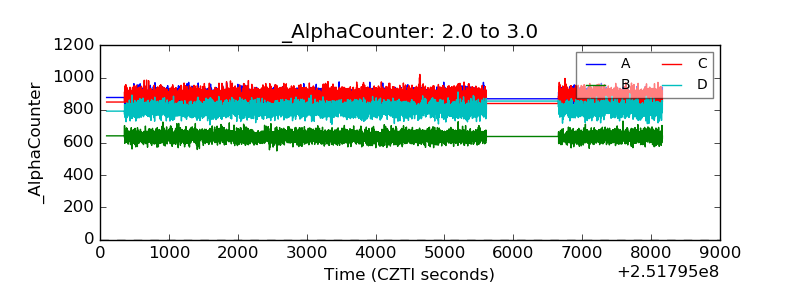 |
| _CPM_Rate | 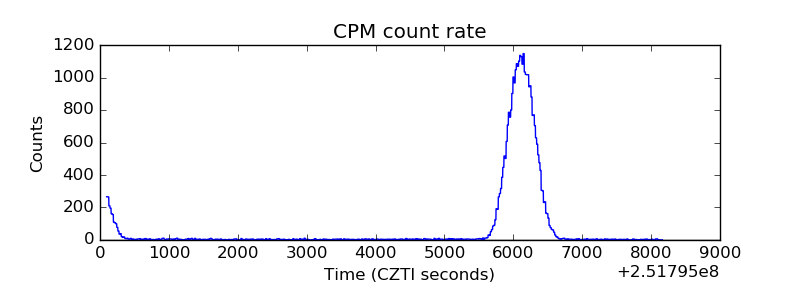 |
| CZT Counter | 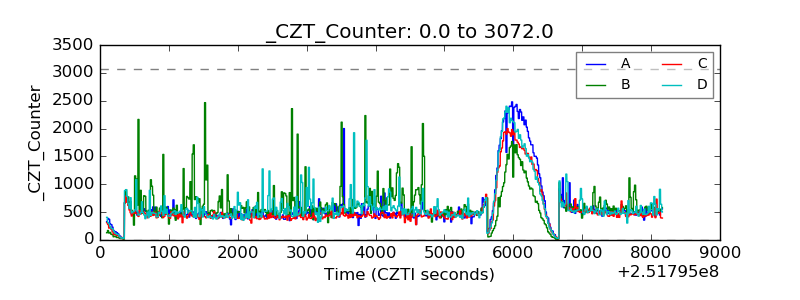 |
| +2.5 Volts monitor |  |
| +5 Volts monitor |  |
| _ROLL_ROT | 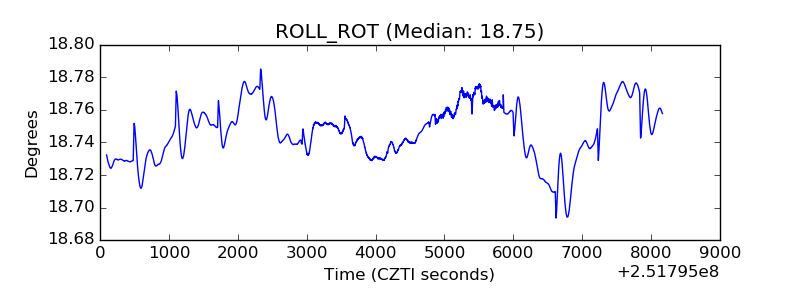 |
| _Roll_DEC | 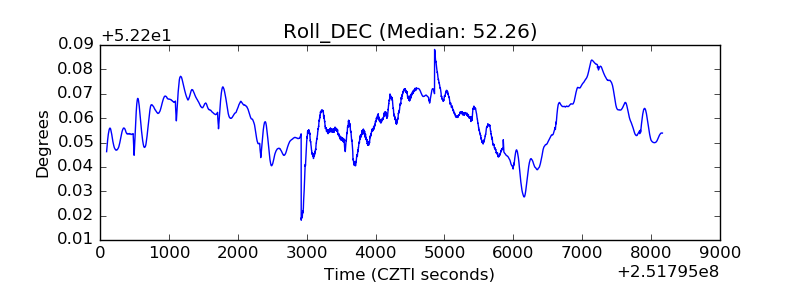 |
| _Roll_RA | 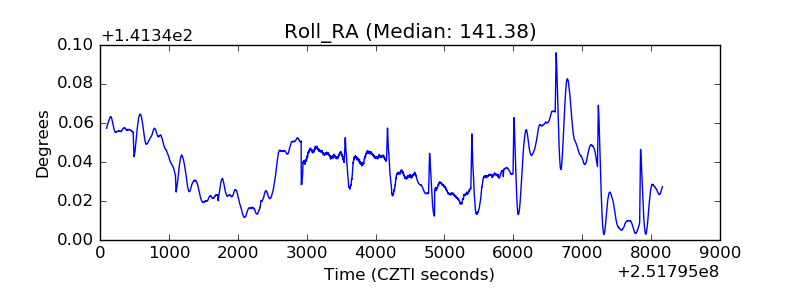 |
| Veto Counter | 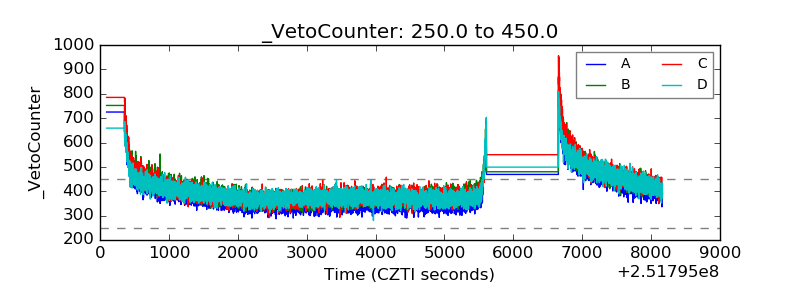 |