| Param | Original file | Final file |
|---|---|---|
| Filename | modeM0/AS1G08_065T01_9000001796_12112cztM0_level2.evt | modeM0/AS1G08_065T01_9000001796_12112cztM0_level2_quad_clean.evt |
| Size (bytes) | 523,909,440 | 78,791,040 |
| Size | 499.6 MB | 75.1 MB |
| Events in quadrant A | 3,420,889 | 492,799 |
| Events in quadrant B | 4,496,394 | 478,744 |
| Events in quadrant C | 3,218,922 | 482,720 |
| Events in quadrant D | 4,278,755 | 467,187 |
| Mode M0 | |||
|---|---|---|---|
| Quadrant | BADHDUFLAG | Total packets | Discarded packets |
| A | 0 | 14354 | 3 |
| B | 0 | 17765 | 2 |
| C | 0 | 13888 | 2 |
| D | 0 | 17049 | 2 |
| Mode M9 | |||
|---|---|---|---|
| Quadrant | BADHDUFLAG | Total packets | Discarded packets |
| A | 0 | 14 | 0 |
| B | 0 | 14 | 0 |
| C | 0 | 14 | 0 |
| D | 0 | 15 | 0 |
| Mode SS | |||
|---|---|---|---|
| Quadrant | BADHDUFLAG | Total packets | Discarded packets |
| A | 0 | 134 | 0 |
| B | 0 | 134 | 0 |
| C | 0 | 134 | 0 |
| D | 0 | 134 | 0 |
| Quadrant | Total seconds | Saturated seconds | Saturation percentage |
|---|---|---|---|
| A | 6663 | 93 | 1.395768% |
| B | 6663 | 317 | 4.757617% |
| C | 6663 | 65 | 0.975537% |
| D | 6663 | 199 | 2.986643% |
Noise dominated data is calculated using 1-second bins in cleaned event files. If a bin has >2000 counts, and if more than 50% of those come from <1% of pixels, then it is considered to be noise-dominated and hence unusable.
| Quadrant | # 1 sec bins | Bins with >0 counts | Bins with >2000 counts | High rate bins dominated by noise | Noise dominated (total time) | Noise dominated (detector-on time) | Marked lightcurve |
|---|---|---|---|---|---|---|---|
| A | 7814 | 6664 | 4 | 4 | 0.05% | 0.06% | 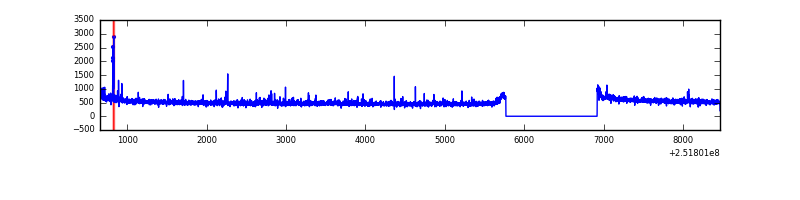 |
| B | 7814 | 6664 | 122 | 122 | 1.56% | 1.83% | 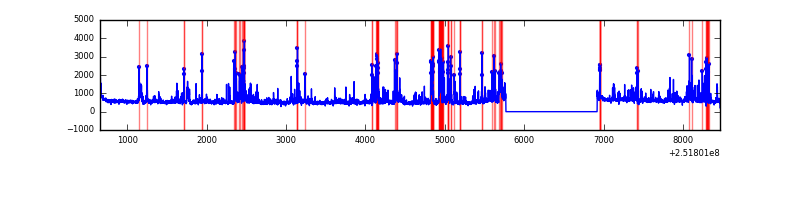 |
| C | 7814 | 6664 | 3 | 3 | 0.04% | 0.05% | 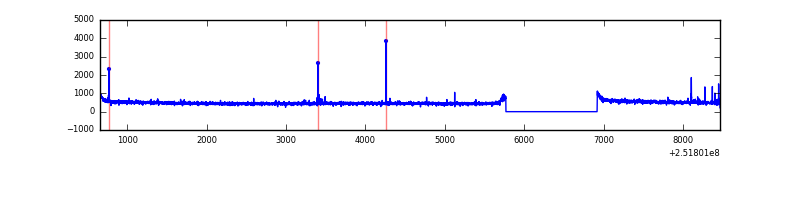 |
| D | 7814 | 6664 | 96 | 96 | 1.23% | 1.44% | 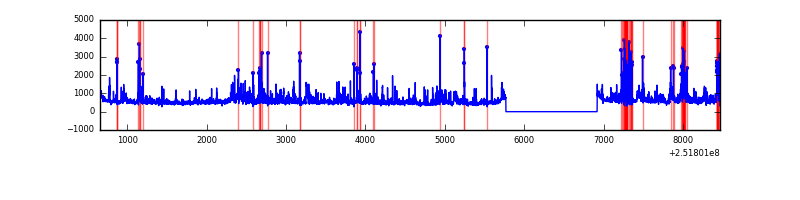 |
Top three noisy pixels from each quadrant. If the there are fewer than three noisy pixels in the level2.evt file, extra rows are filled as -1
| Pixel properties | Quadrant properties | ||||||
|---|---|---|---|---|---|---|---|
| Quadrant | DetID | PixID | Counts | Sigma | Mean | Median | Sigma |
| A | 1 | 162 | 33475 | 191.63 | 853 | 838 | 170.3 |
| A | 5 | 16 | 24970 | 141.7 | 853 | 838 | 170.3 |
| A | 14 | 63 | 16649 | 92.84 | 853 | 838 | 170.3 |
| B | 4 | 239 | 852116 | 5497.09 | 832 | 814 | 154.9 |
| B | 15 | 204 | 122718 | 787.17 | 832 | 814 | 154.9 |
| B | 0 | 85 | 84518 | 540.5 | 832 | 814 | 154.9 |
| C | 15 | 208 | 19263 | 98.68 | 816 | 821 | 186.9 |
| C | 14 | 234 | 18316 | 93.61 | 816 | 821 | 186.9 |
| C | 13 | 61 | 5909 | 27.22 | 816 | 821 | 186.9 |
| D | 1 | 52 | 903713 | 4676.93 | 811 | 789 | 193.1 |
| D | 10 | 50 | 91933 | 472.1 | 811 | 789 | 193.1 |
| D | 10 | 199 | 91528 | 470.01 | 811 | 789 | 193.1 |
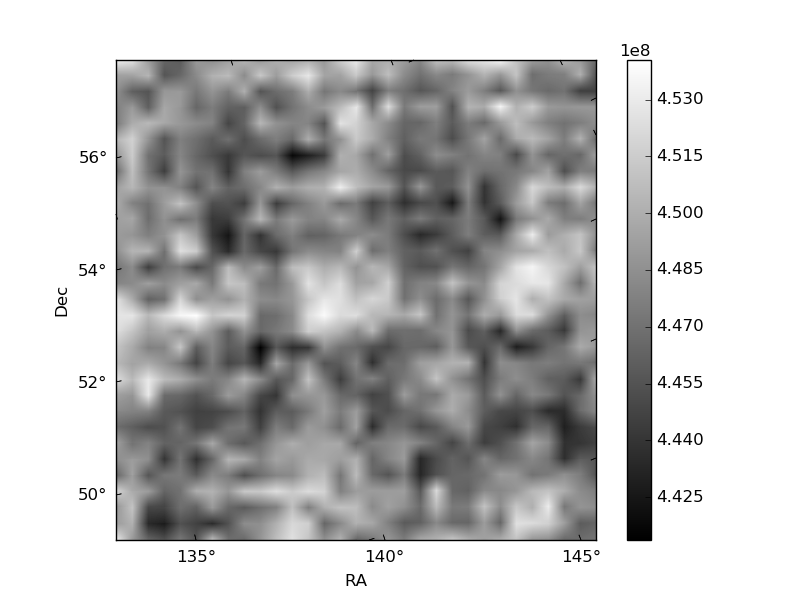
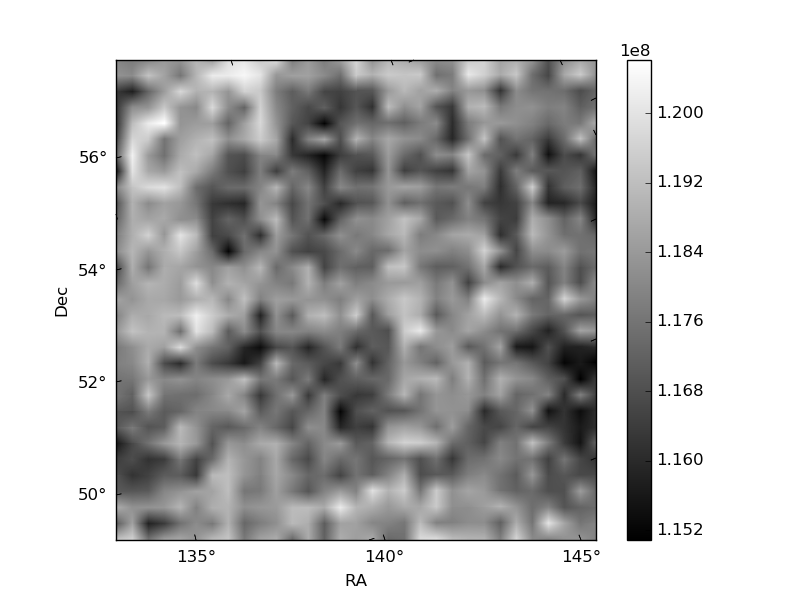
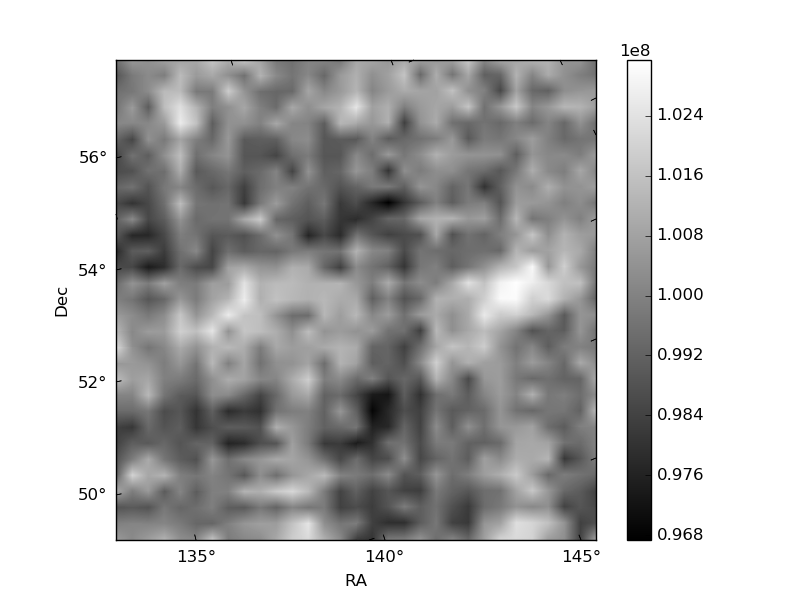
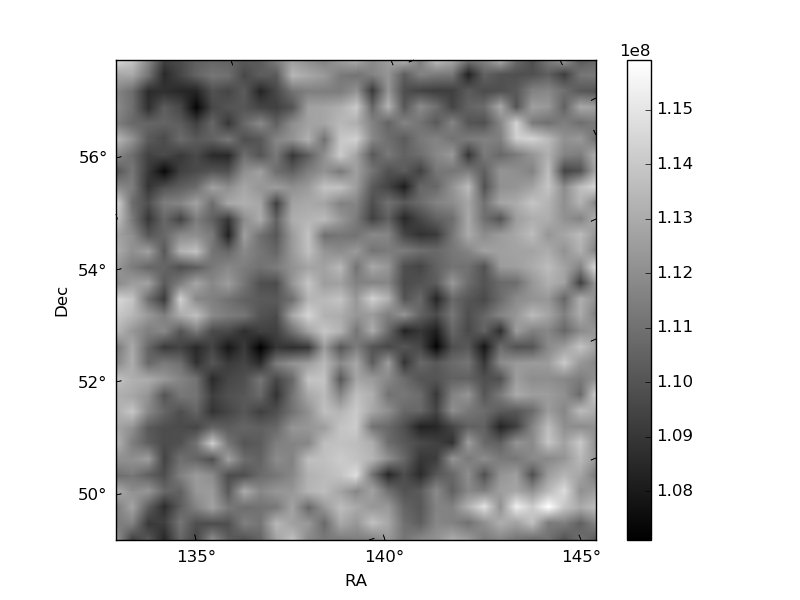
Histogram calculated using DETX and DETY for each event in the final _common_clean file
| Quadrant A | 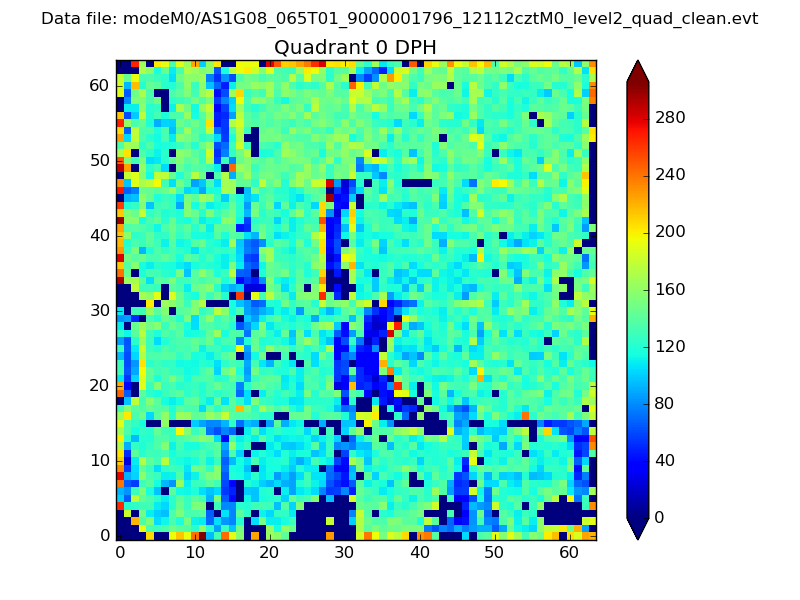 |
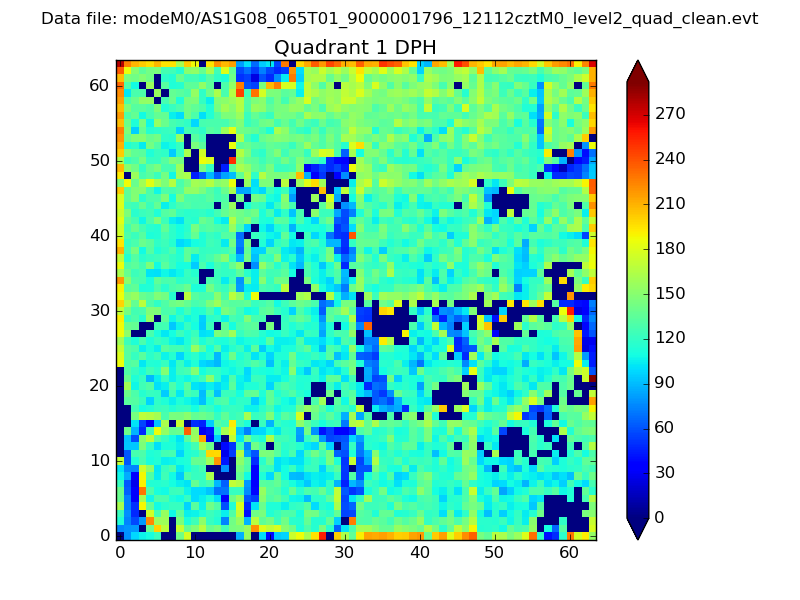 |
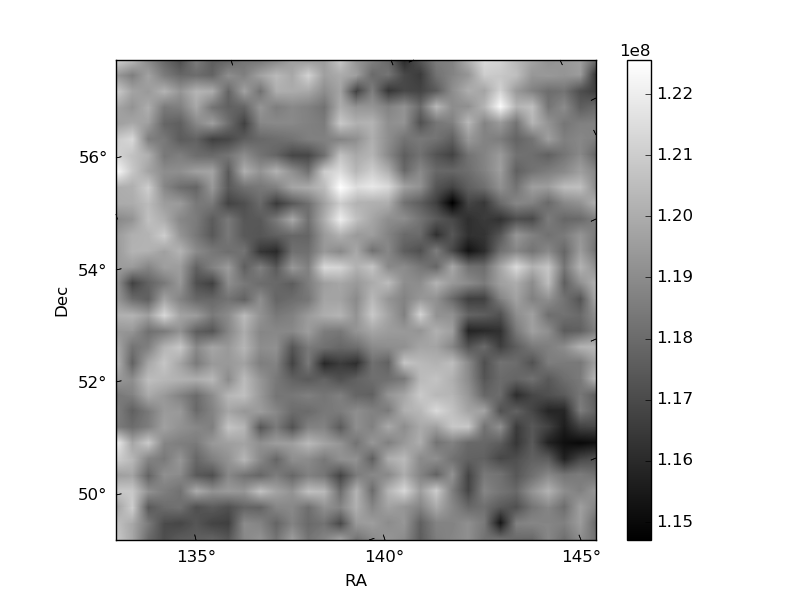
Quadrant B |
|---|---|---|---|
| Quadrant D | 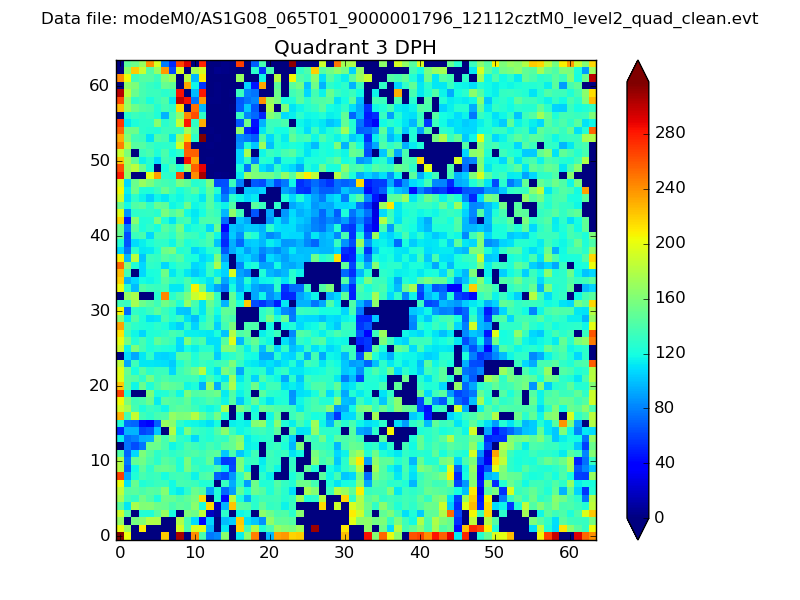 |
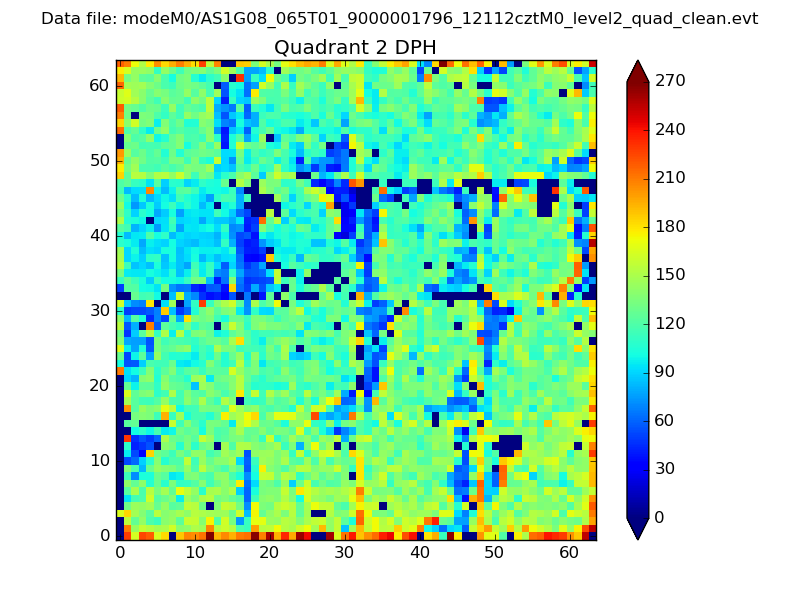 |
Quadrant C |
| Plot type | Count rate plots | Images |
|---|---|---|
| Comparison with Poisson distribution Blue bars denote a histogram of data divided into 1 sec bins. Red curve is a Poisson curve with rate = median count rate of data. |
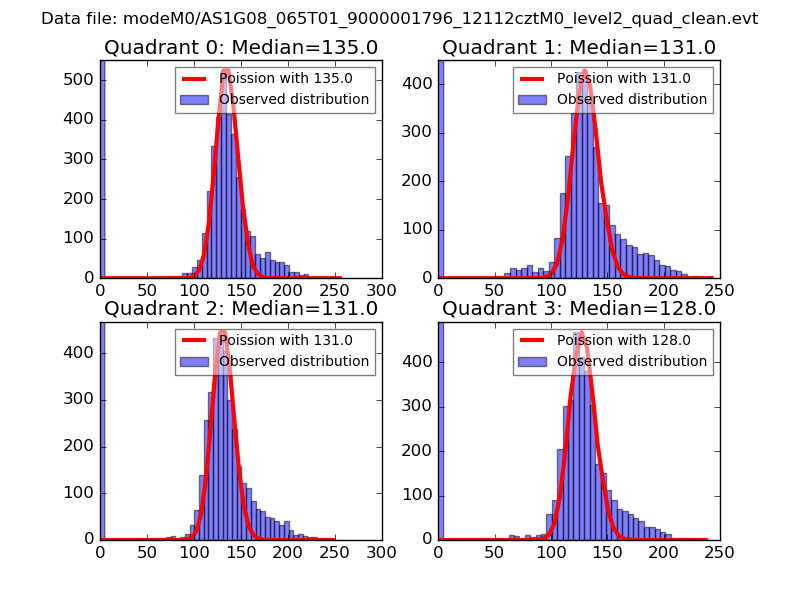 |
 |
| Quadrant-wise count rates Data is divided into 100 sec bins |
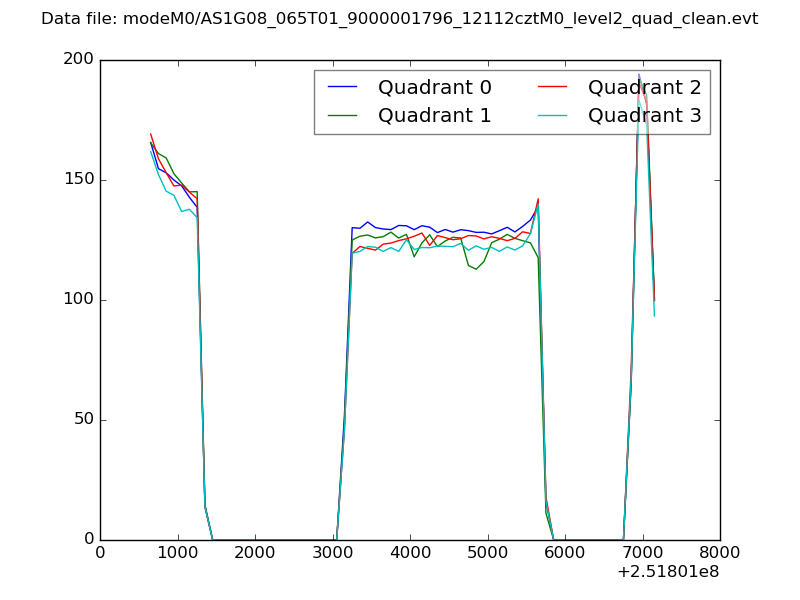 |
|
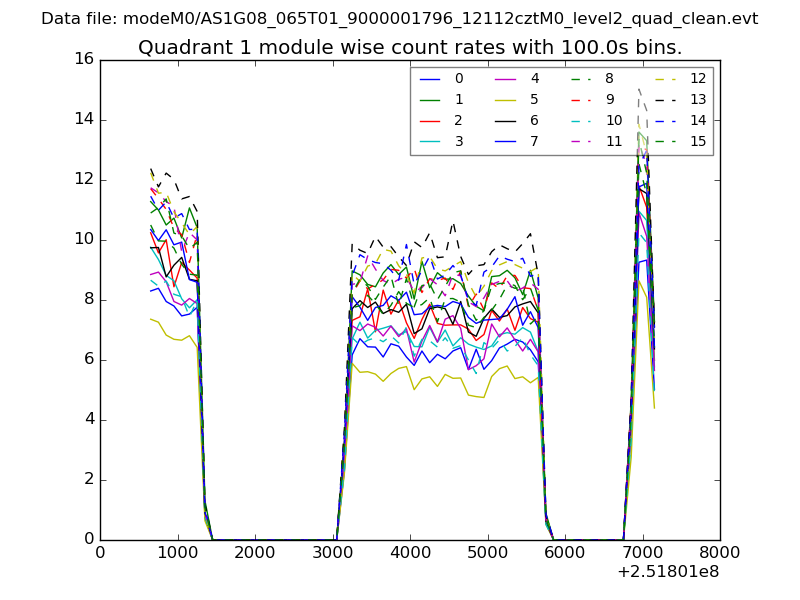
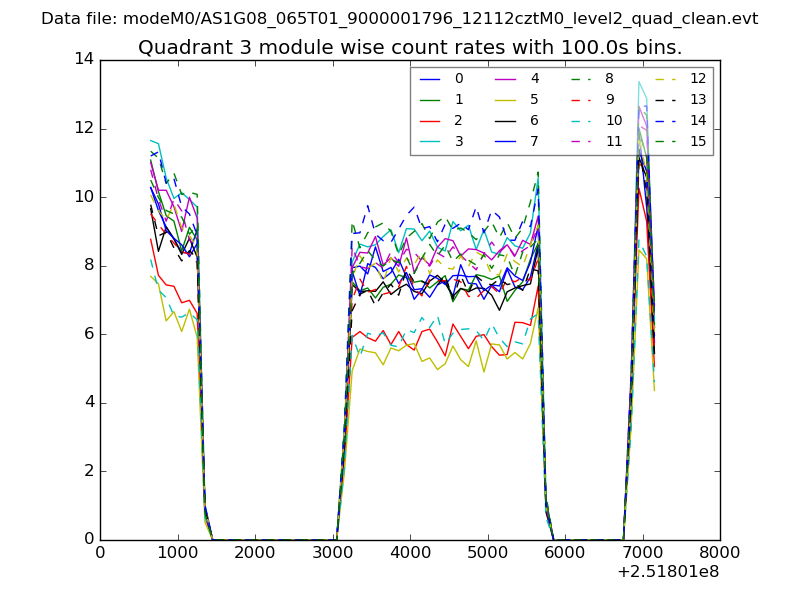
| Module-wise count rates for Quadrant A Data is divided into 100 sec bins |
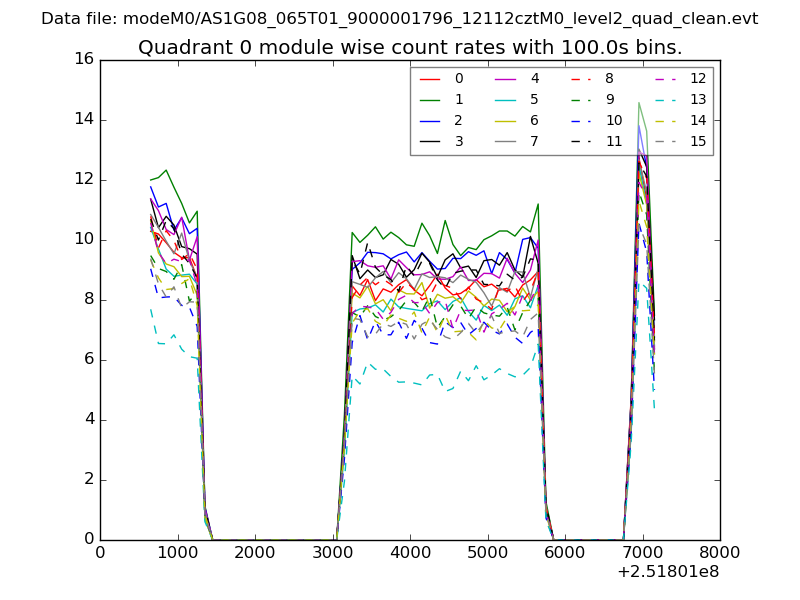 |
 |
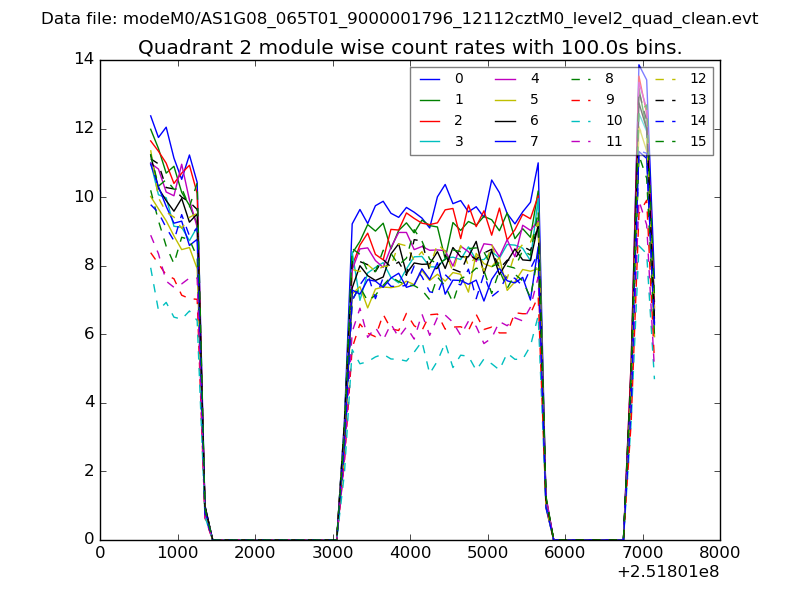
| Module-wise count rates for Quadrant B Data is divided into 100 sec bins |
 |
 |
| Module-wise count rates for Quadrant C Data is divided into 100 sec bins |
 |
 |
| Module-wise count rates for Quadrant D Data is divided into 100 sec bins |
 |
 |
| Parameter | Plot |
|---|---|
| CZT HV Monitor | 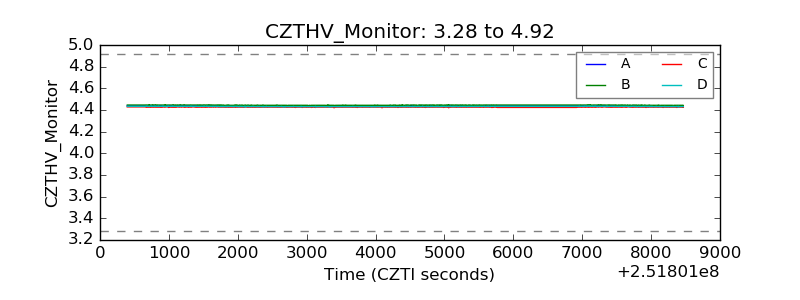 |
| D_VDD | 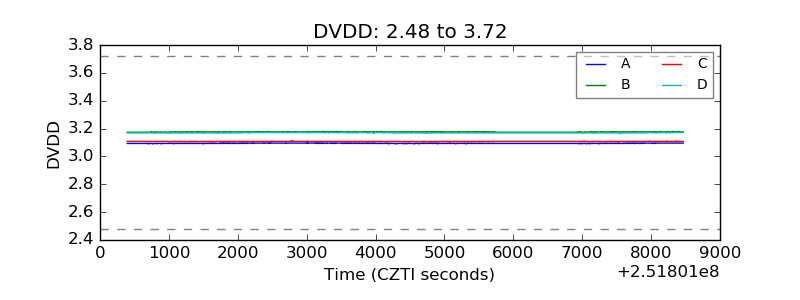 |
| Temperature 1 | 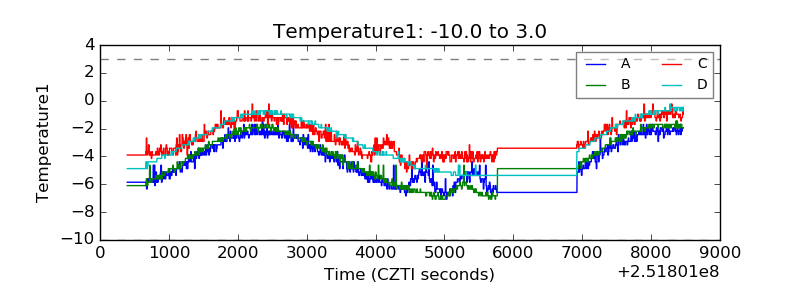 |
| Veto HV Monitor | 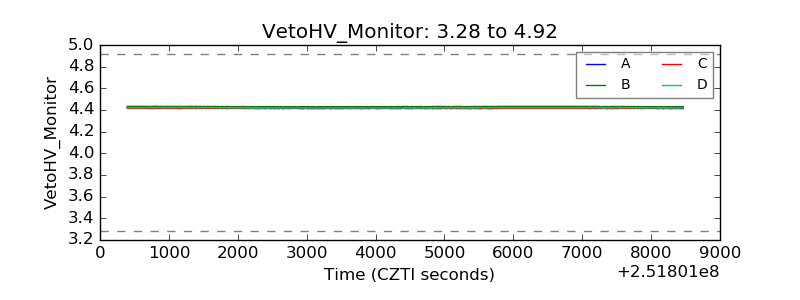 |
| Veto LLD | 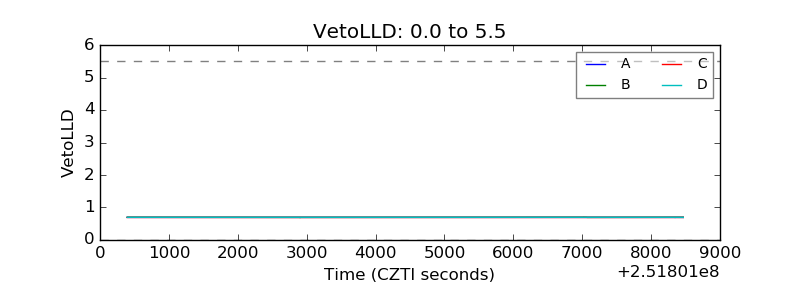 |
| Alpha Counter | 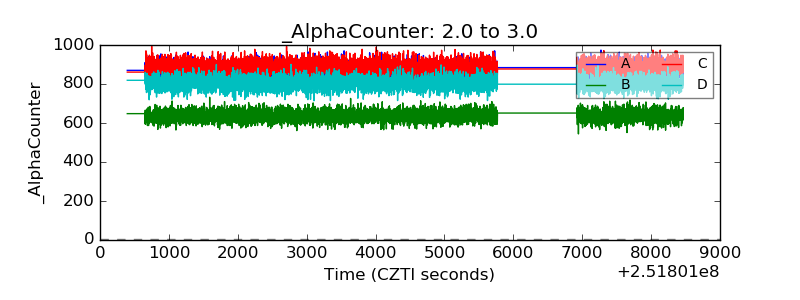 |
| _CPM_Rate | 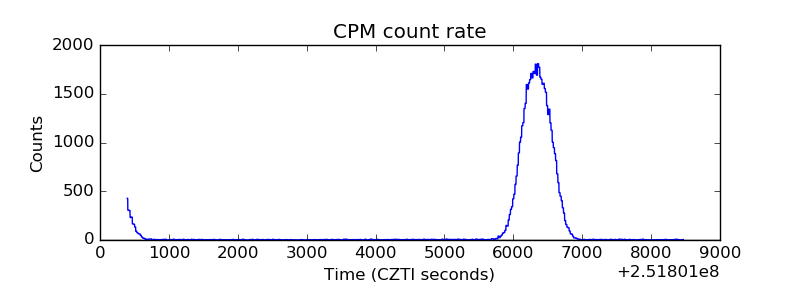 |
| CZT Counter | 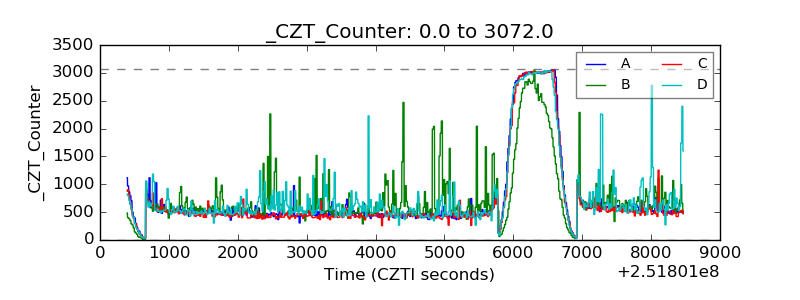 |
| +2.5 Volts monitor |  |
| +5 Volts monitor |  |
| _ROLL_ROT | 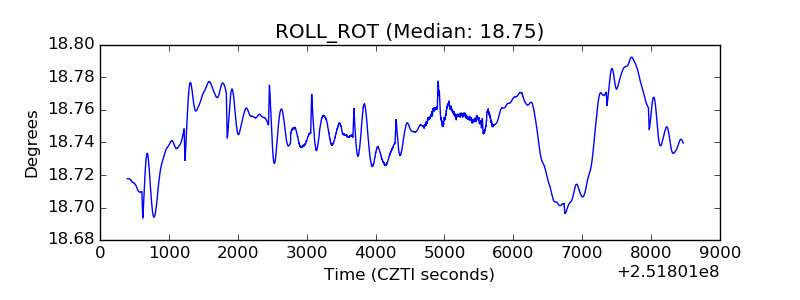 |
| _Roll_DEC | 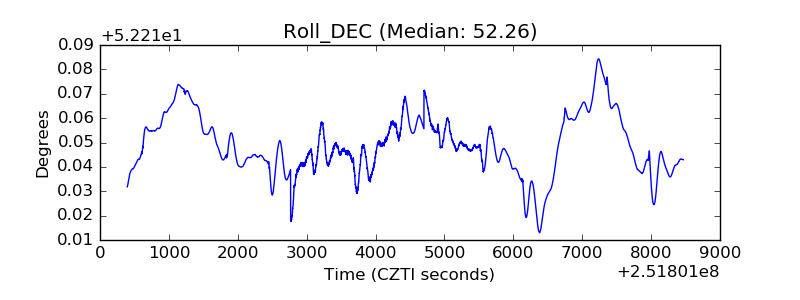 |
| _Roll_RA | 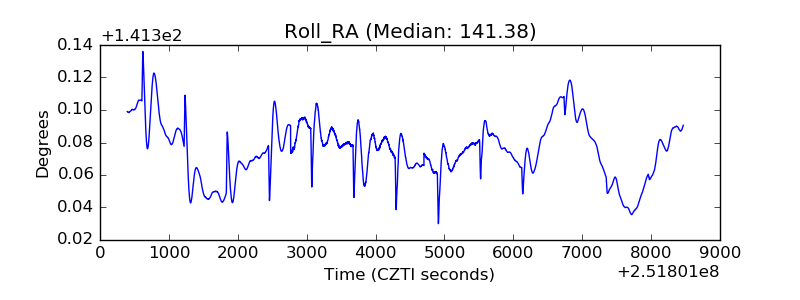 |
| Veto Counter | 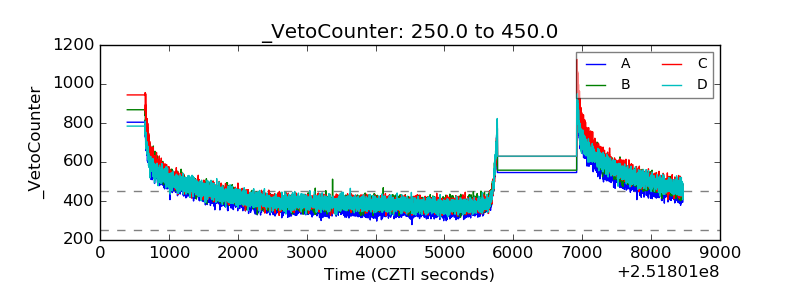 |