| Param | Original file | Final file |
|---|---|---|
| Filename | modeM0/AS1G08_065T01_9000001796_12115cztM0_level2.evt | modeM0/AS1G08_065T01_9000001796_12115cztM0_level2_quad_clean.evt |
| Size (bytes) | 558,596,160 | 87,969,600 |
| Size | 532.7 MB | 83.9 MB |
| Events in quadrant A | 3,727,862 | 569,977 |
| Events in quadrant B | 5,182,113 | 542,338 |
| Events in quadrant C | 3,238,680 | 568,016 |
| Events in quadrant D | 4,341,649 | 543,622 |
| Mode M0 | |||
|---|---|---|---|
| Quadrant | BADHDUFLAG | Total packets | Discarded packets |
| A | 0 | 15346 | 3 |
| B | 0 | 20078 | 2 |
| C | 0 | 13582 | 2 |
| D | 0 | 17189 | 2 |
| Mode M9 | |||
|---|---|---|---|
| Quadrant | BADHDUFLAG | Total packets | Discarded packets |
| A | 0 | 22 | 0 |
| B | 0 | 22 | 0 |
| C | 0 | 22 | 0 |
| D | 0 | 23 | 0 |
| Mode SS | |||
|---|---|---|---|
| Quadrant | BADHDUFLAG | Total packets | Discarded packets |
| A | 0 | 128 | 0 |
| B | 0 | 128 | 0 |
| C | 0 | 128 | 0 |
| D | 0 | 128 | 0 |
| Quadrant | Total seconds | Saturated seconds | Saturation percentage |
|---|---|---|---|
| A | 6302 | 152 | 2.411933% |
| B | 6302 | 455 | 7.219930% |
| C | 6302 | 82 | 1.301174% |
| D | 6302 | 167 | 2.649952% |
Noise dominated data is calculated using 1-second bins in cleaned event files. If a bin has >2000 counts, and if more than 50% of those come from <1% of pixels, then it is considered to be noise-dominated and hence unusable.
| Quadrant | # 1 sec bins | Bins with >0 counts | Bins with >2000 counts | High rate bins dominated by noise | Noise dominated (total time) | Noise dominated (detector-on time) | Marked lightcurve |
|---|---|---|---|---|---|---|---|
| A | 7633 | 6304 | 20 | 20 | 0.26% | 0.32% | 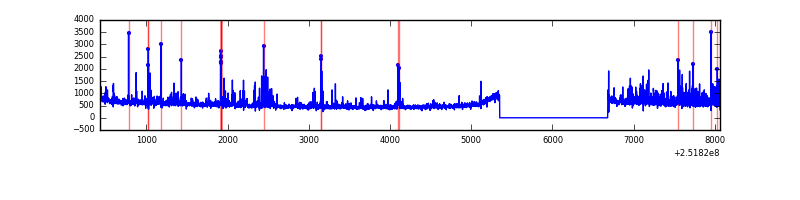 |
| B | 7633 | 6303 | 251 | 251 | 3.29% | 3.98% | 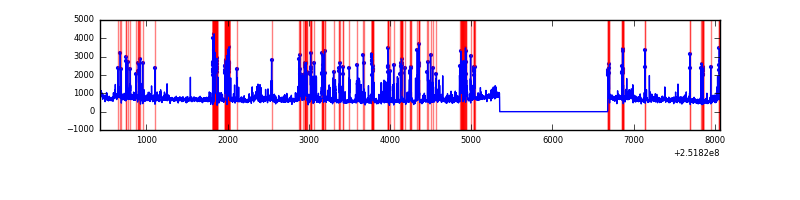 |
| C | 7633 | 6304 | 0 | 0 | 0.00% | 0.00% | 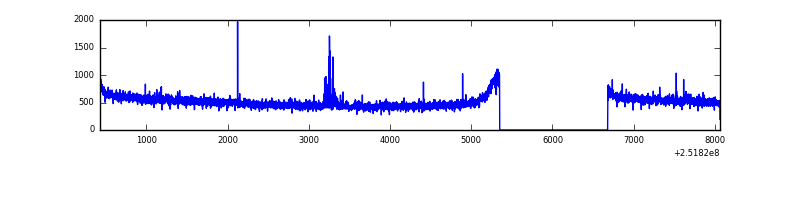 |
| D | 7633 | 6304 | 61 | 61 | 0.80% | 0.97% | 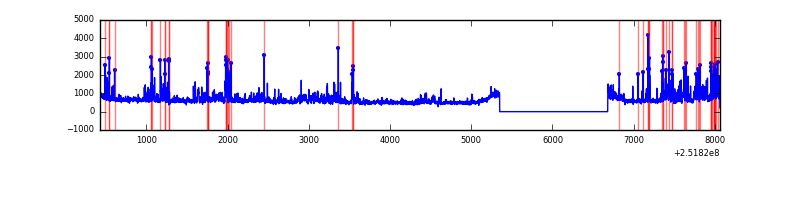 |
Top three noisy pixels from each quadrant. If the there are fewer than three noisy pixels in the level2.evt file, extra rows are filled as -1
| Pixel properties | Quadrant properties | ||||||
|---|---|---|---|---|---|---|---|
| Quadrant | DetID | PixID | Counts | Sigma | Mean | Median | Sigma |
| A | 1 | 162 | 150144 | 897.72 | 835 | 817 | 166.3 |
| A | 14 | 63 | 105264 | 627.91 | 835 | 817 | 166.3 |
| A | 1 | 178 | 63185 | 374.94 | 835 | 817 | 166.3 |
| B | 4 | 239 | 1167897 | 7752.69 | 814 | 797 | 150.5 |
| B | 4 | 206 | 427322 | 2833.28 | 814 | 797 | 150.5 |
| B | 15 | 204 | 116375 | 767.75 | 814 | 797 | 150.5 |
| C | 15 | 208 | 27581 | 143.63 | 822 | 828 | 186.3 |
| C | 13 | 61 | 6123 | 28.43 | 822 | 828 | 186.3 |
| C | 14 | 234 | 3957 | 16.8 | 822 | 828 | 186.3 |
| D | 1 | 52 | 499860 | 2595.82 | 818 | 799 | 192.3 |
| D | 4 | 95 | 275380 | 1428.21 | 818 | 799 | 192.3 |
| D | 8 | 195 | 235710 | 1221.87 | 818 | 799 | 192.3 |
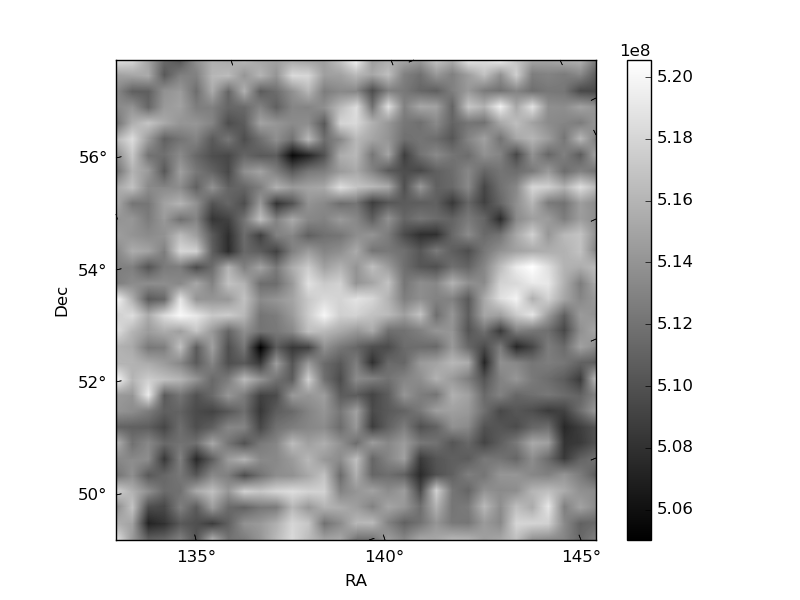
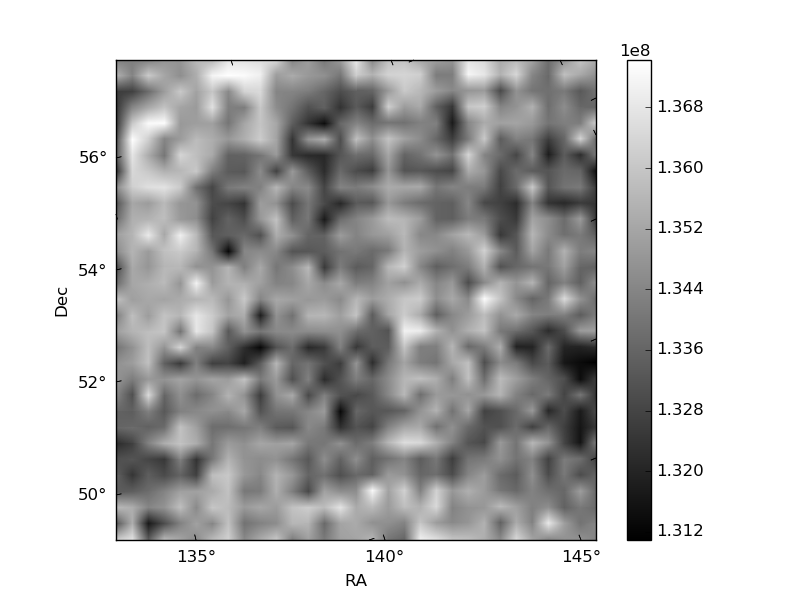
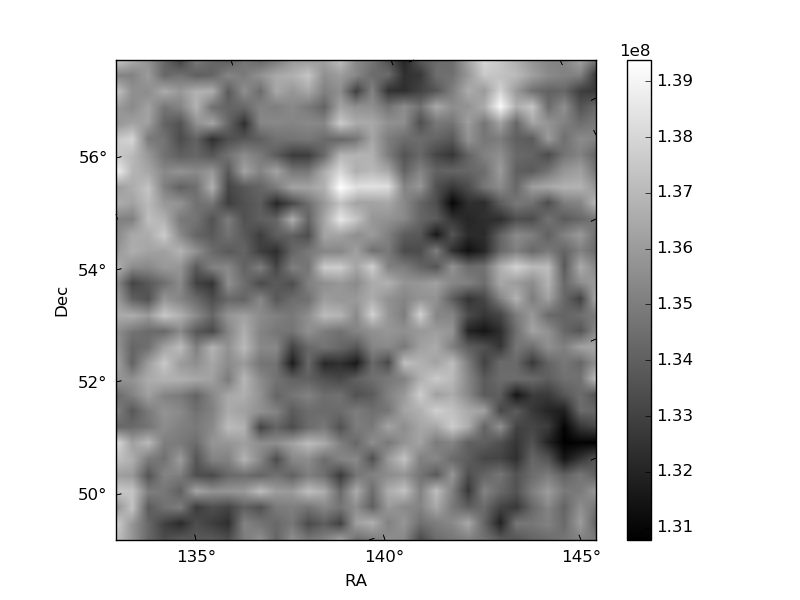
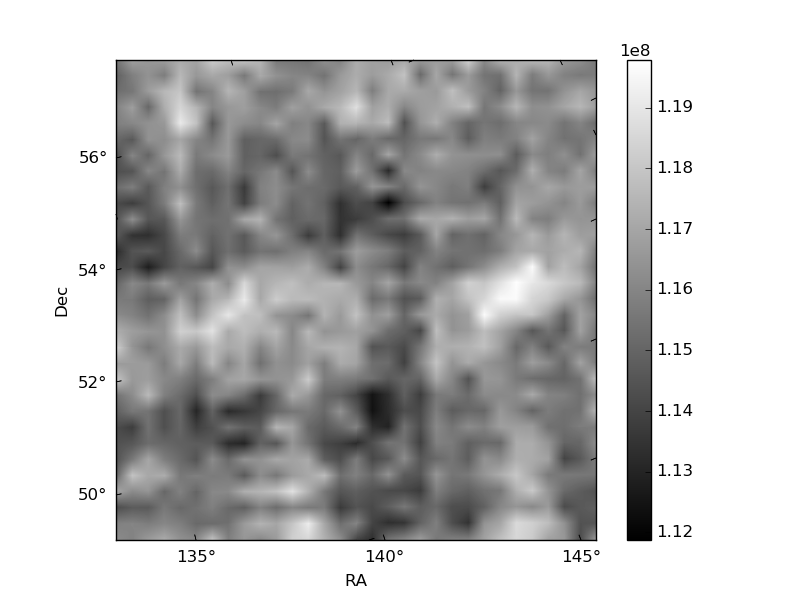
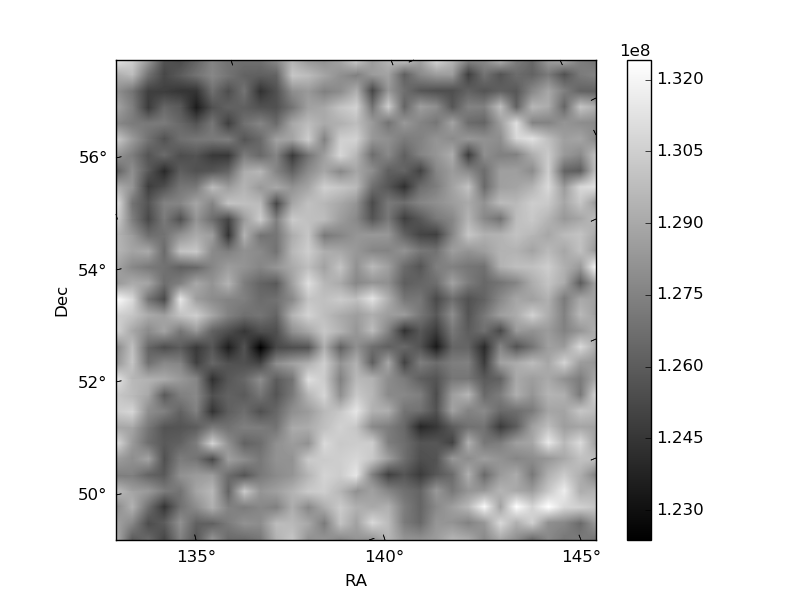
Histogram calculated using DETX and DETY for each event in the final _common_clean file
| Quadrant A | 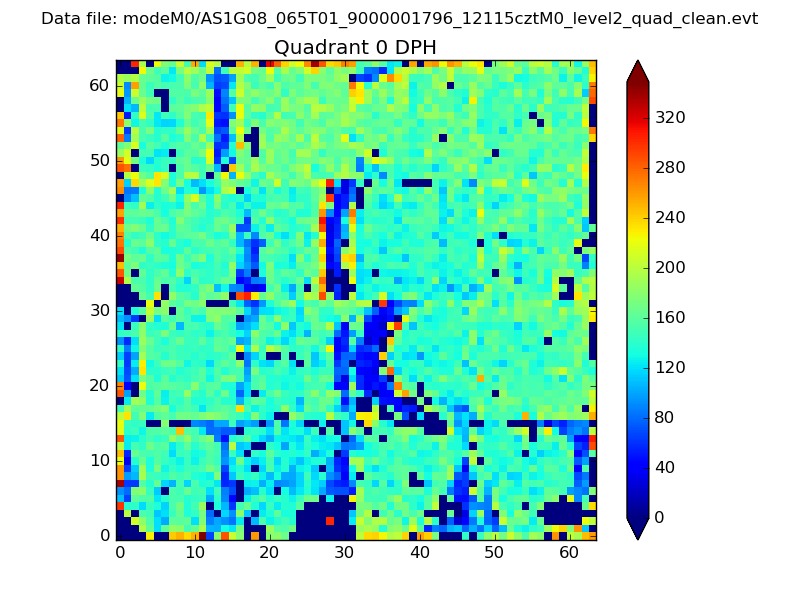 |
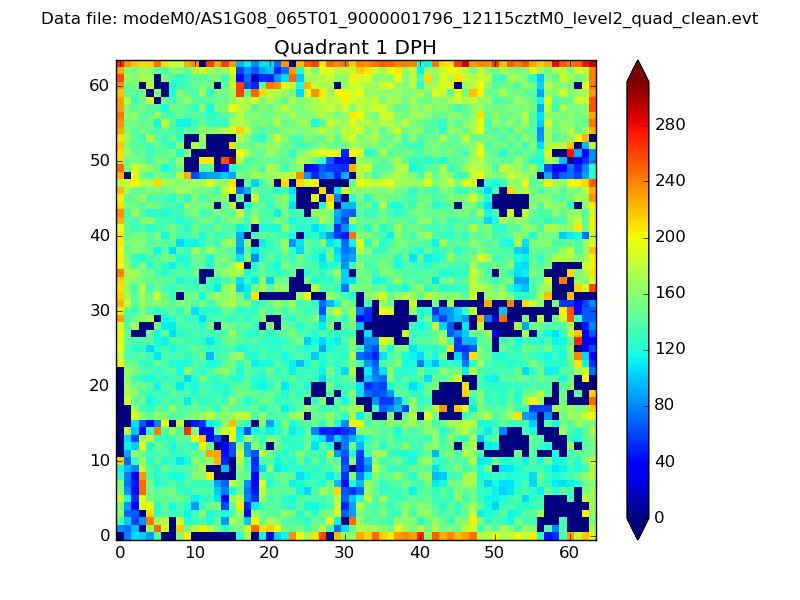 |
Quadrant B |
|---|---|---|---|
| Quadrant D | 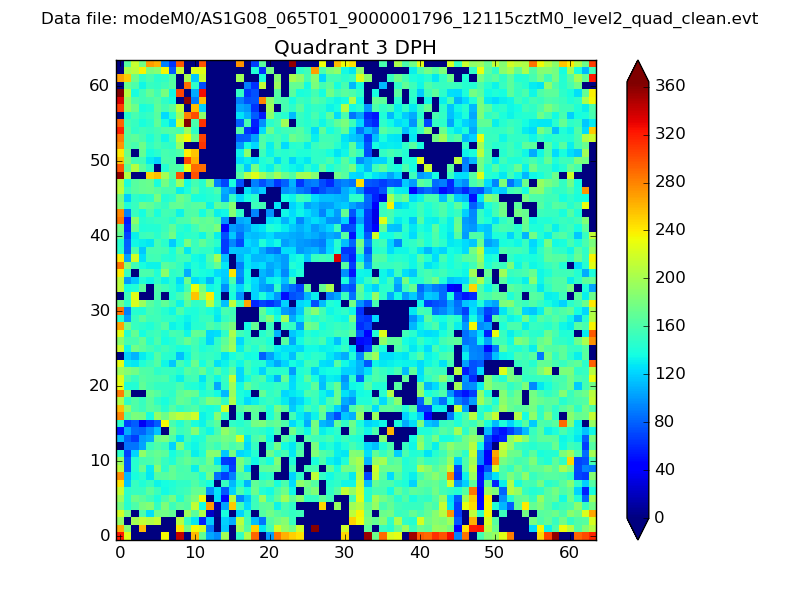 |
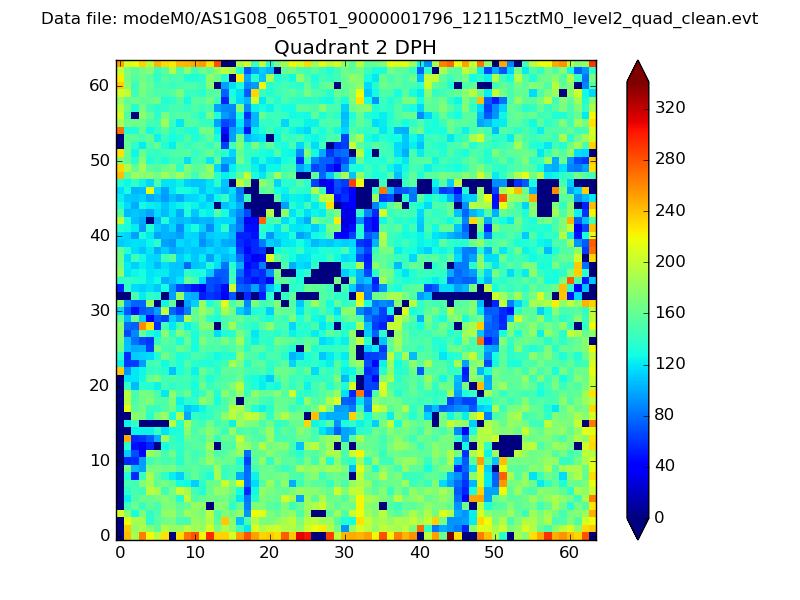 |
Quadrant C |
| Plot type | Count rate plots | Images |
|---|---|---|
| Comparison with Poisson distribution Blue bars denote a histogram of data divided into 1 sec bins. Red curve is a Poisson curve with rate = median count rate of data. |
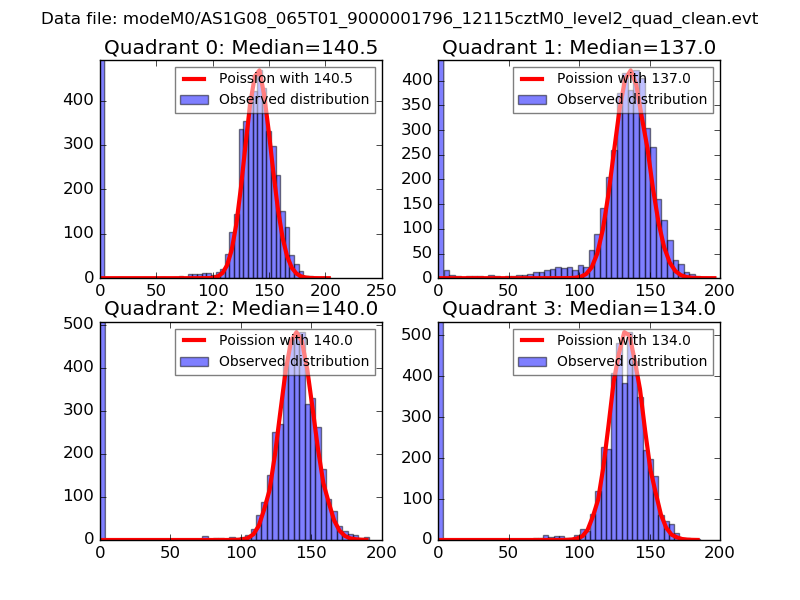 |
 |
| Quadrant-wise count rates Data is divided into 100 sec bins |
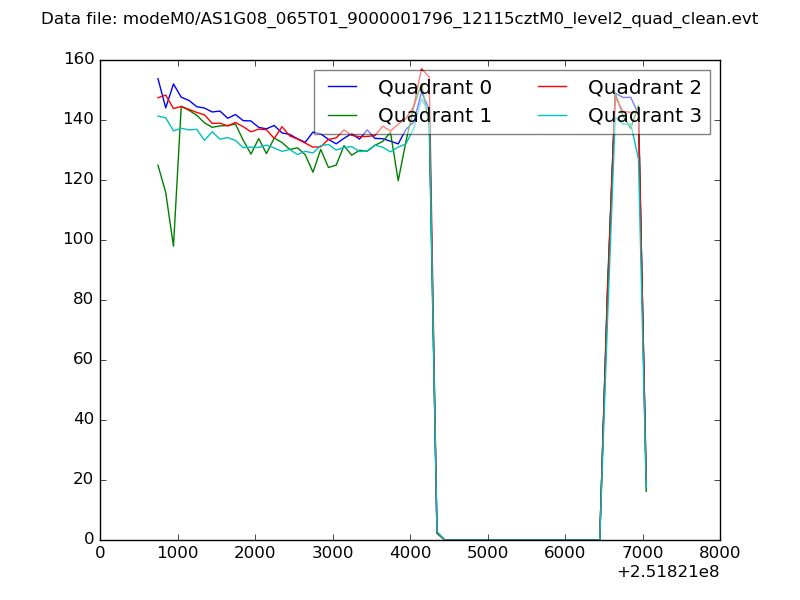 |
|
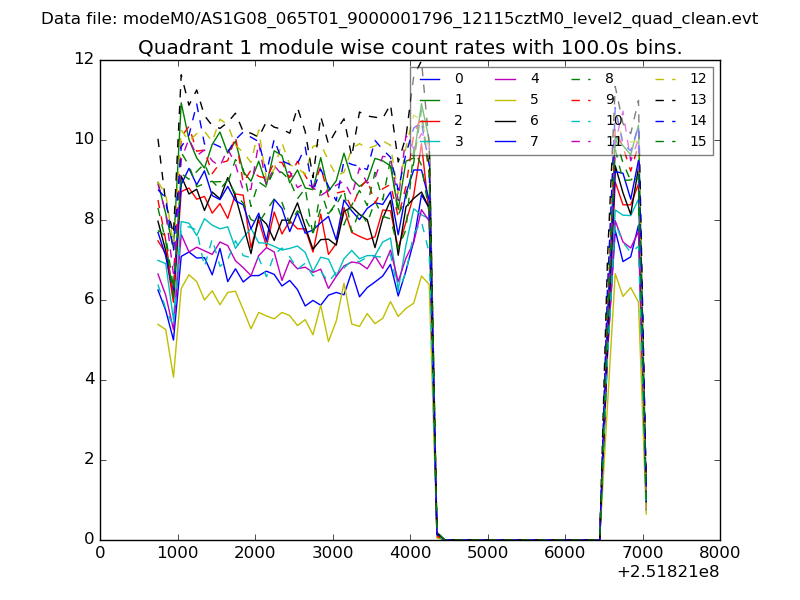
| Module-wise count rates for Quadrant A Data is divided into 100 sec bins |
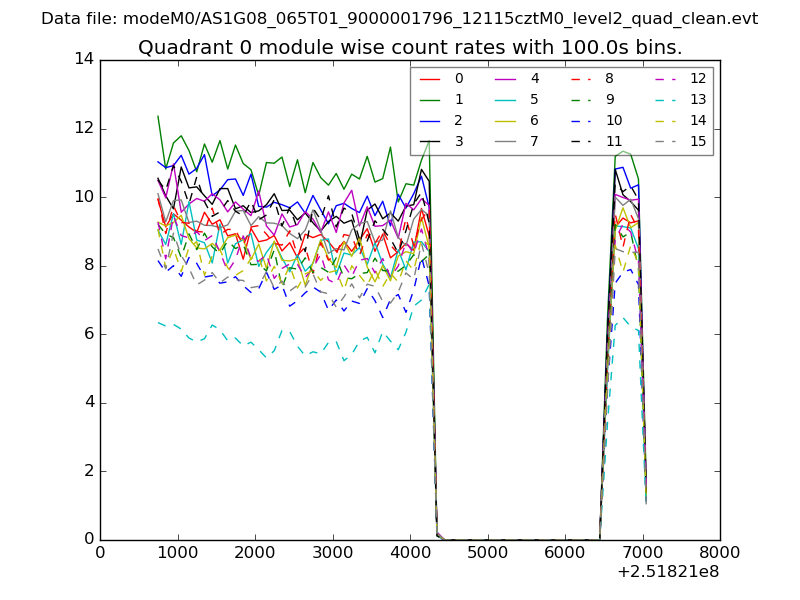 |
 |
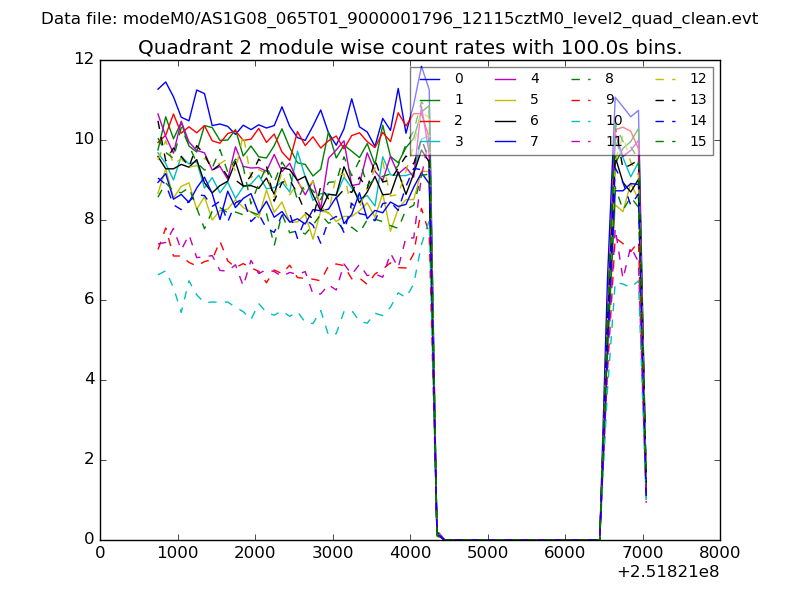
| Module-wise count rates for Quadrant B Data is divided into 100 sec bins |
 |
 |
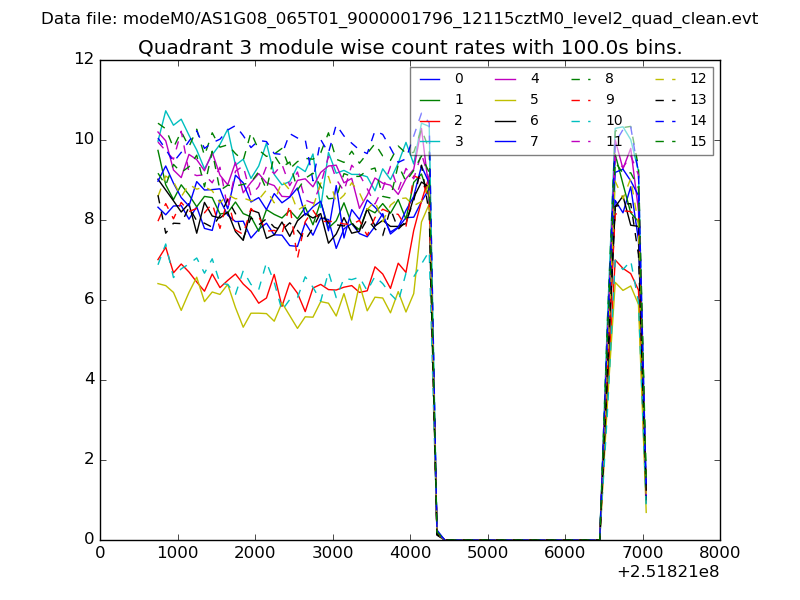
| Module-wise count rates for Quadrant C Data is divided into 100 sec bins |
 |
 |
| Module-wise count rates for Quadrant D Data is divided into 100 sec bins |
 |
 |
| Parameter | Plot |
|---|---|
| CZT HV Monitor | 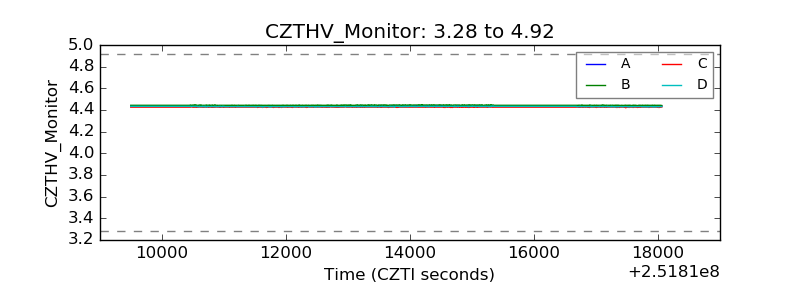 |
| D_VDD | 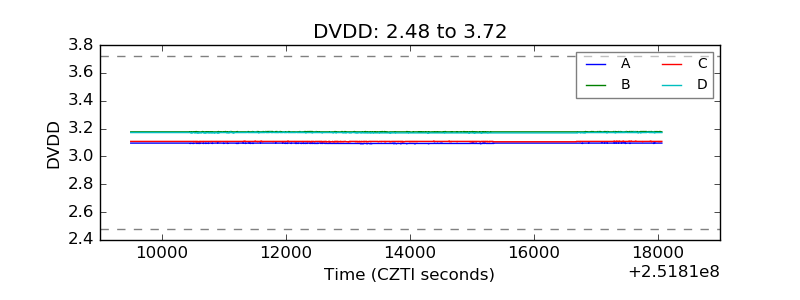 |
| Temperature 1 | 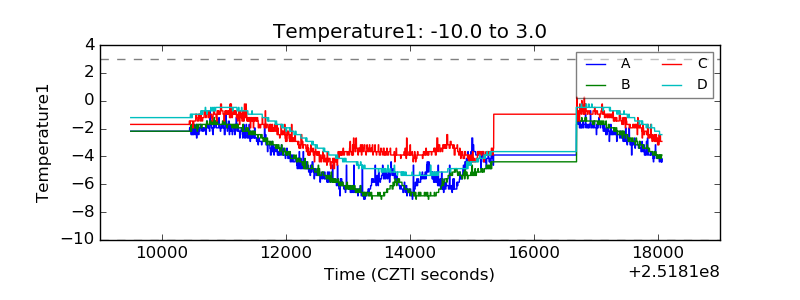 |
| Veto HV Monitor | 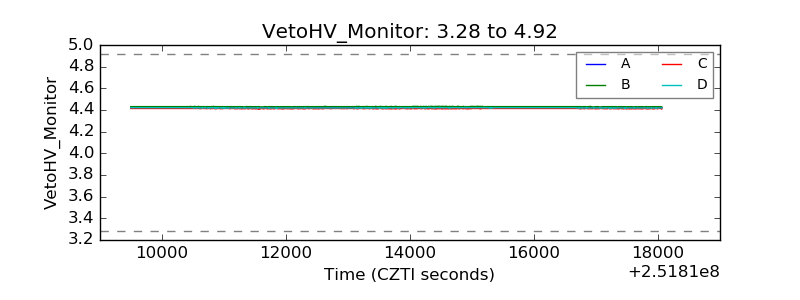 |
| Veto LLD | 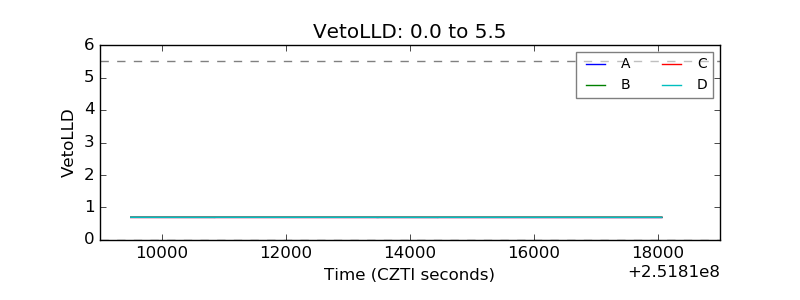 |
| Alpha Counter | 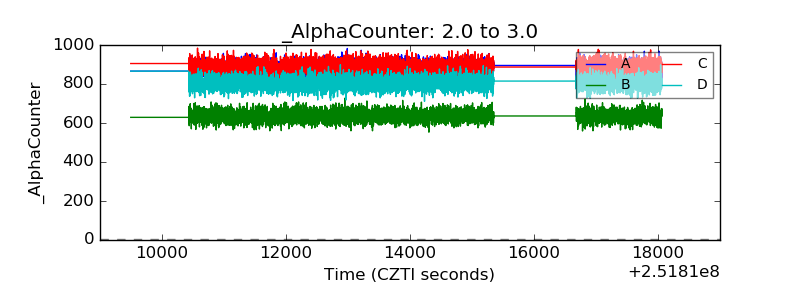 |
| _CPM_Rate | 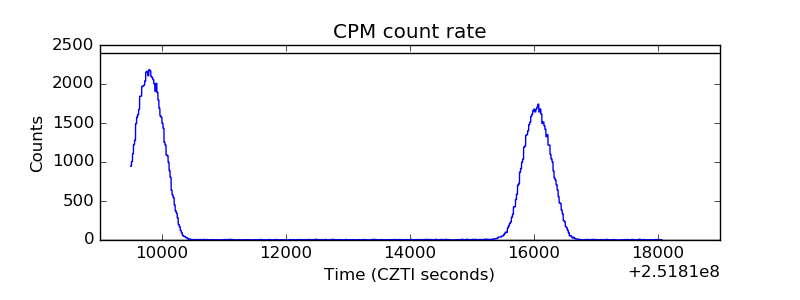 |
| CZT Counter | 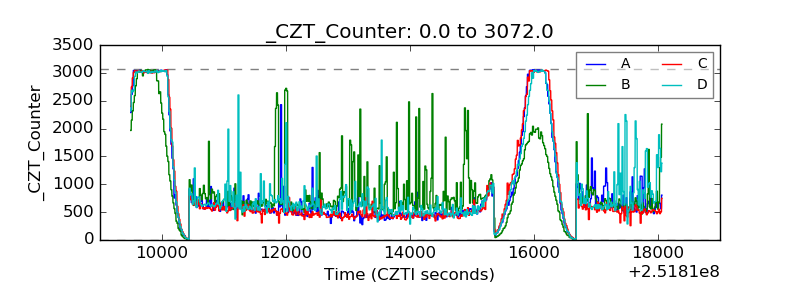 |
| +2.5 Volts monitor |  |
| +5 Volts monitor |  |
| _ROLL_ROT | 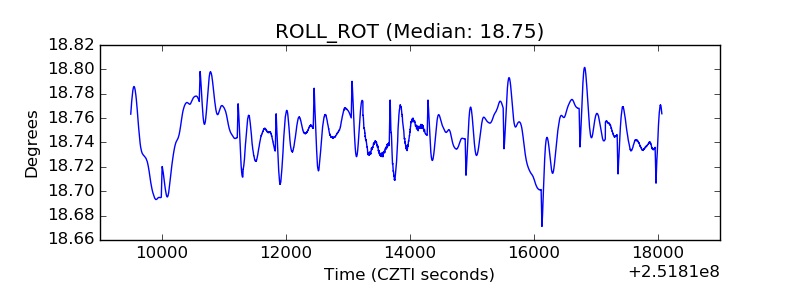 |
| _Roll_DEC | 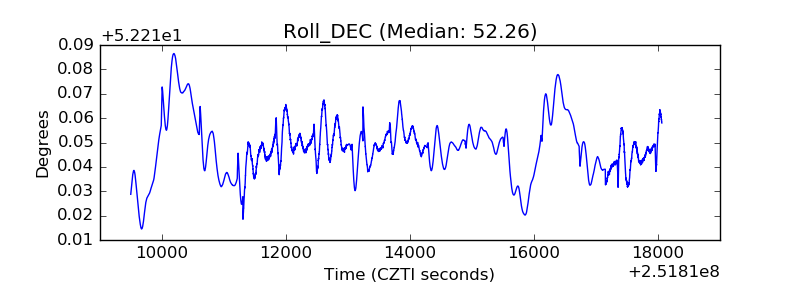 |
| _Roll_RA | 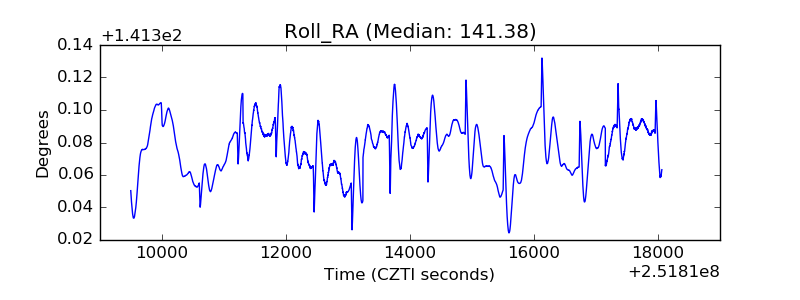 |
| Veto Counter | 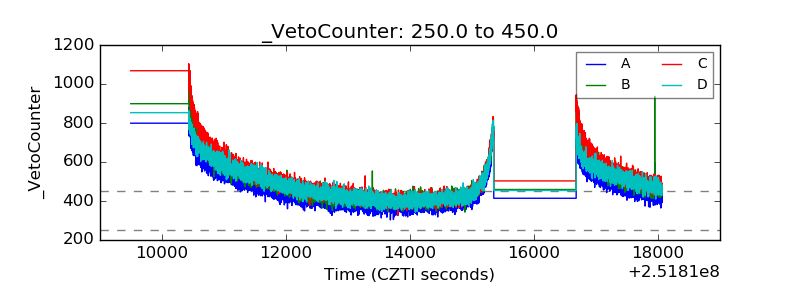 |