| Param | Original file | Final file |
|---|---|---|
| Filename | modeM0/AS1G08_065T01_9000001796_12116cztM0_level2.evt | modeM0/AS1G08_065T01_9000001796_12116cztM0_level2_quad_clean.evt |
| Size (bytes) | 545,814,720 | 99,832,320 |
| Size | 520.5 MB | 95.2 MB |
| Events in quadrant A | 3,803,371 | 654,697 |
| Events in quadrant B | 4,607,969 | 645,606 |
| Events in quadrant C | 3,238,719 | 654,803 |
| Events in quadrant D | 4,448,354 | 623,845 |
| Mode M0 | |||
|---|---|---|---|
| Quadrant | BADHDUFLAG | Total packets | Discarded packets |
| A | 0 | 15704 | 3 |
| B | 0 | 18035 | 2 |
| C | 0 | 13788 | 2 |
| D | 0 | 17515 | 2 |
| Mode M9 | |||
|---|---|---|---|
| Quadrant | BADHDUFLAG | Total packets | Discarded packets |
| A | 0 | 21 | 0 |
| B | 0 | 21 | 0 |
| C | 0 | 21 | 0 |
| D | 0 | 22 | 0 |
| Mode SS | |||
|---|---|---|---|
| Quadrant | BADHDUFLAG | Total packets | Discarded packets |
| A | 0 | 128 | 0 |
| B | 0 | 128 | 0 |
| C | 0 | 128 | 0 |
| D | 0 | 128 | 0 |
| Quadrant | Total seconds | Saturated seconds | Saturation percentage |
|---|---|---|---|
| A | 6375 | 152 | 2.384314% |
| B | 6375 | 354 | 5.552941% |
| C | 6375 | 102 | 1.600000% |
| D | 6375 | 241 | 3.780392% |
Noise dominated data is calculated using 1-second bins in cleaned event files. If a bin has >2000 counts, and if more than 50% of those come from <1% of pixels, then it is considered to be noise-dominated and hence unusable.
| Quadrant | # 1 sec bins | Bins with >0 counts | Bins with >2000 counts | High rate bins dominated by noise | Noise dominated (total time) | Noise dominated (detector-on time) | Marked lightcurve |
|---|---|---|---|---|---|---|---|
| A | 7606 | 6377 | 9 | 9 | 0.12% | 0.14% | 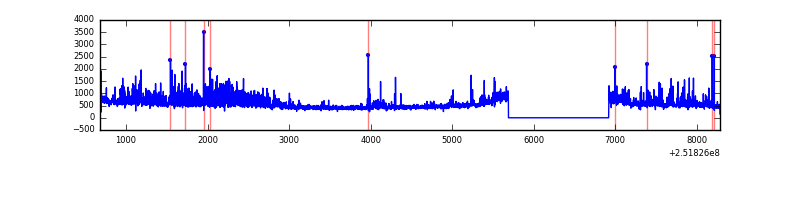 |
| B | 7606 | 6377 | 175 | 175 | 2.30% | 2.74% | 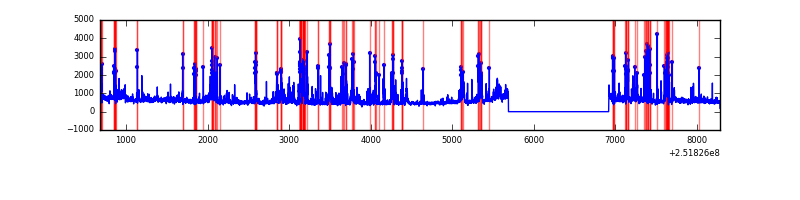 |
| C | 7606 | 6377 | 21 | 21 | 0.28% | 0.33% | 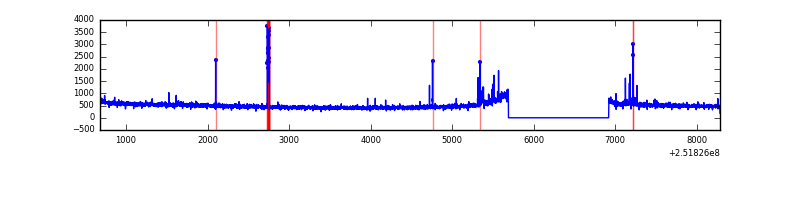 |
| D | 7606 | 6377 | 129 | 129 | 1.70% | 2.02% | 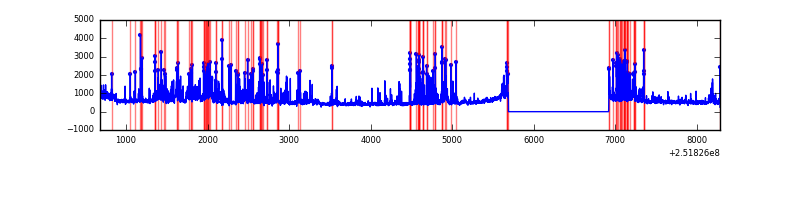 |
Top three noisy pixels from each quadrant. If the there are fewer than three noisy pixels in the level2.evt file, extra rows are filled as -1
| Pixel properties | Quadrant properties | ||||||
|---|---|---|---|---|---|---|---|
| Quadrant | DetID | PixID | Counts | Sigma | Mean | Median | Sigma |
| A | 14 | 63 | 273776 | 1682.18 | 808 | 792 | 162.3 |
| A | 1 | 162 | 160056 | 981.41 | 808 | 792 | 162.3 |
| A | 1 | 178 | 84006 | 512.78 | 808 | 792 | 162.3 |
| B | 4 | 239 | 1103981 | 7397.25 | 798 | 779 | 149.1 |
| B | 15 | 204 | 161671 | 1078.82 | 798 | 779 | 149.1 |
| B | 11 | 51 | 82089 | 545.2 | 798 | 779 | 149.1 |
| C | 15 | 208 | 125833 | 684.17 | 796 | 801 | 182.8 |
| C | 14 | 234 | 8692 | 43.18 | 796 | 801 | 182.8 |
| C | 13 | 61 | 6005 | 28.48 | 796 | 801 | 182.8 |
| D | 4 | 95 | 797394 | 4294.28 | 784 | 762 | 185.5 |
| D | 1 | 52 | 282229 | 1517.26 | 784 | 762 | 185.5 |
| D | 14 | 34 | 111152 | 595.06 | 784 | 762 | 185.5 |
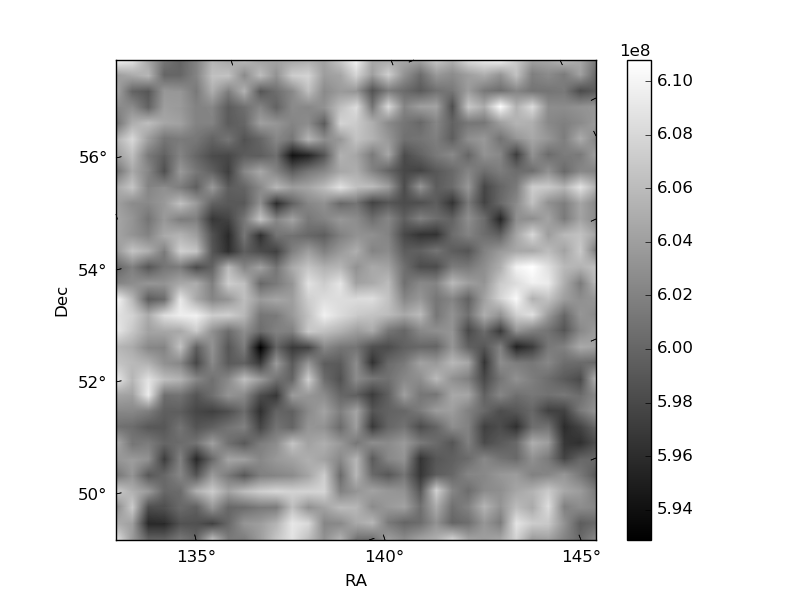
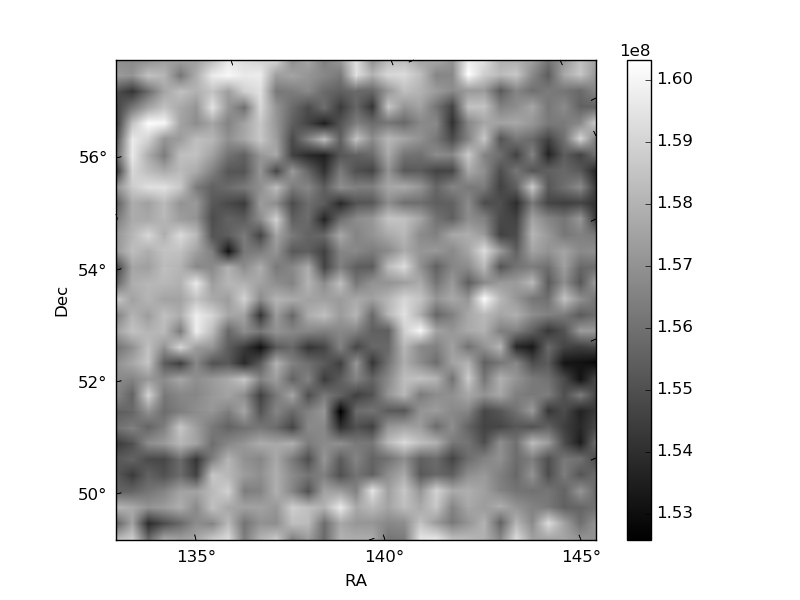
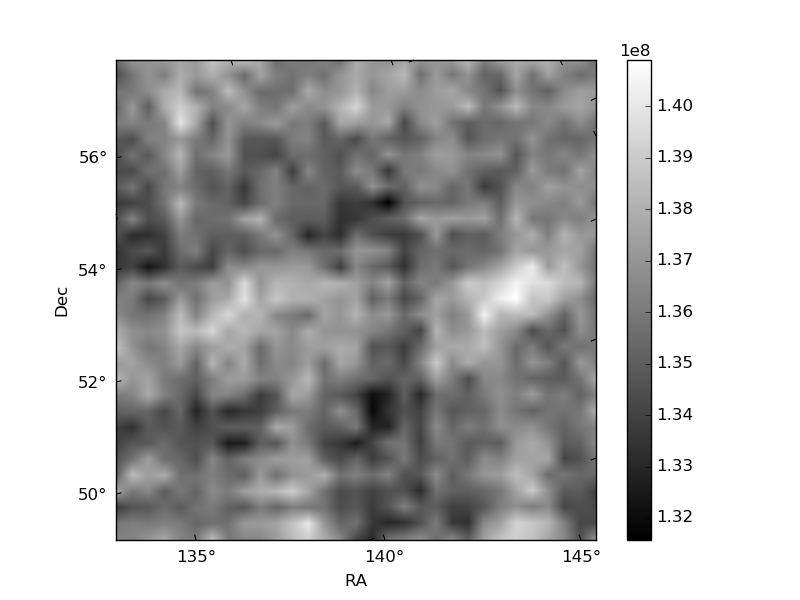
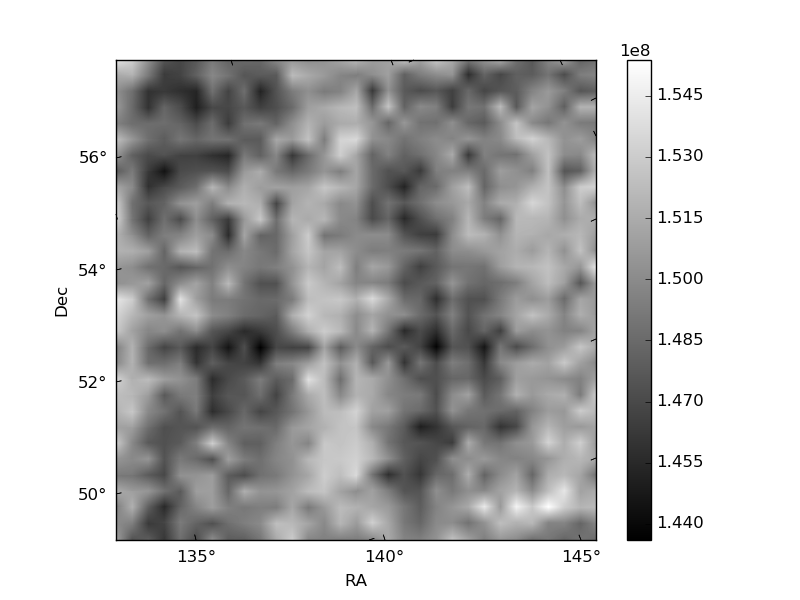
Histogram calculated using DETX and DETY for each event in the final _common_clean file
| Quadrant A | 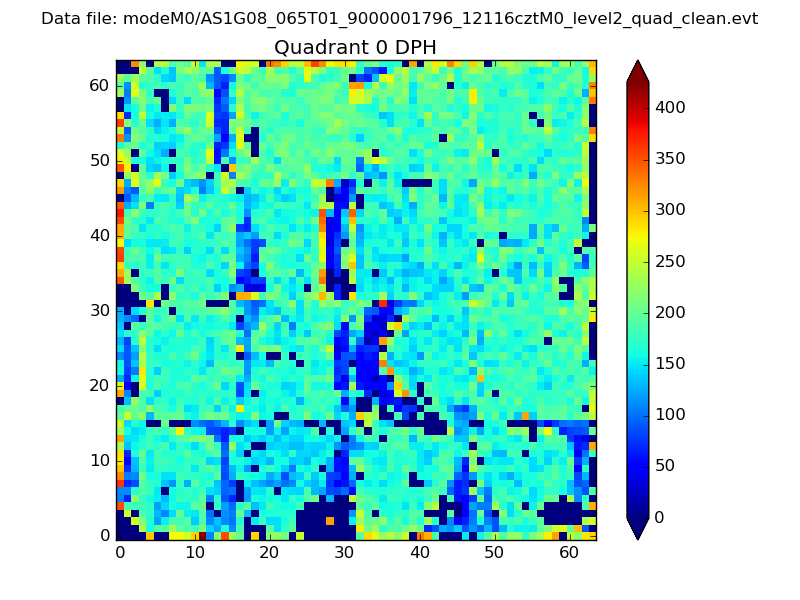 |
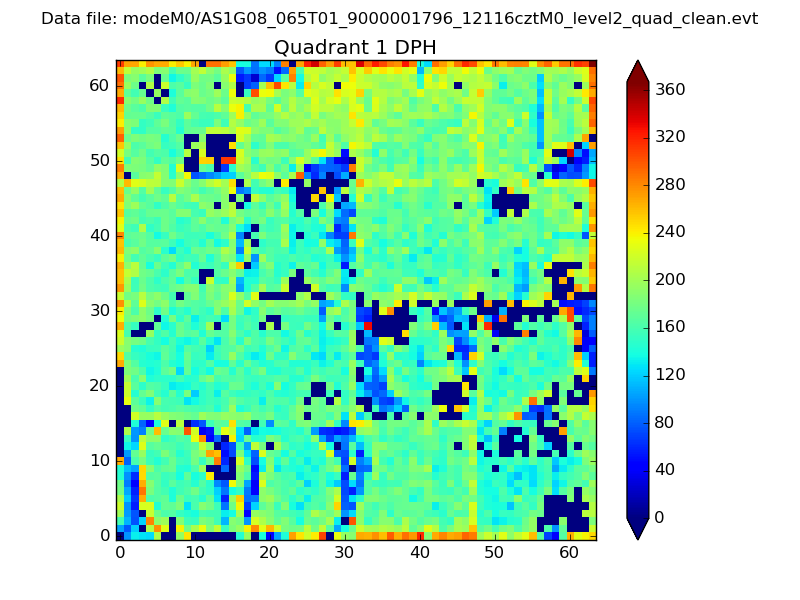 |
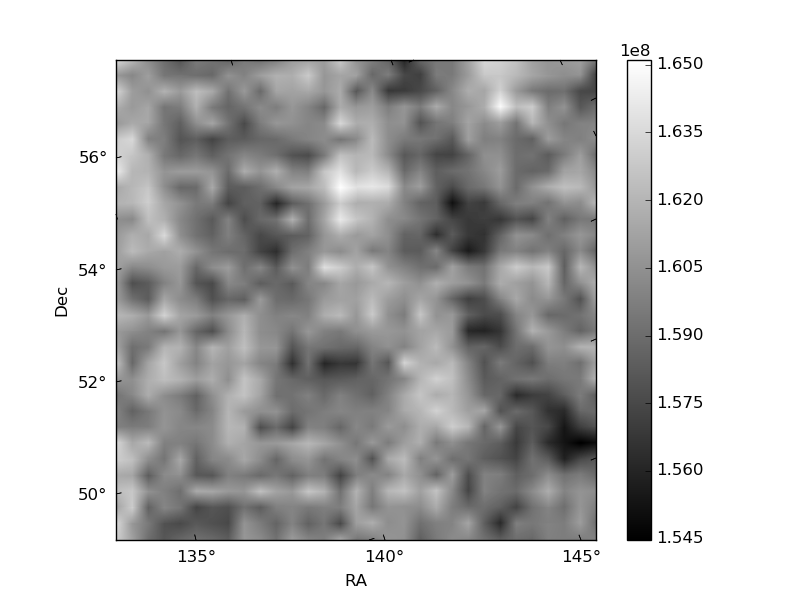
Quadrant B |
|---|---|---|---|
| Quadrant D | 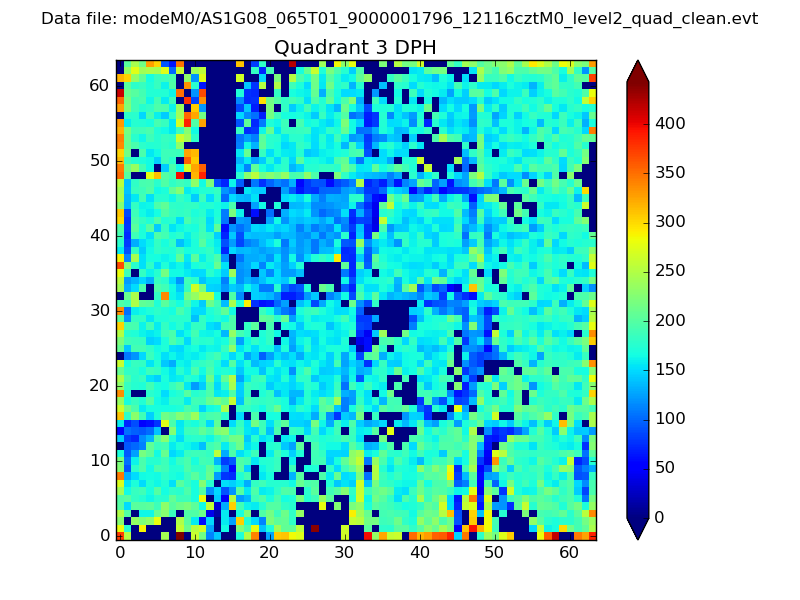 |
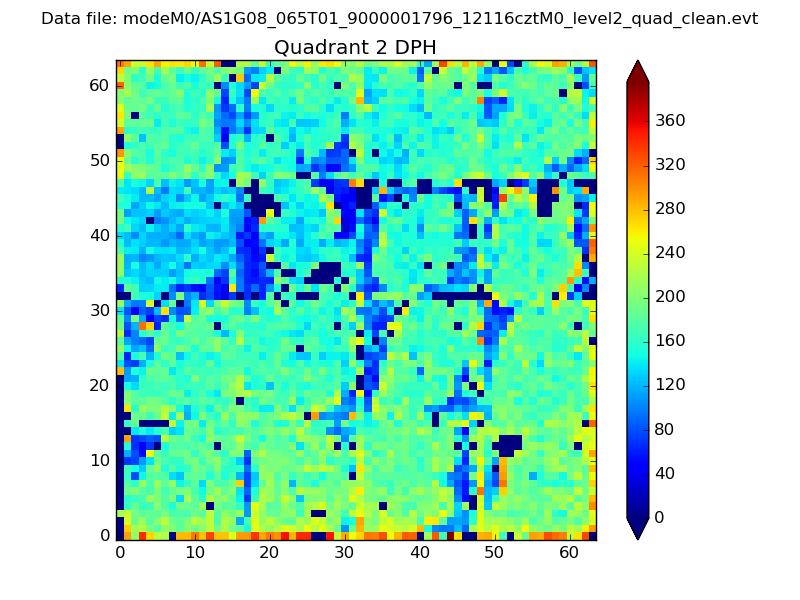 |
Quadrant C |
| Plot type | Count rate plots | Images |
|---|---|---|
| Comparison with Poisson distribution Blue bars denote a histogram of data divided into 1 sec bins. Red curve is a Poisson curve with rate = median count rate of data. |
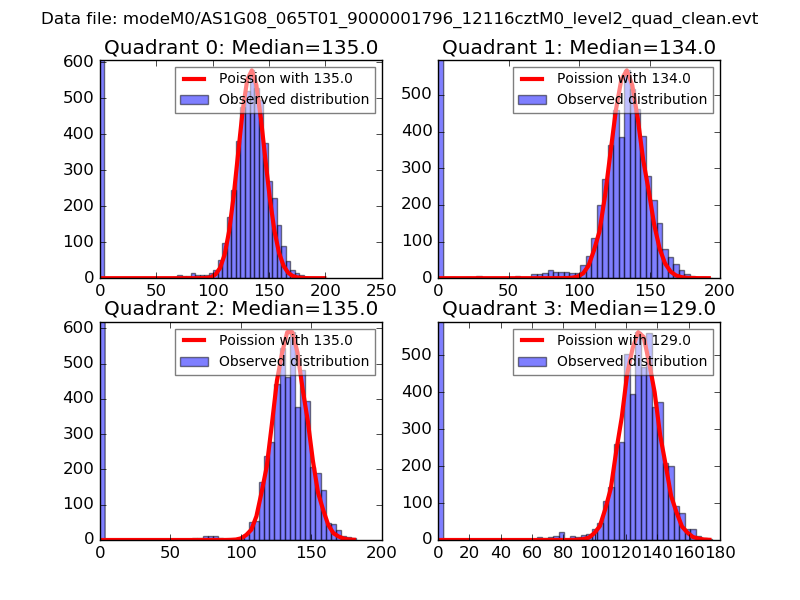 |
 |
| Quadrant-wise count rates Data is divided into 100 sec bins |
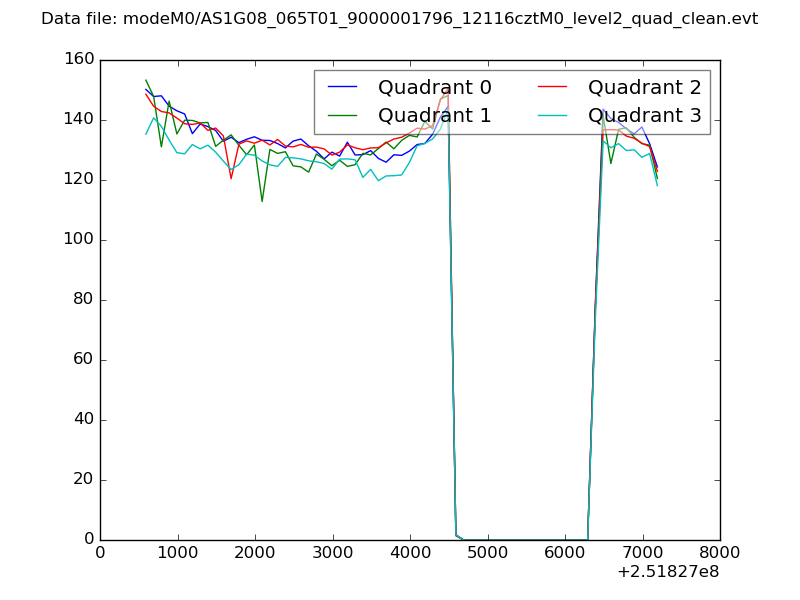 |
|
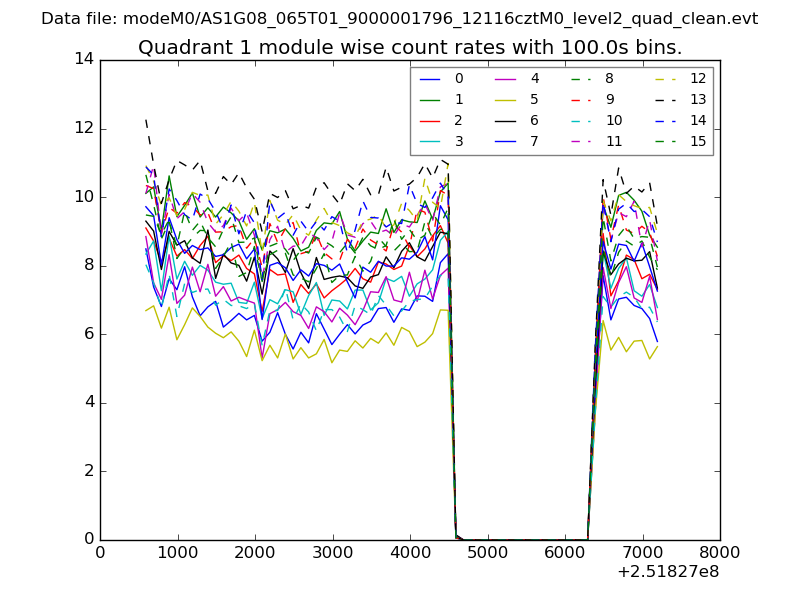
| Module-wise count rates for Quadrant A Data is divided into 100 sec bins |
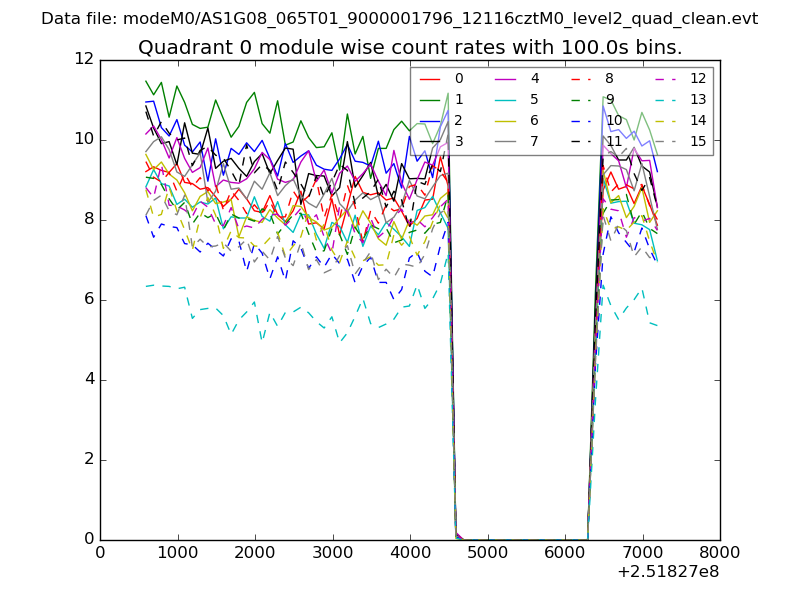 |
 |
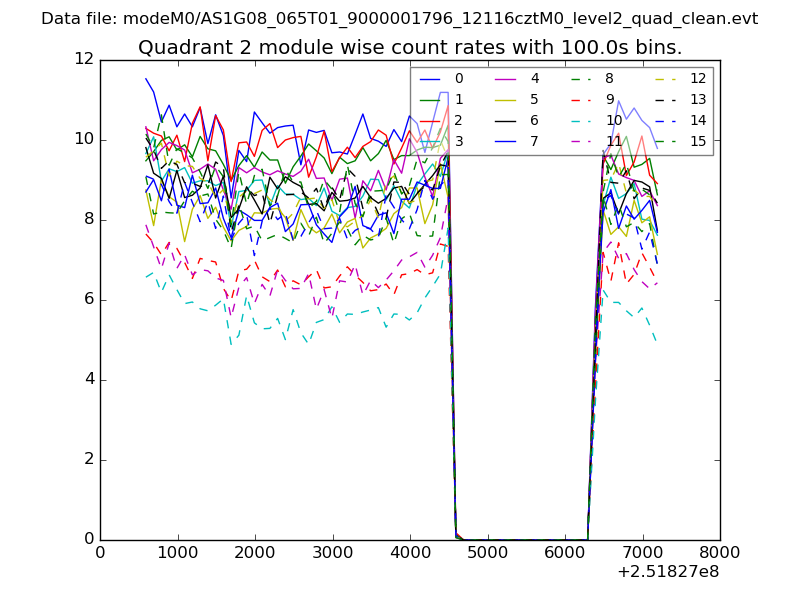
| Module-wise count rates for Quadrant B Data is divided into 100 sec bins |
 |
 |
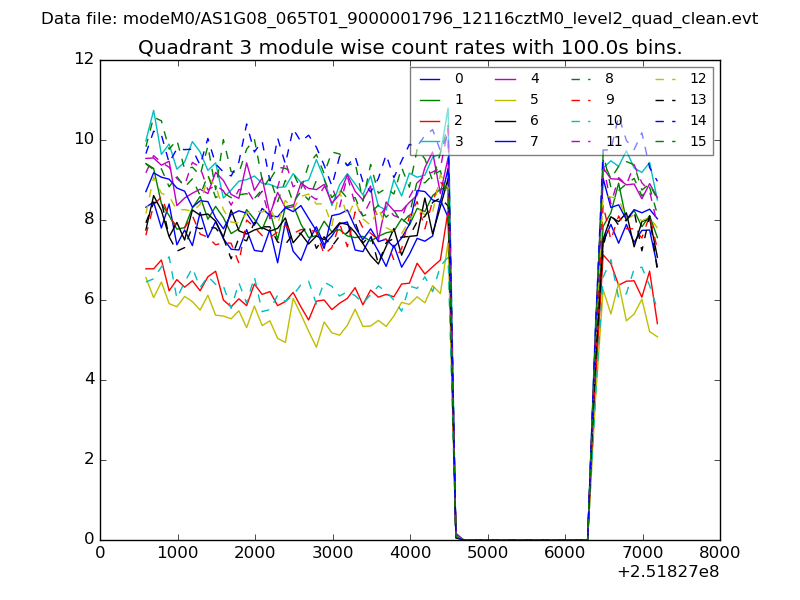
| Module-wise count rates for Quadrant C Data is divided into 100 sec bins |
 |
 |
| Module-wise count rates for Quadrant D Data is divided into 100 sec bins |
 |
 |
| Parameter | Plot |
|---|---|
| CZT HV Monitor | 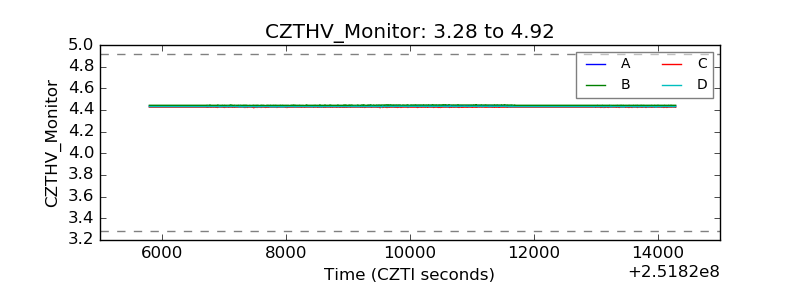 |
| D_VDD | 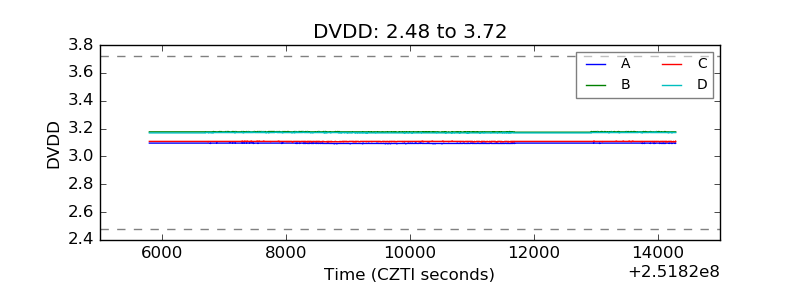 |
| Temperature 1 | 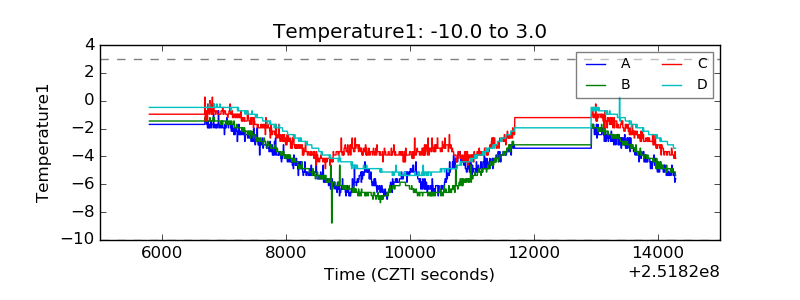 |
| Veto HV Monitor | 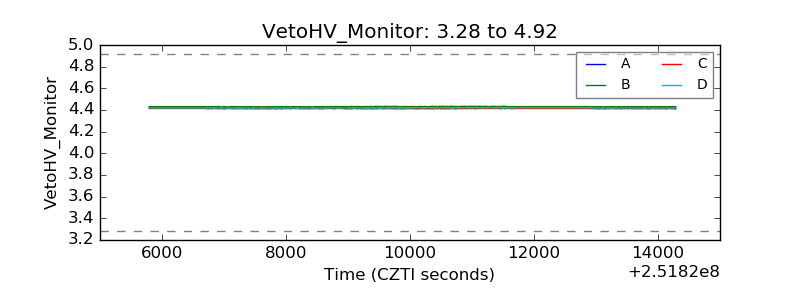 |
| Veto LLD | 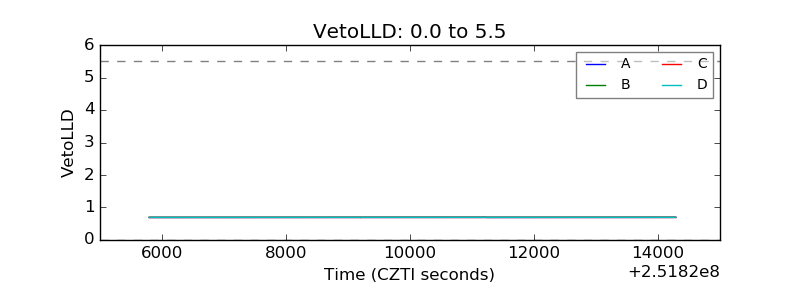 |
| Alpha Counter | 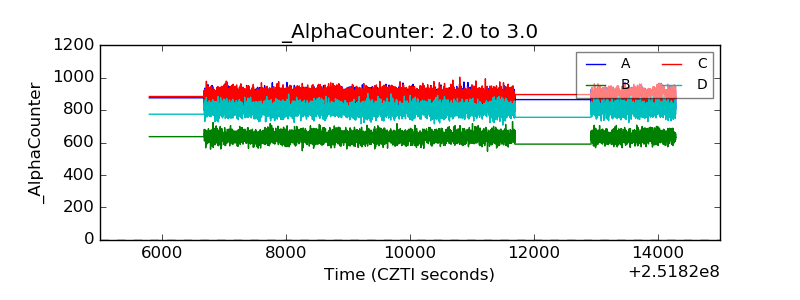 |
| _CPM_Rate | 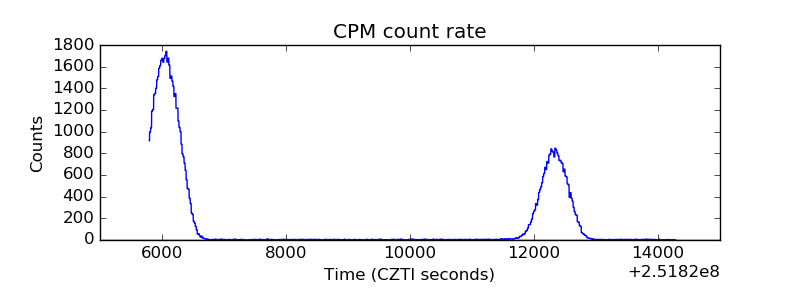 |
| CZT Counter | 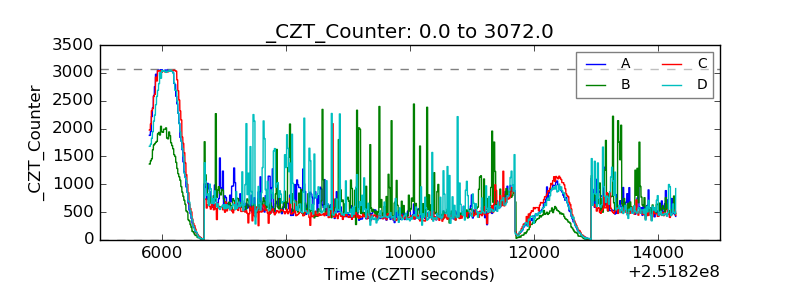 |
| +2.5 Volts monitor | 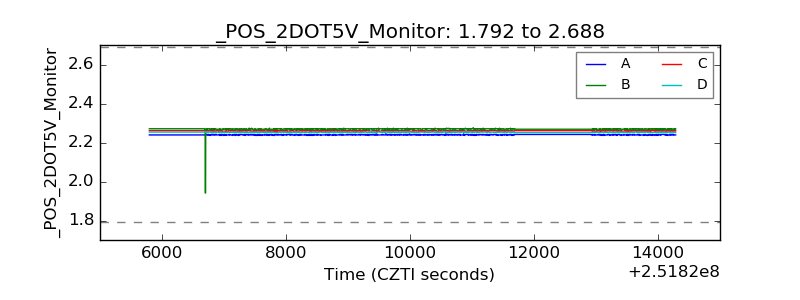 |
| +5 Volts monitor |  |
| _ROLL_ROT | 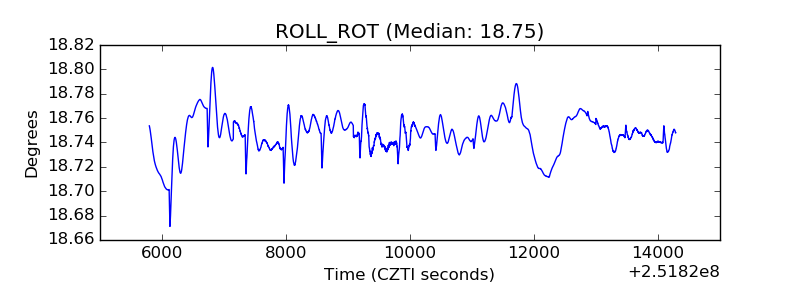 |
| _Roll_DEC | 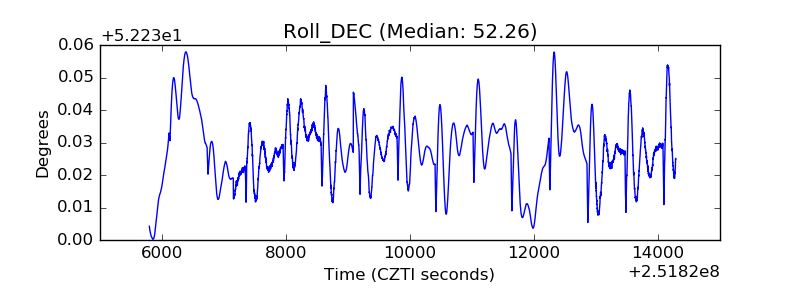 |
| _Roll_RA | 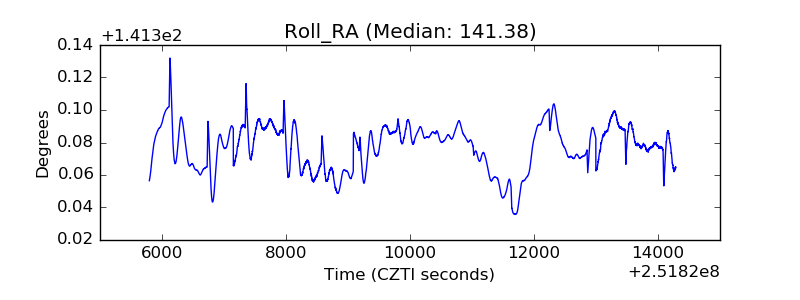 |
| Veto Counter |  |