| Param | Original file | Final file |
|---|---|---|
| Filename | modeM0/AS1G08_065T01_9000001796_12118cztM0_level2.evt | modeM0/AS1G08_065T01_9000001796_12118cztM0_level2_quad_clean.evt |
| Size (bytes) | 650,617,920 | 106,698,240 |
| Size | 620.5 MB | 101.8 MB |
| Events in quadrant A | 4,059,236 | 692,189 |
| Events in quadrant B | 5,814,799 | 659,123 |
| Events in quadrant C | 3,673,530 | 685,266 |
| Events in quadrant D | 5,627,602 | 651,329 |
| Mode M0 | |||
|---|---|---|---|
| Quadrant | BADHDUFLAG | Total packets | Discarded packets |
| A | 0 | 17413 | 3 |
| B | 0 | 22641 | 2 |
| C | 0 | 16399 | 2 |
| D | 0 | 22070 | 2 |
| Mode M9 | |||
|---|---|---|---|
| Quadrant | BADHDUFLAG | Total packets | Discarded packets |
| A | 0 | 15 | 0 |
| B | 0 | 15 | 0 |
| C | 0 | 15 | 0 |
| D | 0 | 15 | 0 |
| Mode SS | |||
|---|---|---|---|
| Quadrant | BADHDUFLAG | Total packets | Discarded packets |
| A | 0 | 160 | 0 |
| B | 0 | 160 | 0 |
| C | 0 | 160 | 0 |
| D | 0 | 160 | 0 |
| Quadrant | Total seconds | Saturated seconds | Saturation percentage |
|---|---|---|---|
| A | 7813 | 126 | 1.612697% |
| B | 7813 | 645 | 8.255472% |
| C | 7813 | 52 | 0.665557% |
| D | 7813 | 167 | 2.137463% |
Noise dominated data is calculated using 1-second bins in cleaned event files. If a bin has >2000 counts, and if more than 50% of those come from <1% of pixels, then it is considered to be noise-dominated and hence unusable.
| Quadrant | # 1 sec bins | Bins with >0 counts | Bins with >2000 counts | High rate bins dominated by noise | Noise dominated (total time) | Noise dominated (detector-on time) | Marked lightcurve |
|---|---|---|---|---|---|---|---|
| A | 9219 | 7816 | 13 | 13 | 0.14% | 0.17% | 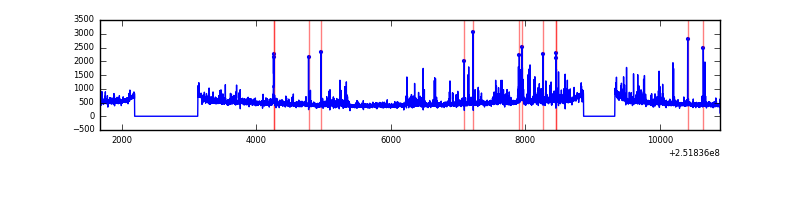 |
| B | 9219 | 7816 | 343 | 343 | 3.72% | 4.39% | 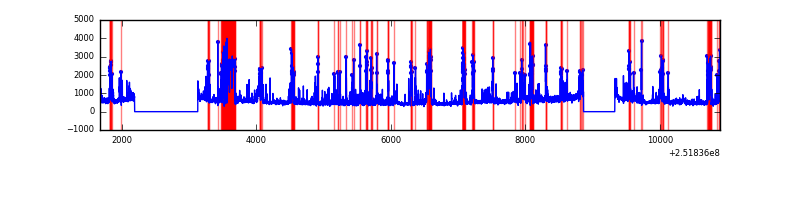 |
| C | 9219 | 7816 | 8 | 8 | 0.09% | 0.10% | 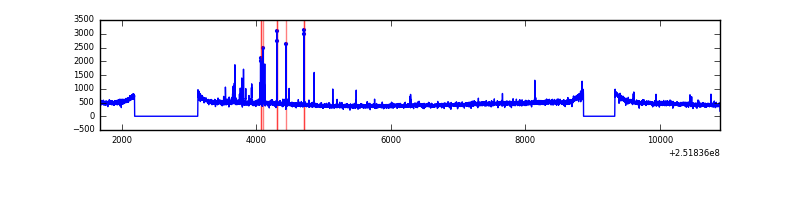 |
| D | 9219 | 7816 | 50 | 50 | 0.54% | 0.64% | 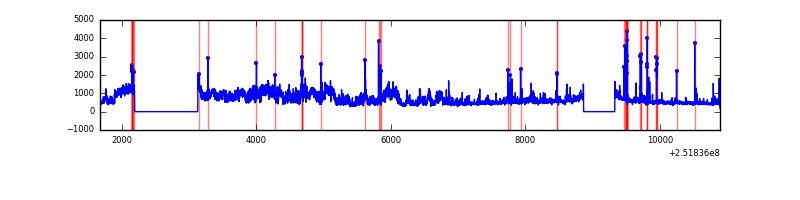 |
Top three noisy pixels from each quadrant. If the there are fewer than three noisy pixels in the level2.evt file, extra rows are filled as -1
| Pixel properties | Quadrant properties | ||||||
|---|---|---|---|---|---|---|---|
| Quadrant | DetID | PixID | Counts | Sigma | Mean | Median | Sigma |
| A | 1 | 162 | 144756 | 748.97 | 943 | 926 | 192.0 |
| A | 13 | 248 | 66276 | 340.3 | 943 | 926 | 192.0 |
| A | 1 | 178 | 66238 | 340.1 | 943 | 926 | 192.0 |
| B | 4 | 239 | 1687972 | 9801.11 | 911 | 888 | 172.1 |
| B | 15 | 204 | 217738 | 1259.79 | 911 | 888 | 172.1 |
| B | 11 | 51 | 101146 | 582.45 | 911 | 888 | 172.1 |
| C | 15 | 208 | 69417 | 321.19 | 921 | 925 | 213.2 |
| C | 14 | 234 | 12489 | 54.23 | 921 | 925 | 213.2 |
| C | 13 | 61 | 6707 | 27.11 | 921 | 925 | 213.2 |
| D | 1 | 52 | 1686950 | 7685.05 | 909 | 883 | 219.4 |
| D | 8 | 195 | 131566 | 595.65 | 909 | 883 | 219.4 |
| D | 14 | 34 | 126437 | 572.27 | 909 | 883 | 219.4 |
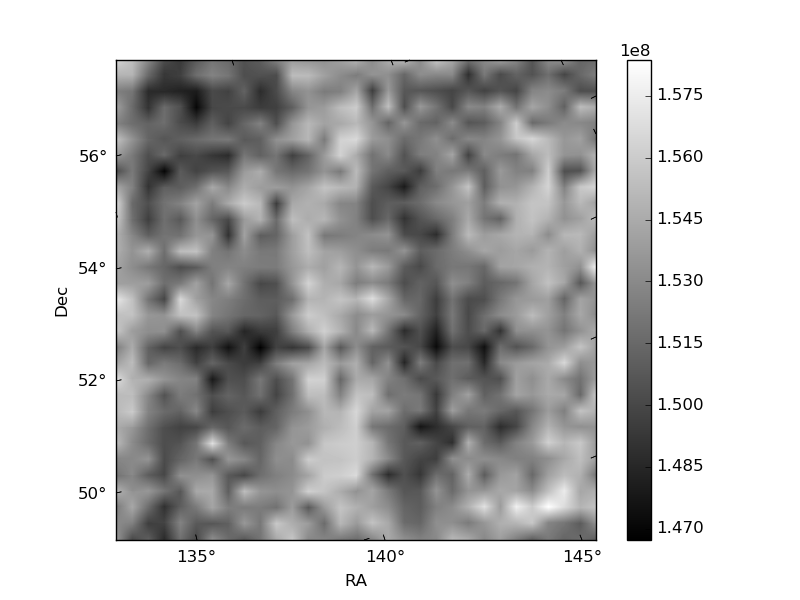
Histogram calculated using DETX and DETY for each event in the final _common_clean file
| Quadrant A | 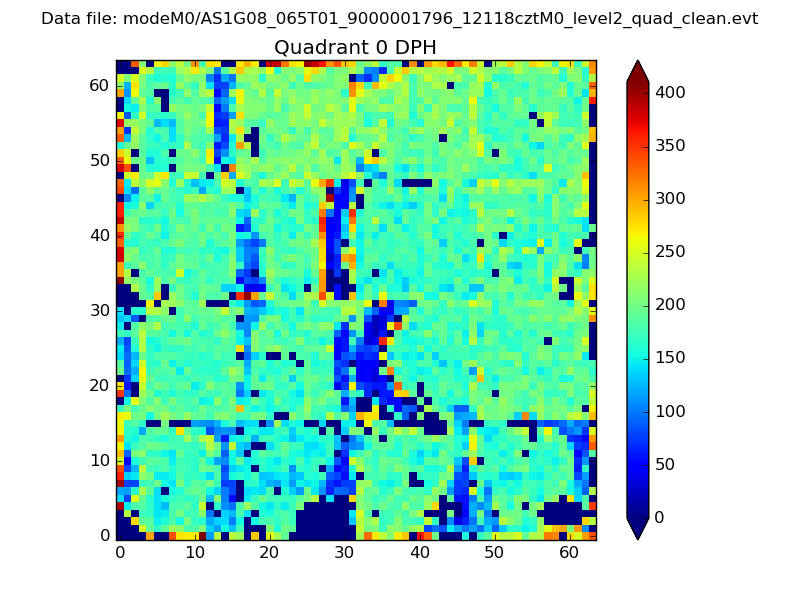 |
 |
Quadrant B |
|---|---|---|---|
| Quadrant D | 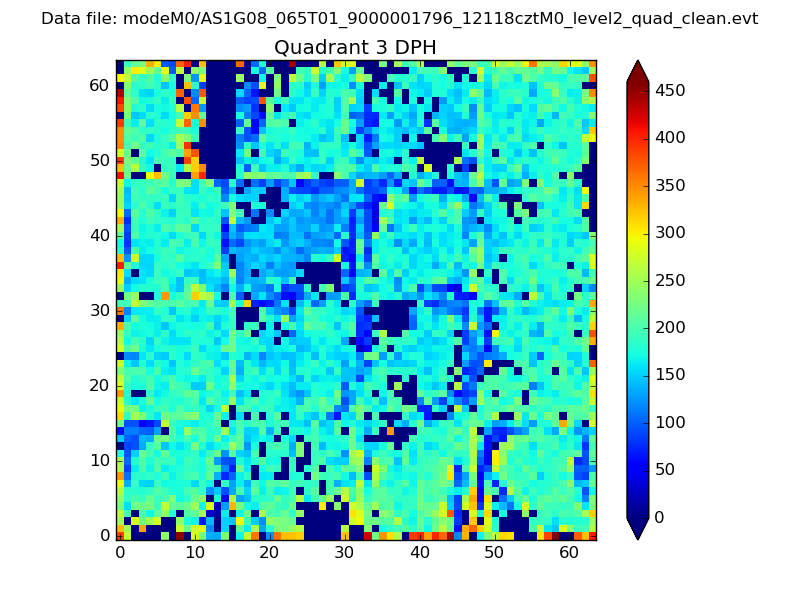 |
 |
Quadrant C |
| Plot type | Count rate plots | Images |
|---|---|---|
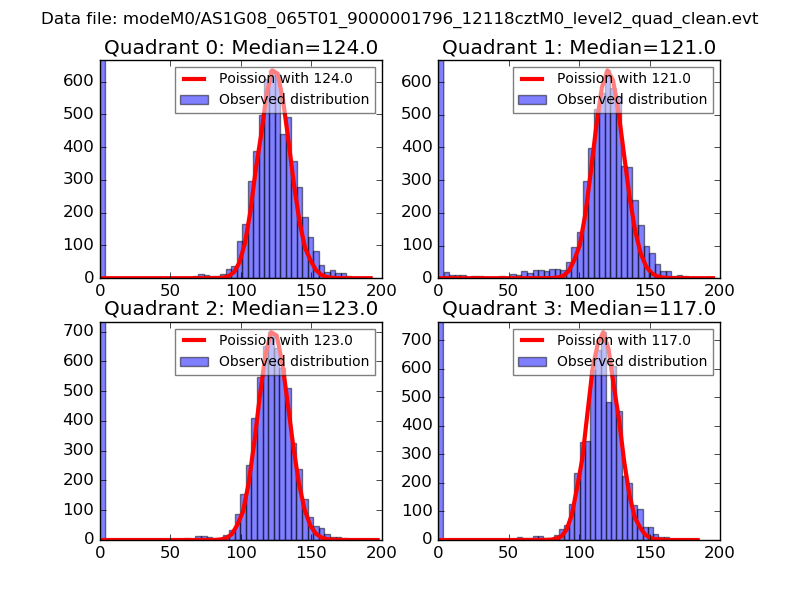
| Comparison with Poisson distribution Blue bars denote a histogram of data divided into 1 sec bins. Red curve is a Poisson curve with rate = median count rate of data. |
 |
 |
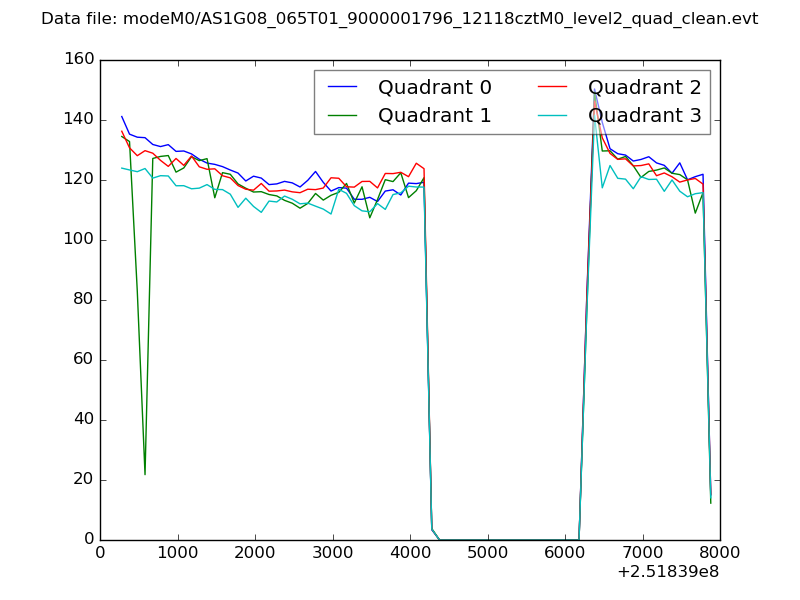
| Quadrant-wise count rates Data is divided into 100 sec bins |
 |
|
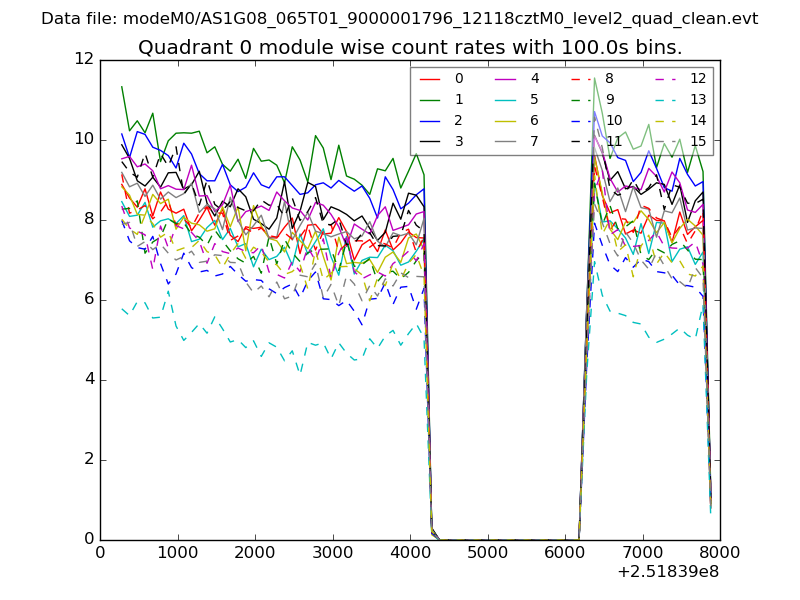
| Module-wise count rates for Quadrant A Data is divided into 100 sec bins |
 |
 |
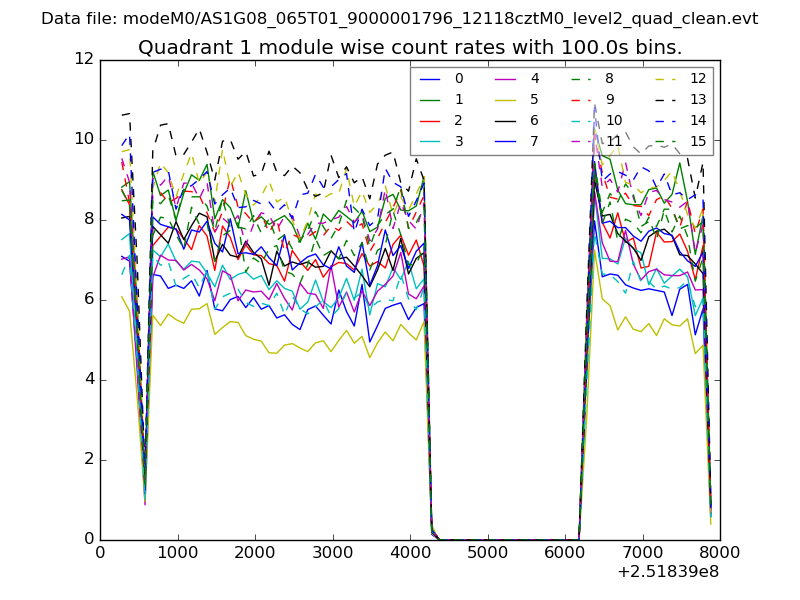
| Module-wise count rates for Quadrant B Data is divided into 100 sec bins |
 |
 |
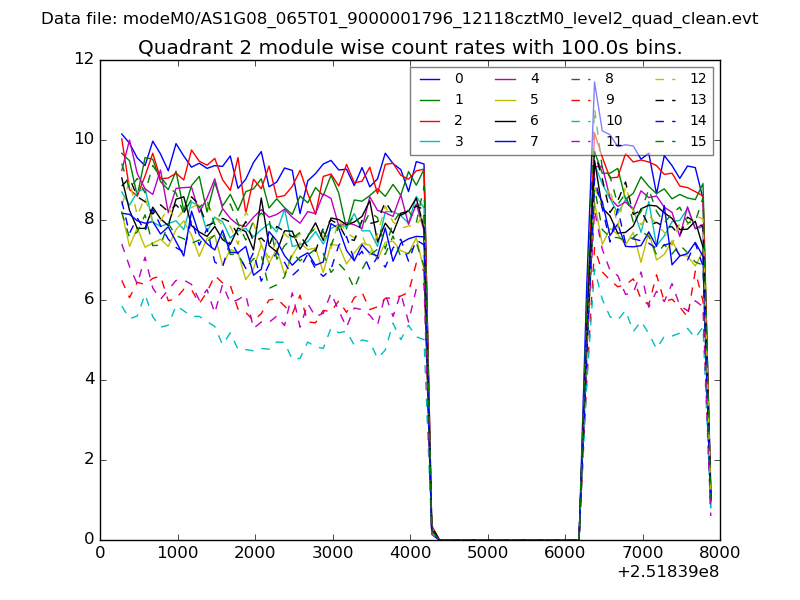
| Module-wise count rates for Quadrant C Data is divided into 100 sec bins |
 |
 |
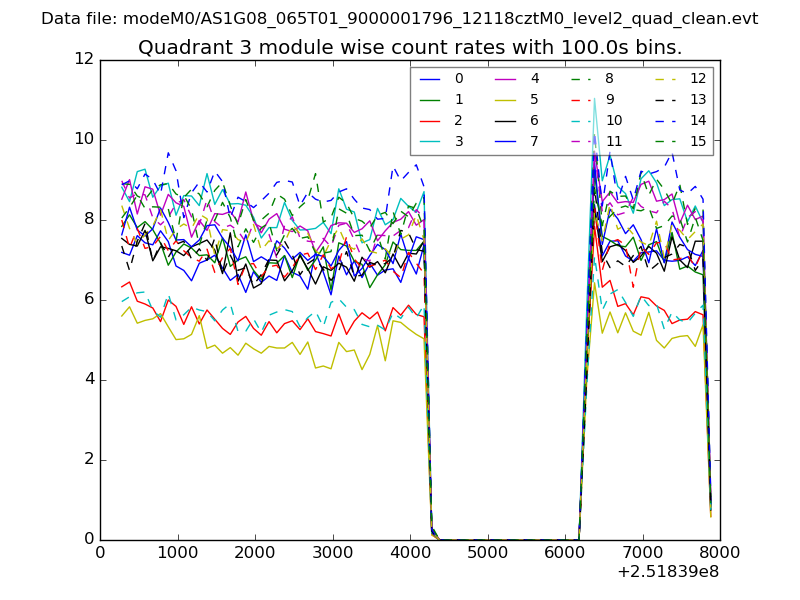
| Module-wise count rates for Quadrant D Data is divided into 100 sec bins |
 |
 |
| Parameter | Plot |
|---|---|
| CZT HV Monitor | 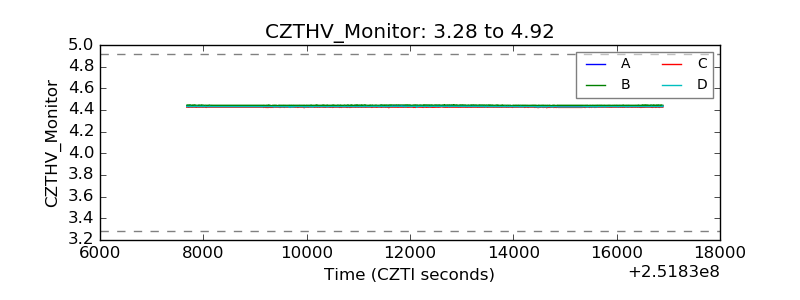 |
| D_VDD | 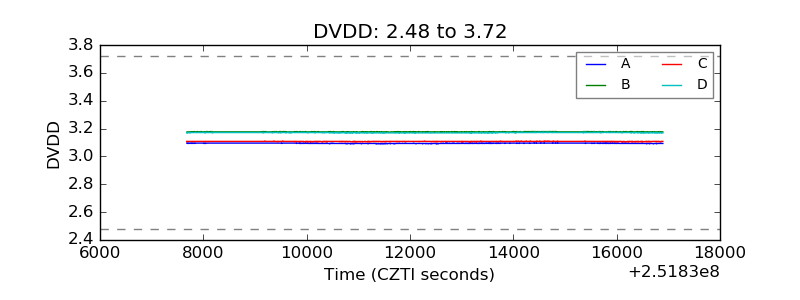 |
| Temperature 1 | 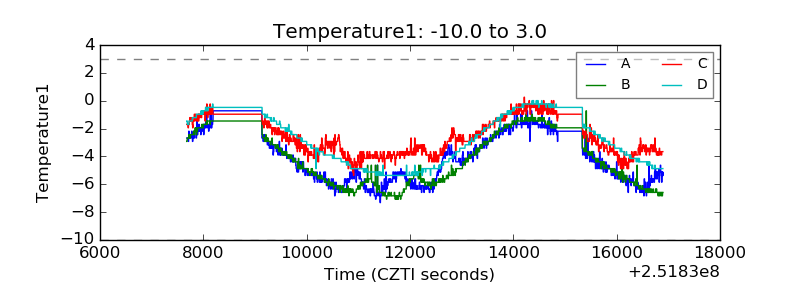 |
| Veto HV Monitor | 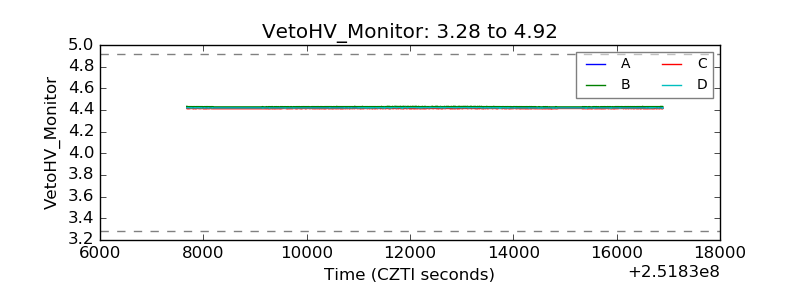 |
| Veto LLD | 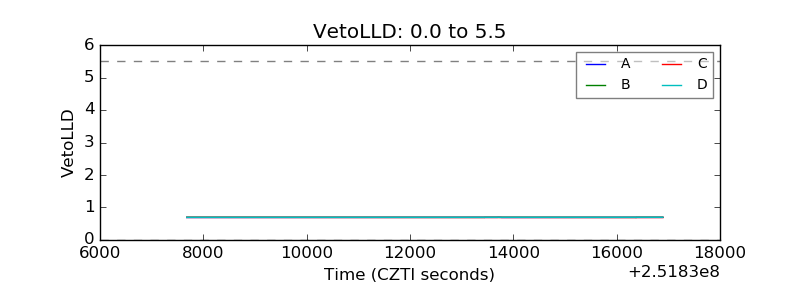 |
| Alpha Counter |  |
| _CPM_Rate |  |
| CZT Counter | 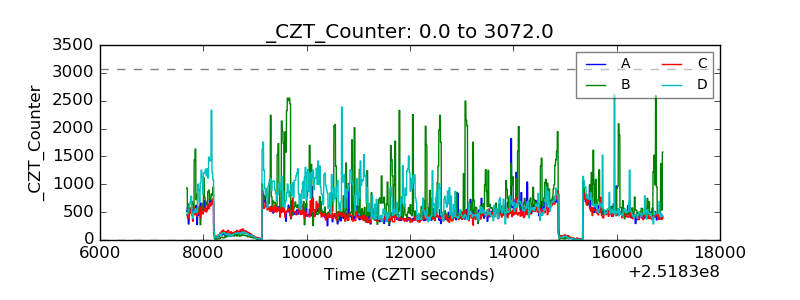 |
| +2.5 Volts monitor |  |
| +5 Volts monitor |  |
| _ROLL_ROT | 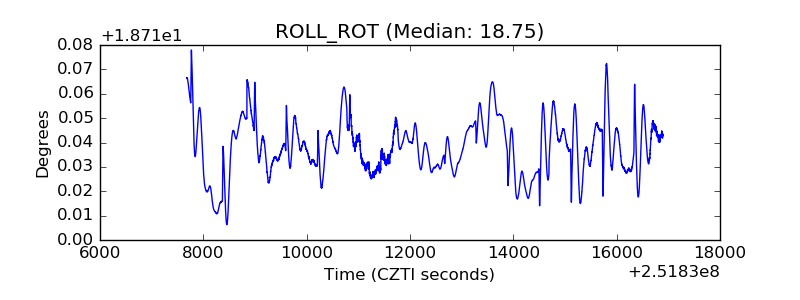 |
| _Roll_DEC | 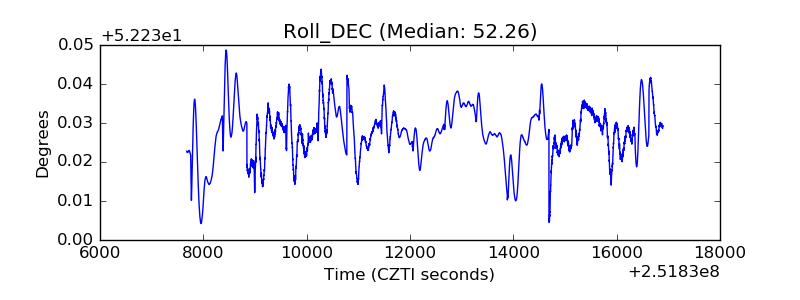 |
| _Roll_RA | 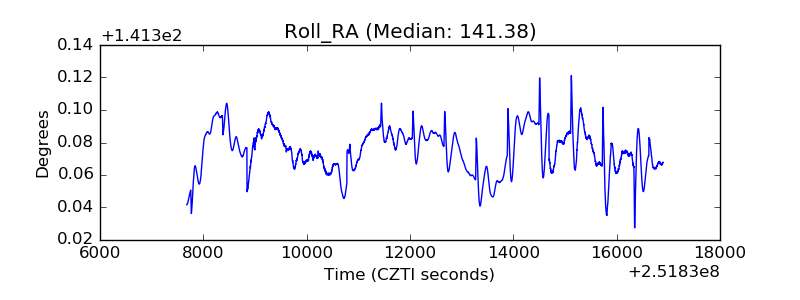 |
| Veto Counter | 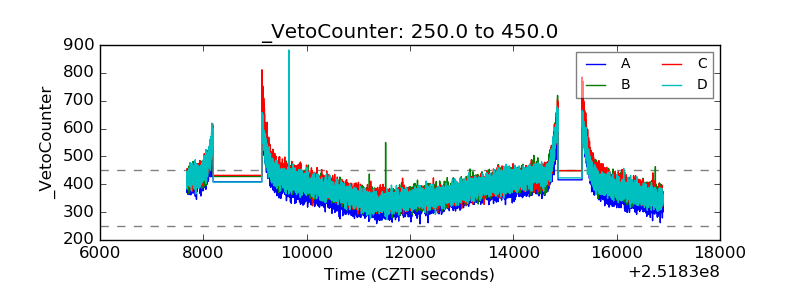 |