| Param | Original file | Final file |
|---|---|---|
| Filename | modeM0/AS1G08_065T01_9000001796_12120cztM0_level2.evt | modeM0/AS1G08_065T01_9000001796_12120cztM0_level2_quad_clean.evt |
| Size (bytes) | 655,283,520 | 122,932,800 |
| Size | 624.9 MB | 117.2 MB |
| Events in quadrant A | 4,445,504 | 798,605 |
| Events in quadrant B | 5,781,895 | 784,174 |
| Events in quadrant C | 3,975,887 | 792,528 |
| Events in quadrant D | 5,067,713 | 758,905 |
| Mode M0 | |||
|---|---|---|---|
| Quadrant | BADHDUFLAG | Total packets | Discarded packets |
| A | 0 | 19141 | 3 |
| B | 0 | 22982 | 2 |
| C | 0 | 17878 | 2 |
| D | 0 | 20753 | 2 |
| Mode M9 | |||
|---|---|---|---|
| Quadrant | BADHDUFLAG | Total packets | Discarded packets |
| A | 0 | 4 | 0 |
| B | 0 | 4 | 0 |
| C | 0 | 4 | 0 |
| D | 0 | 4 | 0 |
| Mode SS | |||
|---|---|---|---|
| Quadrant | BADHDUFLAG | Total packets | Discarded packets |
| A | 0 | 172 | 0 |
| B | 0 | 172 | 0 |
| C | 0 | 172 | 0 |
| D | 0 | 172 | 0 |
| Quadrant | Total seconds | Saturated seconds | Saturation percentage |
|---|---|---|---|
| A | 8482 | 232 | 2.735204% |
| B | 8482 | 496 | 5.847677% |
| C | 8482 | 81 | 0.954963% |
| D | 8482 | 173 | 2.039613% |
Noise dominated data is calculated using 1-second bins in cleaned event files. If a bin has >2000 counts, and if more than 50% of those come from <1% of pixels, then it is considered to be noise-dominated and hence unusable.
| Quadrant | # 1 sec bins | Bins with >0 counts | Bins with >2000 counts | High rate bins dominated by noise | Noise dominated (total time) | Noise dominated (detector-on time) | Marked lightcurve |
|---|---|---|---|---|---|---|---|
| A | 8758 | 8485 | 52 | 52 | 0.59% | 0.61% | 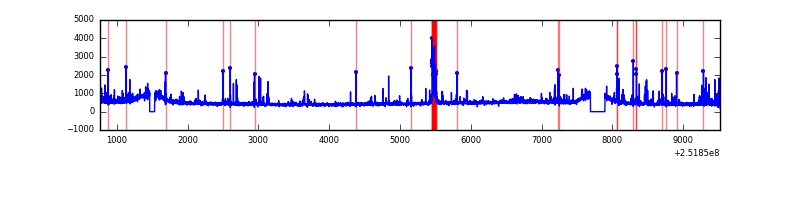 |
| B | 8758 | 8485 | 136 | 136 | 1.55% | 1.60% | 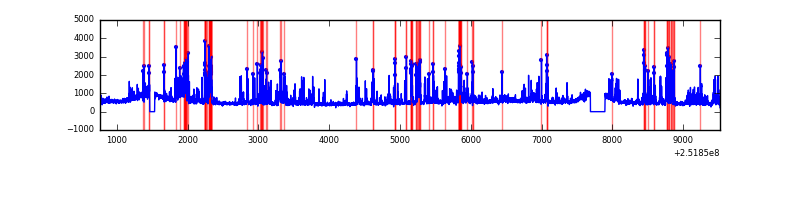 |
| C | 8758 | 8485 | 5 | 5 | 0.06% | 0.06% | 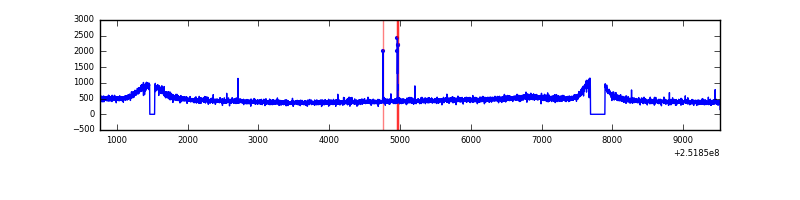 |
| D | 8758 | 8485 | 100 | 100 | 1.14% | 1.18% | 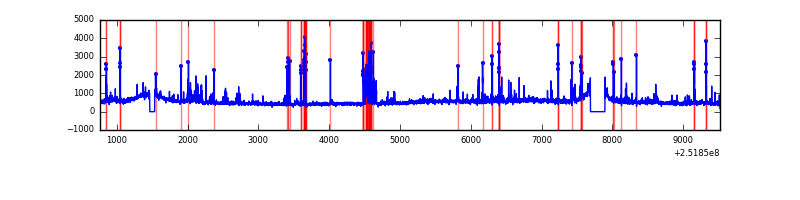 |
Top three noisy pixels from each quadrant. If the there are fewer than three noisy pixels in the level2.evt file, extra rows are filled as -1
| Pixel properties | Quadrant properties | ||||||
|---|---|---|---|---|---|---|---|
| Quadrant | DetID | PixID | Counts | Sigma | Mean | Median | Sigma |
| A | 1 | 162 | 165017 | 783.1 | 1028 | 1005 | 209.4 |
| A | 5 | 16 | 117850 | 557.9 | 1028 | 1005 | 209.4 |
| A | 1 | 178 | 59238 | 278.04 | 1028 | 1005 | 209.4 |
| B | 4 | 239 | 1250578 | 6333.61 | 1027 | 999 | 197.3 |
| B | 15 | 204 | 200872 | 1013.08 | 1027 | 999 | 197.3 |
| B | 0 | 85 | 126088 | 634.03 | 1027 | 999 | 197.3 |
| C | 14 | 234 | 19075 | 76.93 | 1010 | 1014 | 234.8 |
| C | 8 | 128 | 9589 | 36.52 | 1010 | 1014 | 234.8 |
| C | 13 | 61 | 7384 | 27.13 | 1010 | 1014 | 234.8 |
| D | 8 | 195 | 559295 | 2293.22 | 999 | 968 | 243.5 |
| D | 14 | 34 | 279726 | 1144.94 | 999 | 968 | 243.5 |
| D | 1 | 52 | 99184 | 403.4 | 999 | 968 | 243.5 |
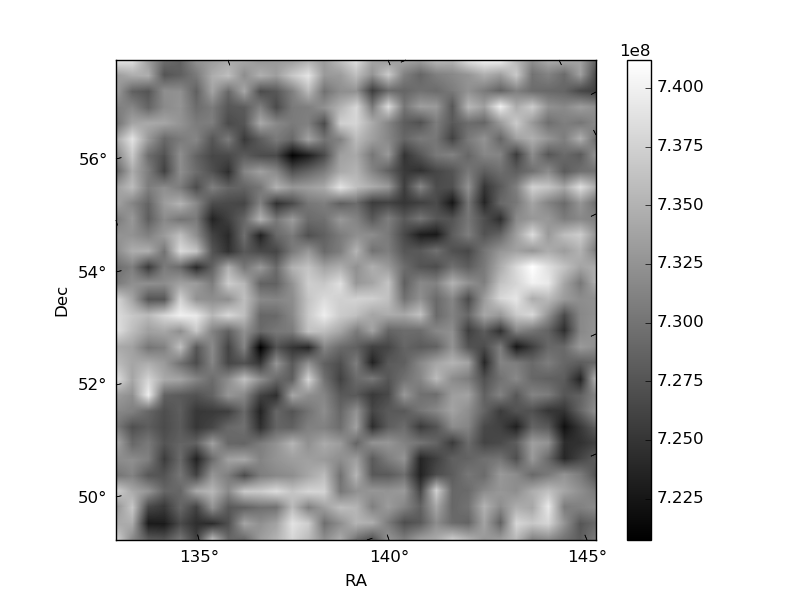
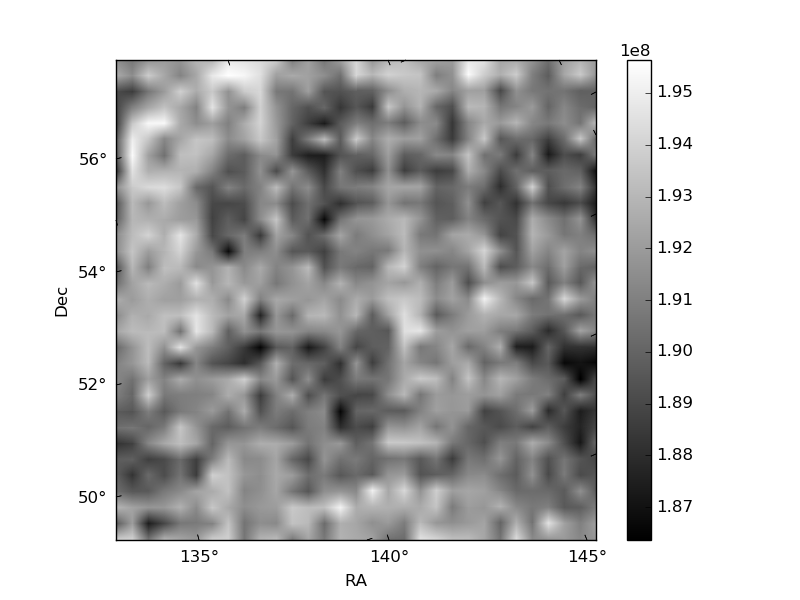
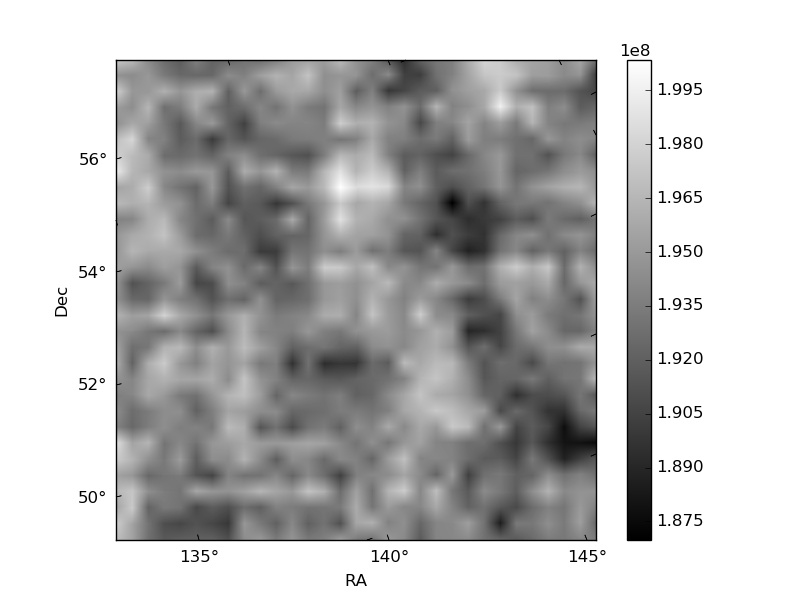
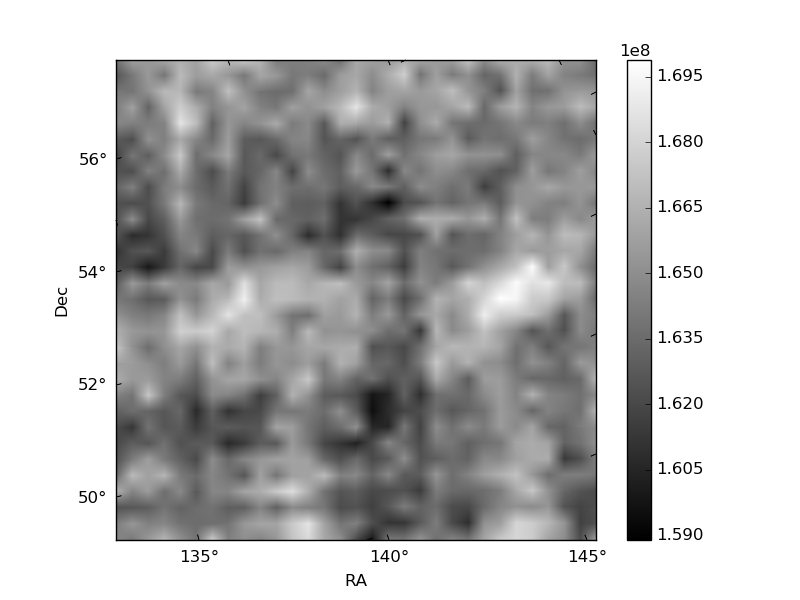
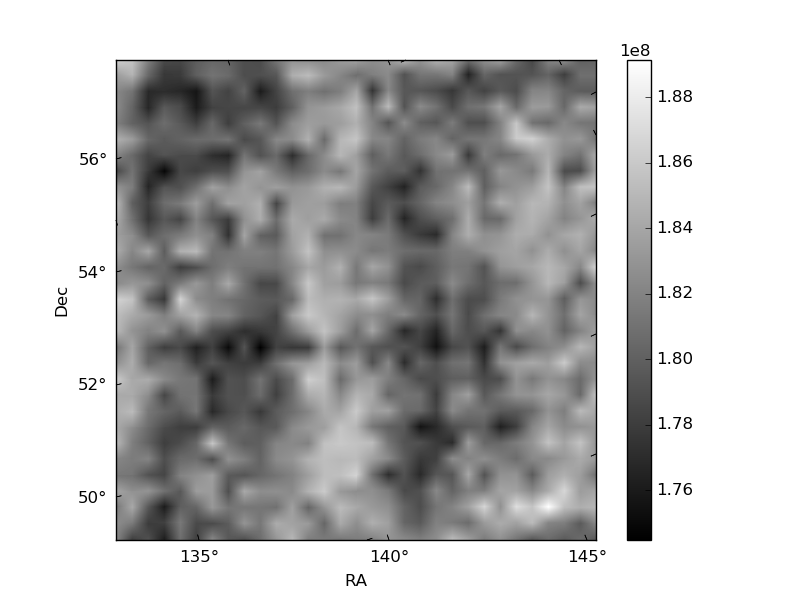
Histogram calculated using DETX and DETY for each event in the final _common_clean file
| Quadrant A | 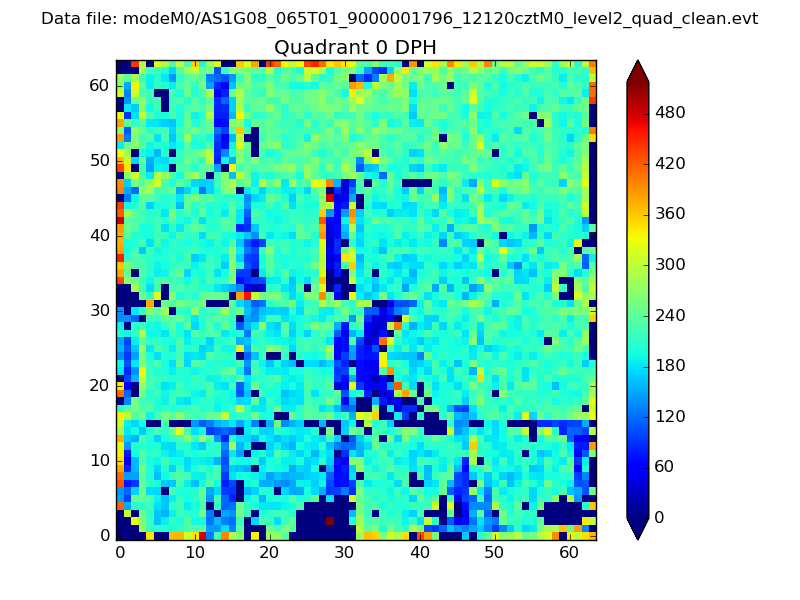 |
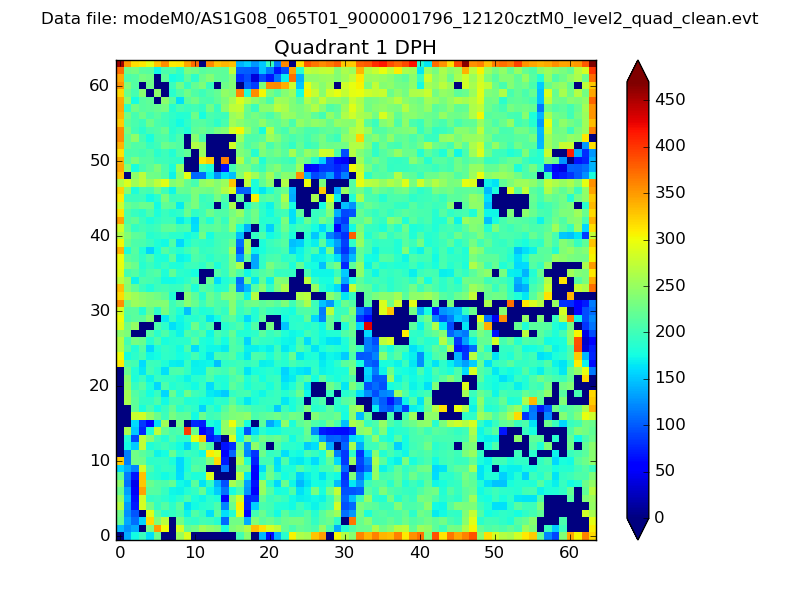 |
Quadrant B |
|---|---|---|---|
| Quadrant D | 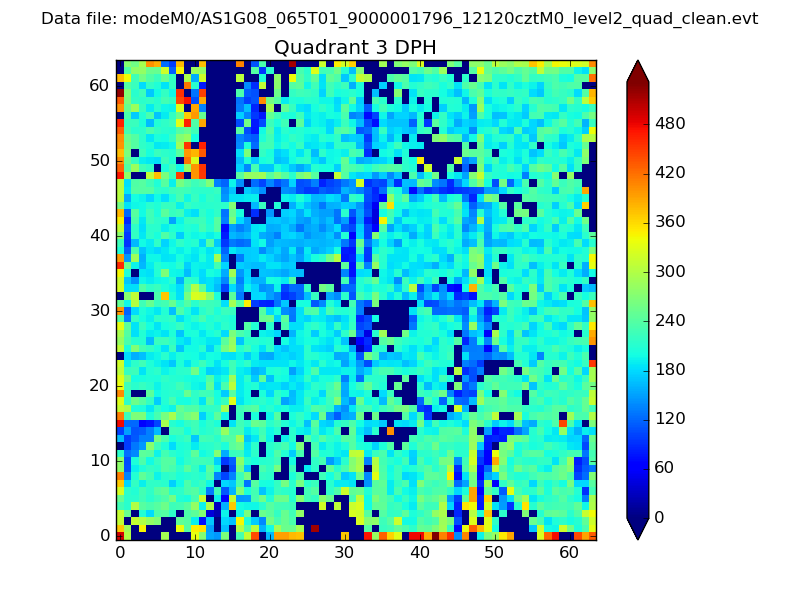 |
 |
Quadrant C |
| Plot type | Count rate plots | Images |
|---|---|---|
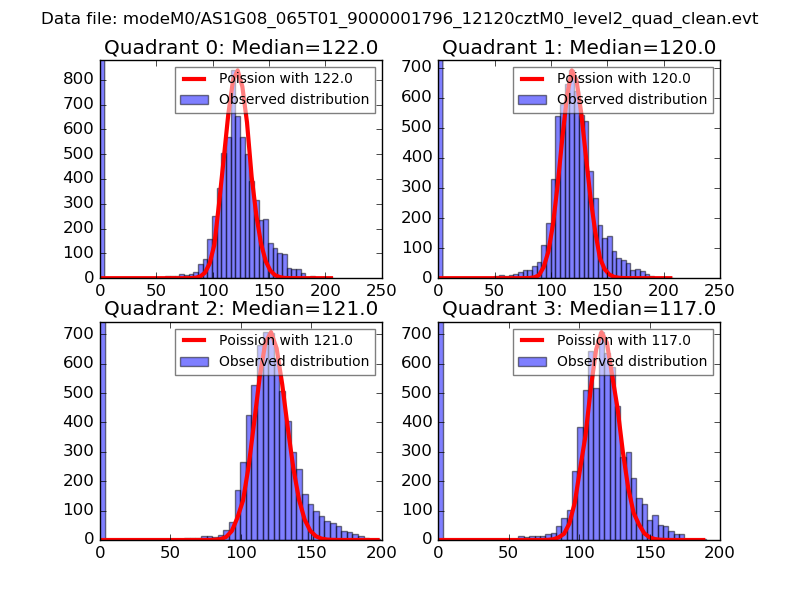
| Comparison with Poisson distribution Blue bars denote a histogram of data divided into 1 sec bins. Red curve is a Poisson curve with rate = median count rate of data. |
 |
 |
| Quadrant-wise count rates Data is divided into 100 sec bins |
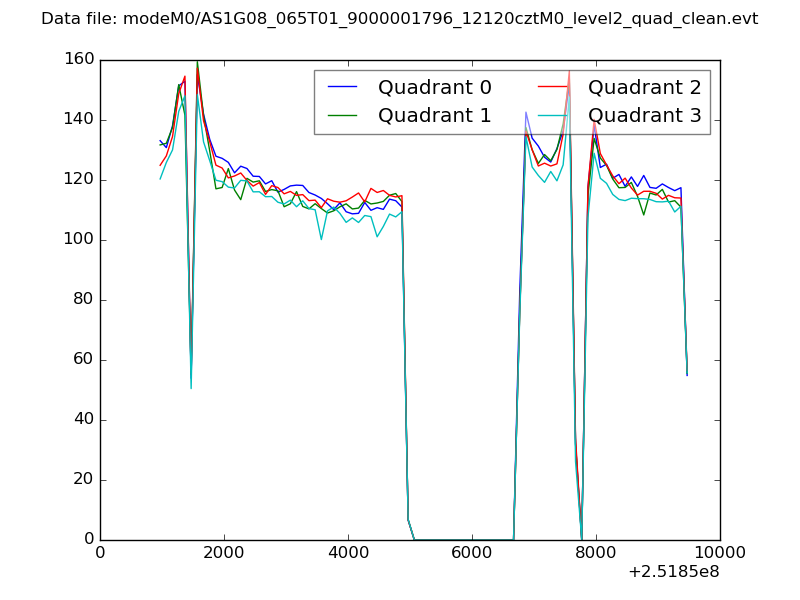 |
|
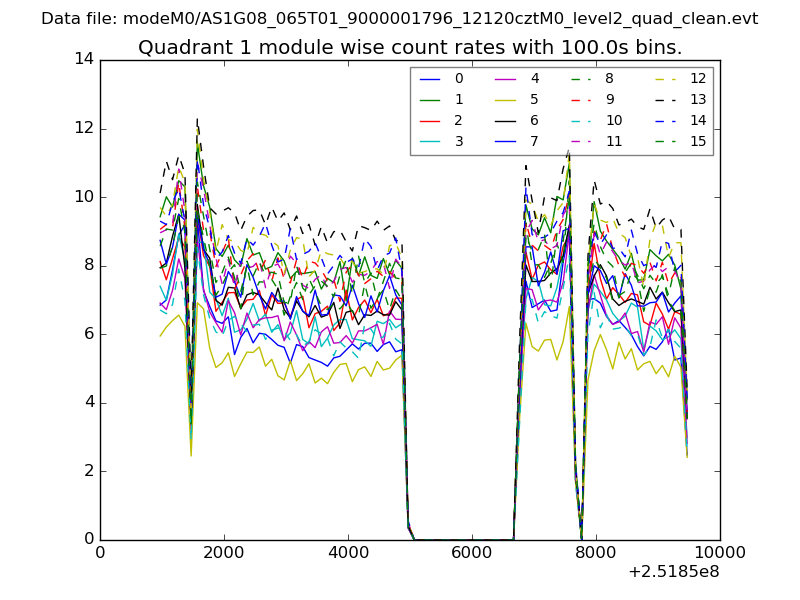
| Module-wise count rates for Quadrant A Data is divided into 100 sec bins |
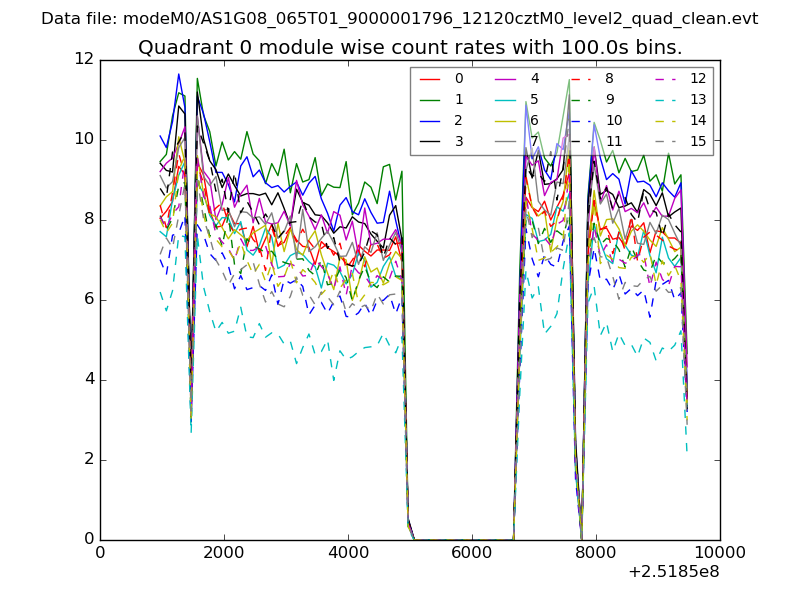 |
 |
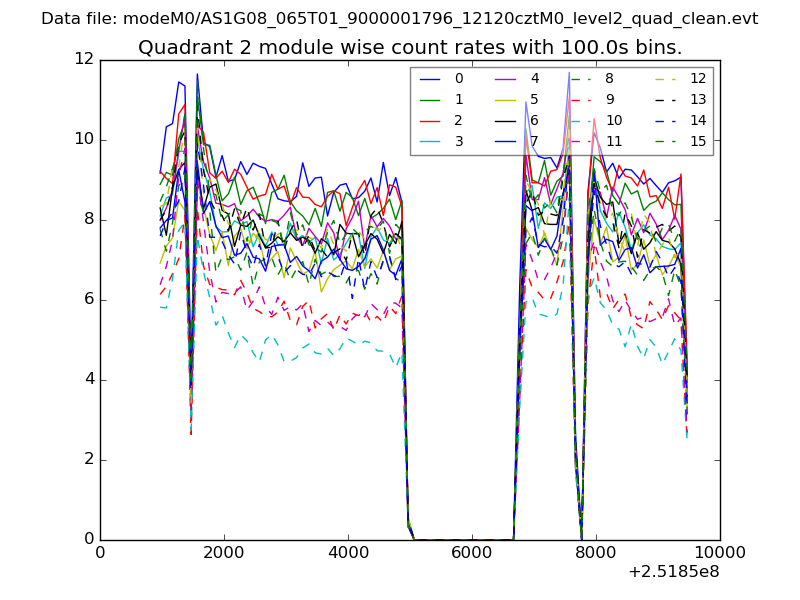
| Module-wise count rates for Quadrant B Data is divided into 100 sec bins |
 |
 |
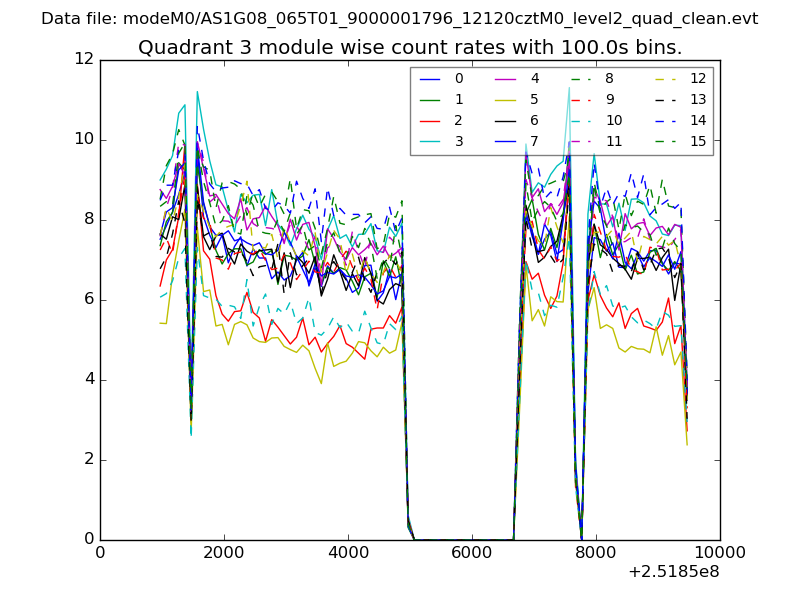
| Module-wise count rates for Quadrant C Data is divided into 100 sec bins |
 |
 |
| Module-wise count rates for Quadrant D Data is divided into 100 sec bins |
 |
 |
| Parameter | Plot |
|---|---|
| CZT HV Monitor | 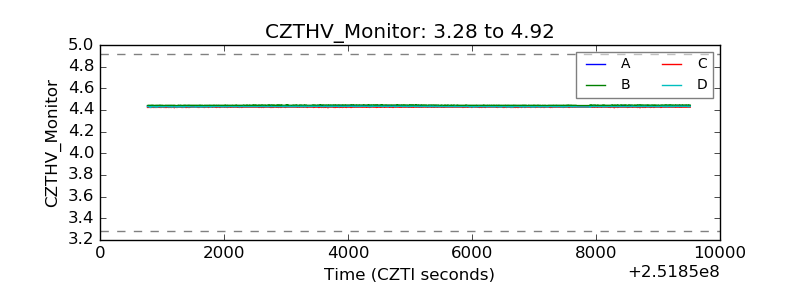 |
| D_VDD | 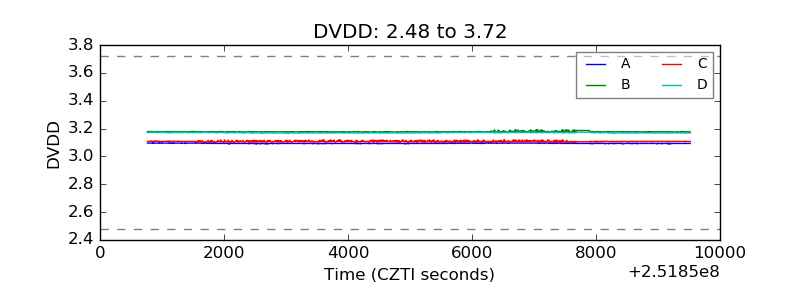 |
| Temperature 1 | 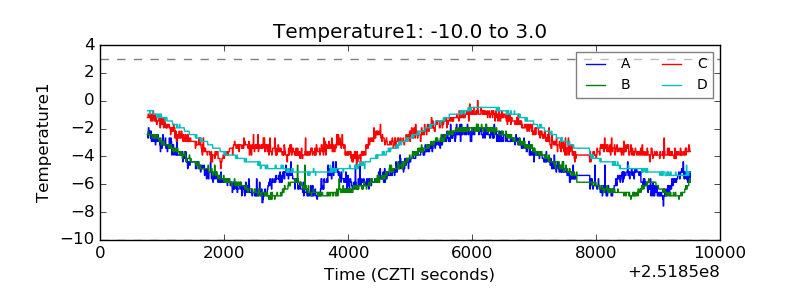 |
| Veto HV Monitor | 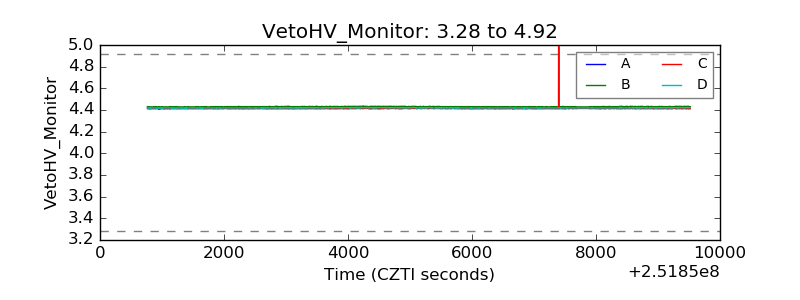 |
| Veto LLD | 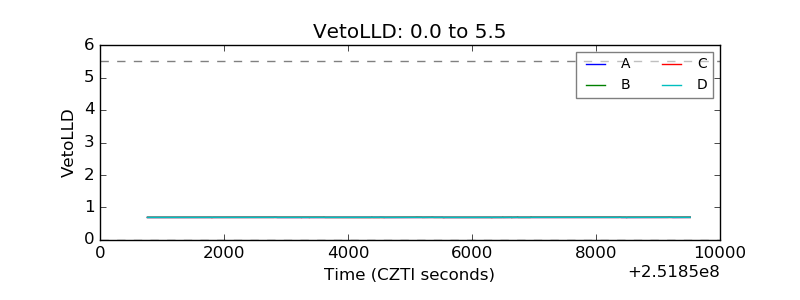 |
| Alpha Counter | 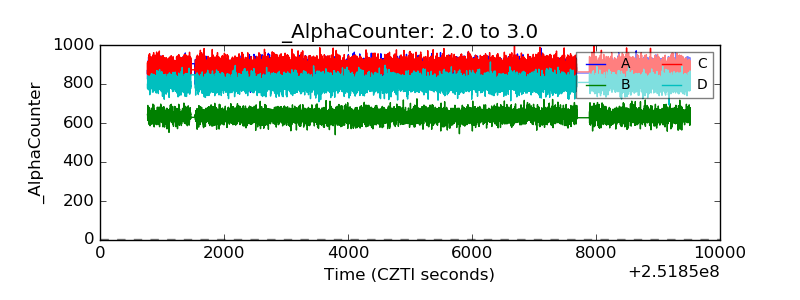 |
| _CPM_Rate | 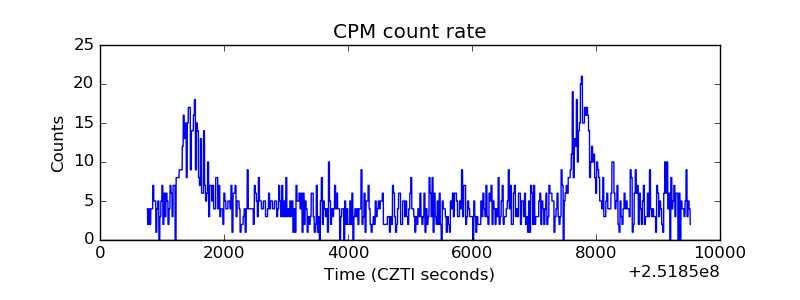 |
| CZT Counter |  |
| +2.5 Volts monitor |  |
| +5 Volts monitor |  |
| _ROLL_ROT | 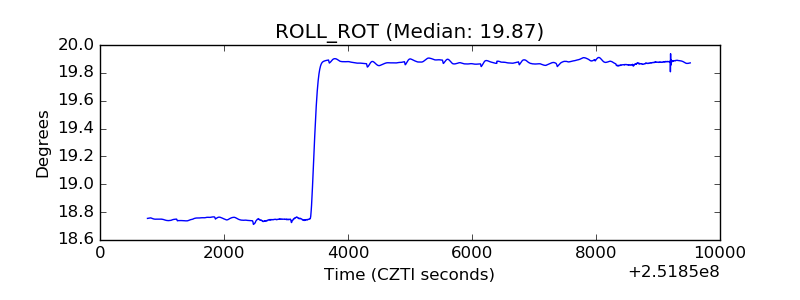 |
| _Roll_DEC | 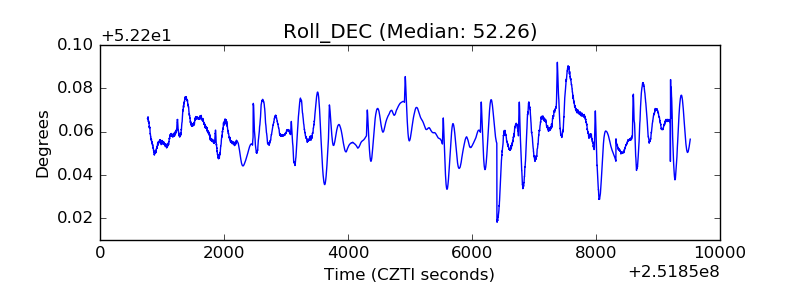 |
| _Roll_RA |  |
| Veto Counter | 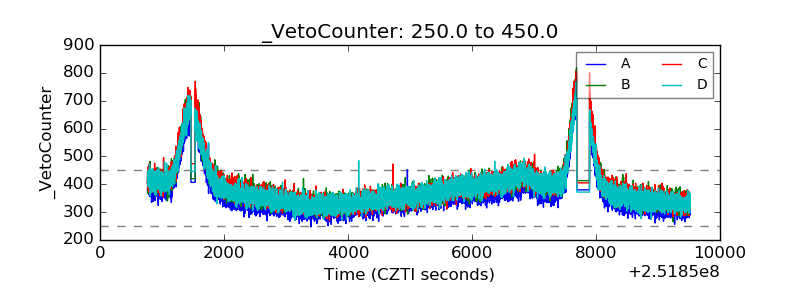 |