| Param | Original file | Final file |
|---|---|---|
| Filename | modeM0/AS1G08_065T01_9000001796_12123cztM0_level2.evt | modeM0/AS1G08_065T01_9000001796_12123cztM0_level2_quad_clean.evt |
| Size (bytes) | 1,473,742,080 | 265,400,640 |
| Size | 1.4 GB | 253.1 MB |
| Events in quadrant A | 10,580,855 | 1,695,200 |
| Events in quadrant B | 12,499,844 | 1,685,484 |
| Events in quadrant C | 8,684,702 | 1,693,446 |
| Events in quadrant D | 11,557,245 | 1,627,780 |
| Mode M0 | |||
|---|---|---|---|
| Quadrant | BADHDUFLAG | Total packets | Discarded packets |
| A | 0 | 44534 | 5 |
| B | 0 | 49855 | 4 |
| C | 0 | 39737 | 4 |
| D | 0 | 47175 | 4 |
| Mode M9 | |||
|---|---|---|---|
| Quadrant | BADHDUFLAG | Total packets | Discarded packets |
| A | 0 | 21 | 0 |
| B | 0 | 21 | 0 |
| C | 0 | 21 | 0 |
| D | 0 | 21 | 0 |
| Mode SS | |||
|---|---|---|---|
| Quadrant | BADHDUFLAG | Total packets | Discarded packets |
| A | 0 | 394 | 0 |
| B | 0 | 394 | 0 |
| C | 0 | 394 | 0 |
| D | 0 | 394 | 0 |
| Quadrant | Total seconds | Saturated seconds | Saturation percentage |
|---|---|---|---|
| A | 19405 | 422 | 2.174697% |
| B | 19405 | 824 | 4.246328% |
| C | 19405 | 94 | 0.484411% |
| D | 19405 | 546 | 2.813708% |
Noise dominated data is calculated using 1-second bins in cleaned event files. If a bin has >2000 counts, and if more than 50% of those come from <1% of pixels, then it is considered to be noise-dominated and hence unusable.
| Quadrant | # 1 sec bins | Bins with >0 counts | Bins with >2000 counts | High rate bins dominated by noise | Noise dominated (total time) | Noise dominated (detector-on time) | Marked lightcurve |
|---|---|---|---|---|---|---|---|
| A | 21421 | 19408 | 73 | 73 | 0.34% | 0.38% | 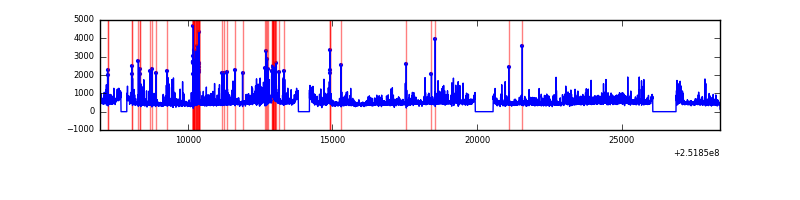 |
| B | 21421 | 19409 | 341 | 341 | 1.59% | 1.76% | 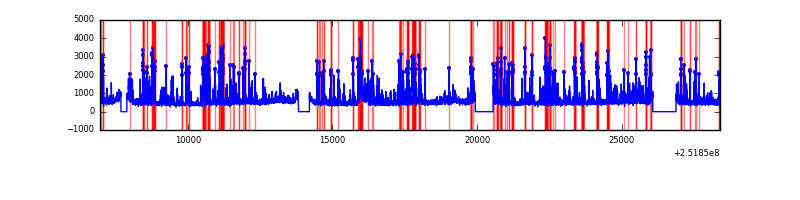 |
| C | 21421 | 19410 | 0 | 0 | 0.00% | 0.00% | 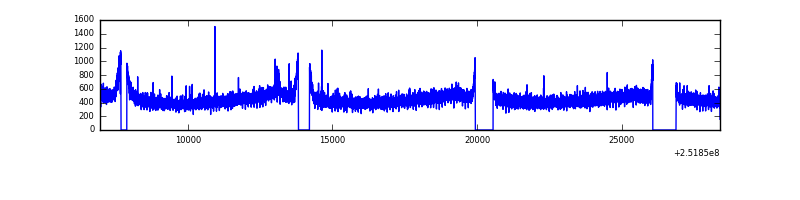 |
| D | 21421 | 19410 | 322 | 322 | 1.50% | 1.66% | 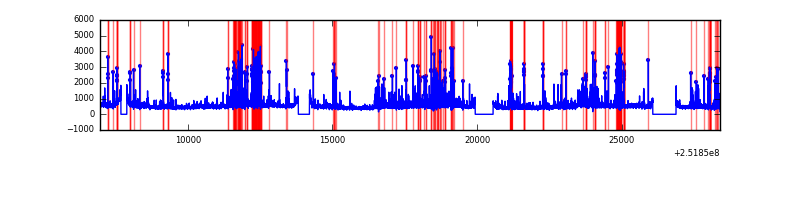 |
Top three noisy pixels from each quadrant. If the there are fewer than three noisy pixels in the level2.evt file, extra rows are filled as -1
| Pixel properties | Quadrant properties | ||||||
|---|---|---|---|---|---|---|---|
| Quadrant | DetID | PixID | Counts | Sigma | Mean | Median | Sigma |
| A | 14 | 63 | 424870 | 921.12 | 2282 | 2230 | 458.8 |
| A | 1 | 162 | 414936 | 899.47 | 2282 | 2230 | 458.8 |
| A | 1 | 178 | 201931 | 435.24 | 2282 | 2230 | 458.8 |
| B | 4 | 239 | 2602959 | 6067.4 | 2262 | 2204 | 428.6 |
| B | 0 | 85 | 409758 | 950.8 | 2262 | 2204 | 428.6 |
| B | 11 | 51 | 263274 | 609.06 | 2262 | 2204 | 428.6 |
| C | 15 | 208 | 38035 | 70.15 | 2217 | 2224 | 510.5 |
| C | 13 | 61 | 16165 | 27.31 | 2217 | 2224 | 510.5 |
| C | 14 | 234 | 9961 | 15.16 | 2217 | 2224 | 510.5 |
| D | 1 | 52 | 1595058 | 3047.42 | 2185 | 2122 | 522.7 |
| D | 8 | 195 | 623704 | 1189.14 | 2185 | 2122 | 522.7 |
| D | 13 | 104 | 360588 | 685.78 | 2185 | 2122 | 522.7 |
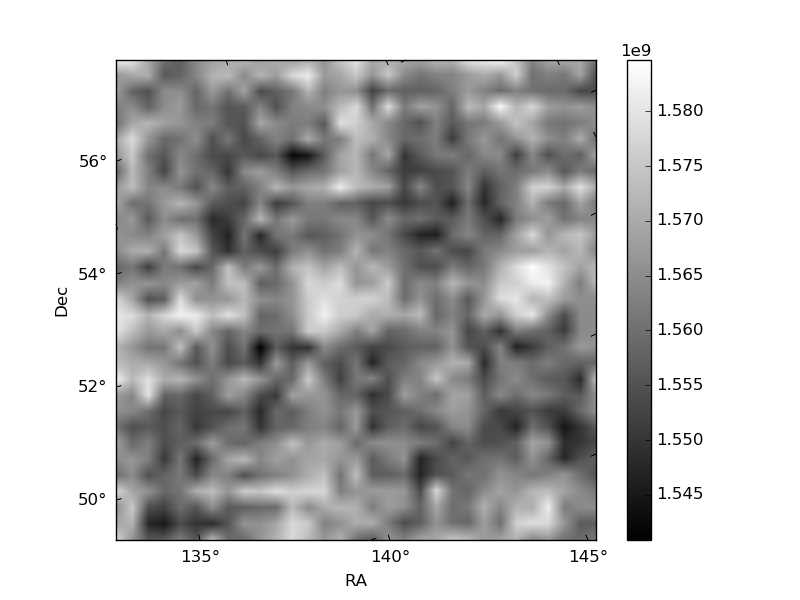
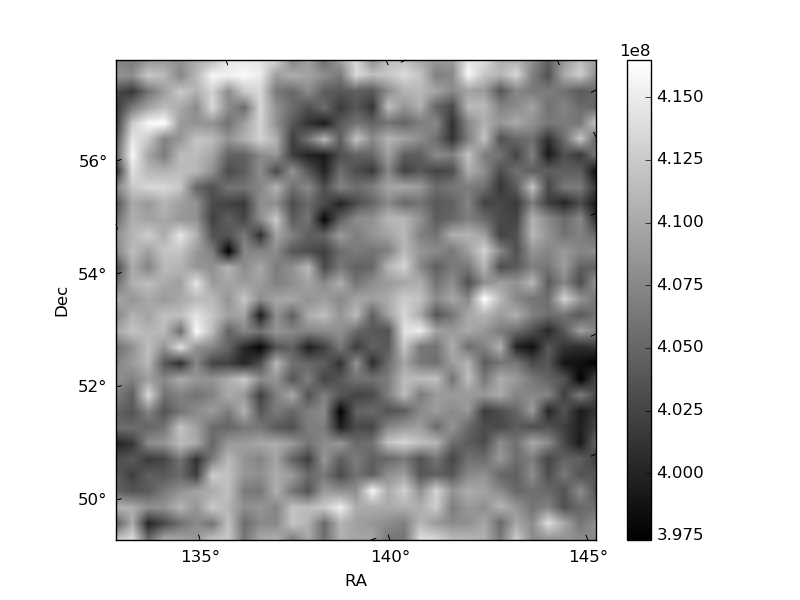
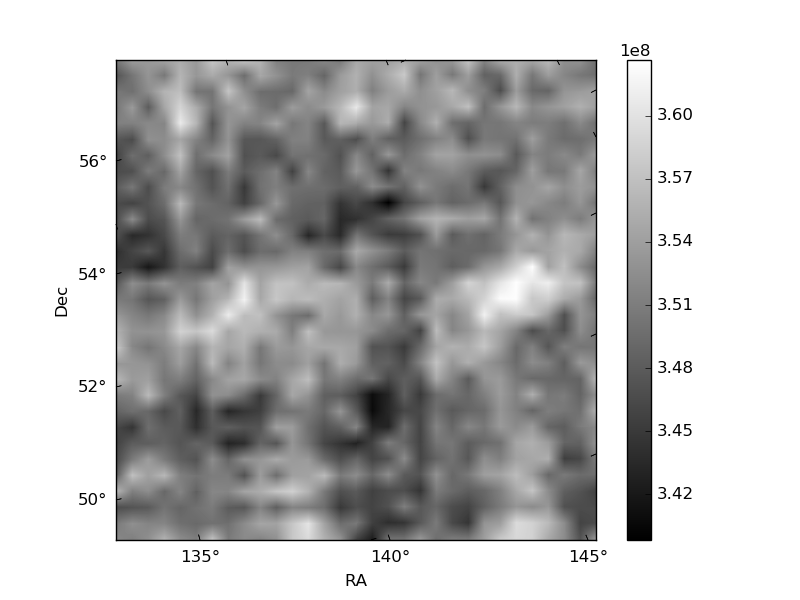
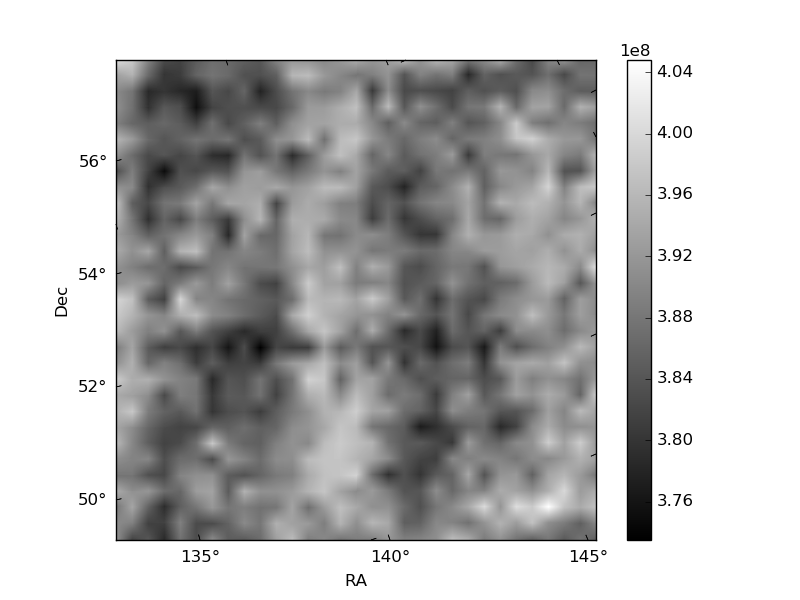
Histogram calculated using DETX and DETY for each event in the final _common_clean file
| Quadrant A | 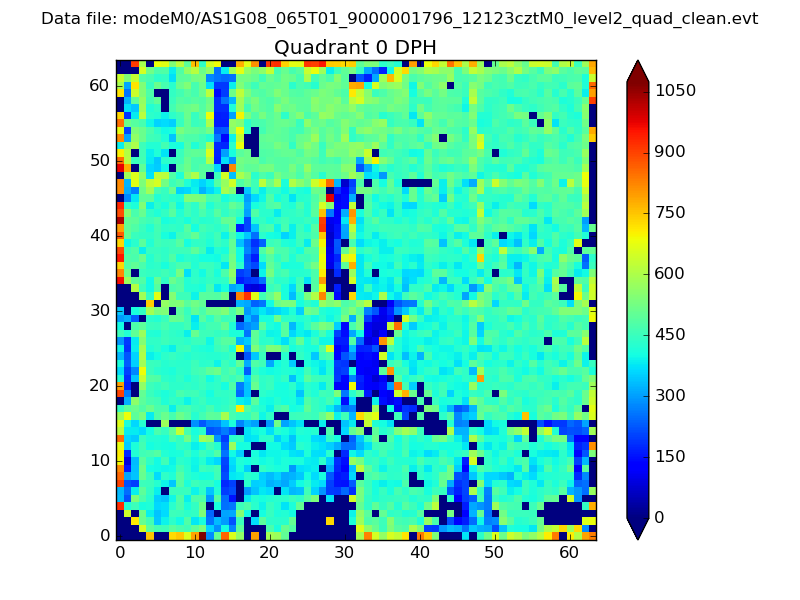 |
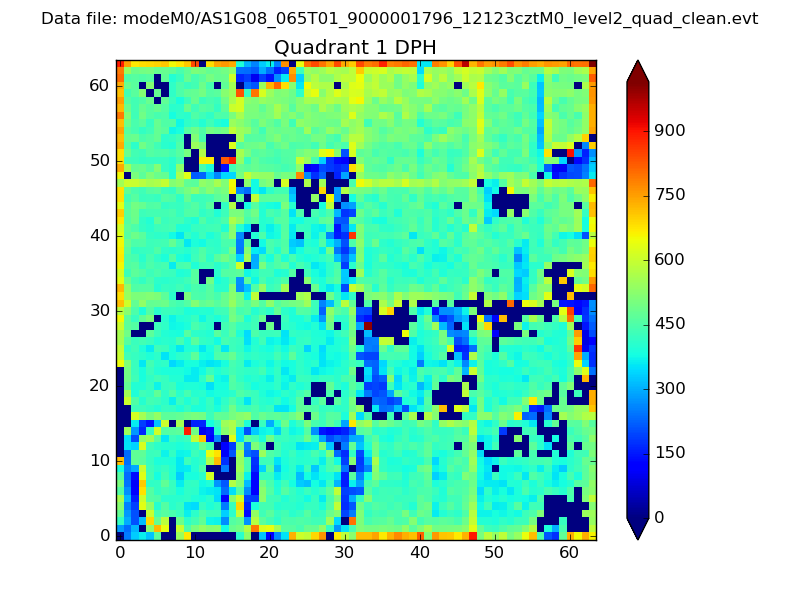 |
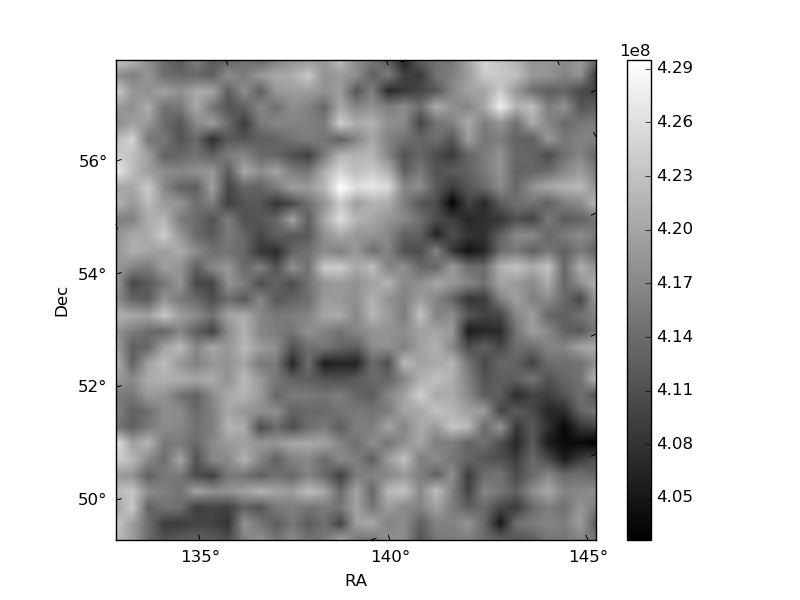
Quadrant B |
|---|---|---|---|
| Quadrant D | 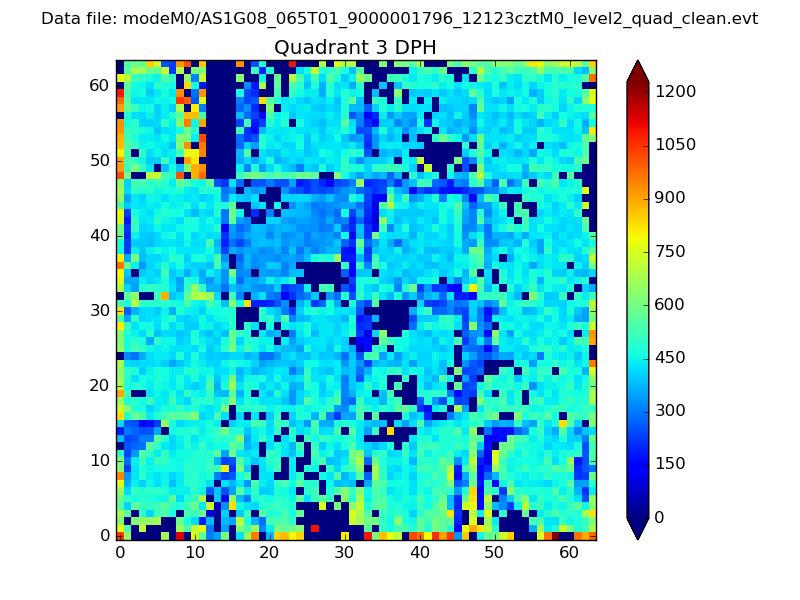 |
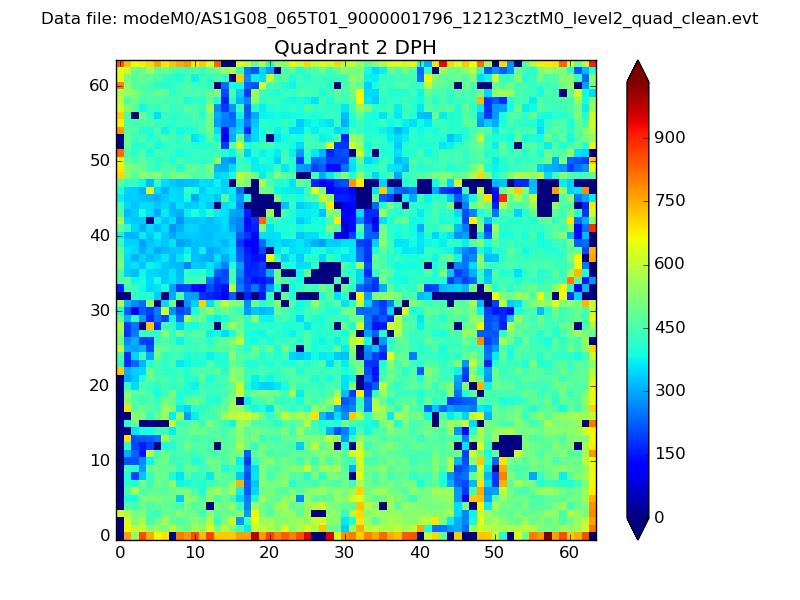 |
Quadrant C |
| Plot type | Count rate plots | Images |
|---|---|---|
| Comparison with Poisson distribution Blue bars denote a histogram of data divided into 1 sec bins. Red curve is a Poisson curve with rate = median count rate of data. |
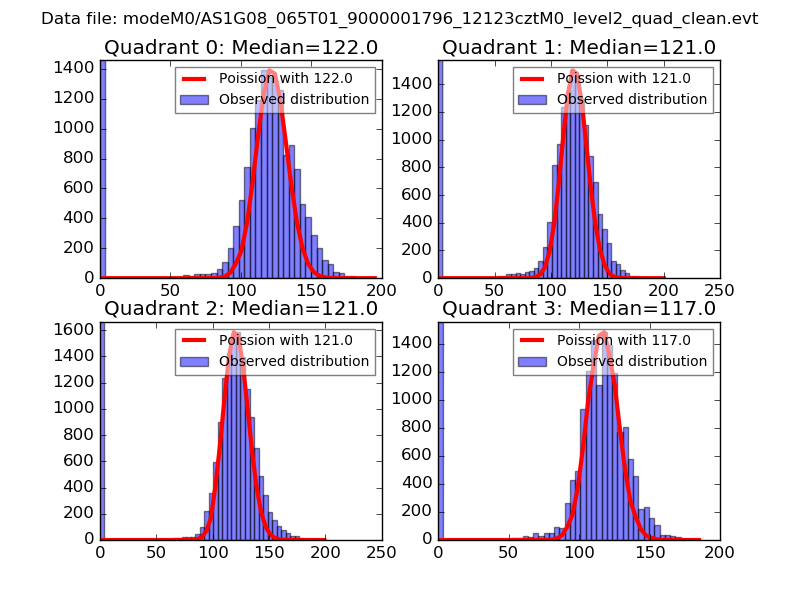 |
 |
| Quadrant-wise count rates Data is divided into 100 sec bins |
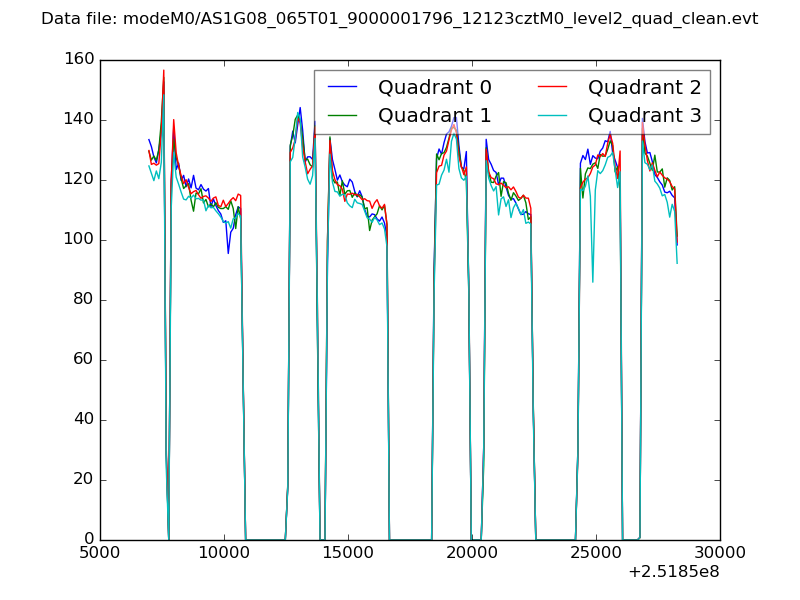 |
|
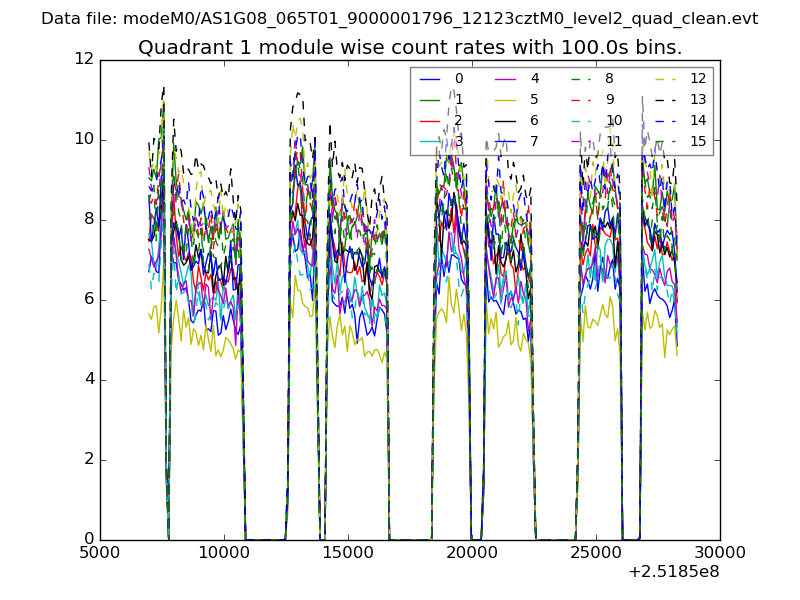
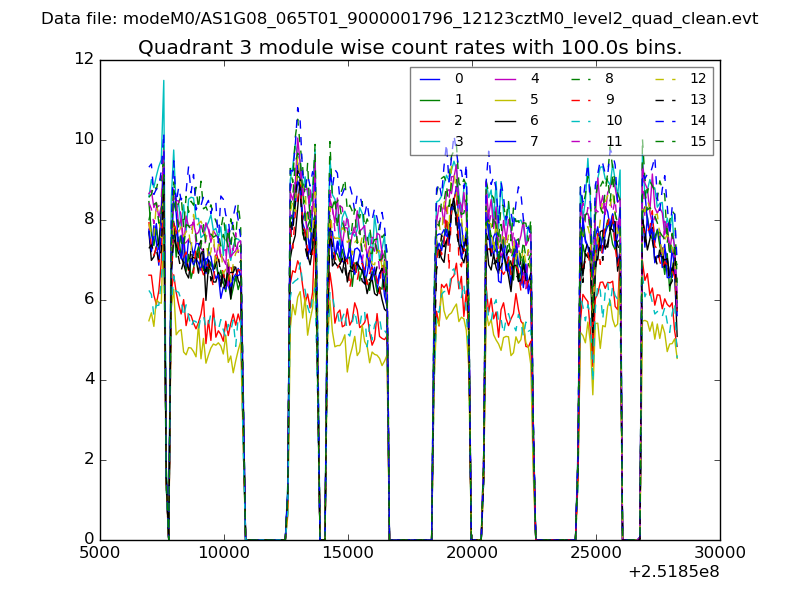
| Module-wise count rates for Quadrant A Data is divided into 100 sec bins |
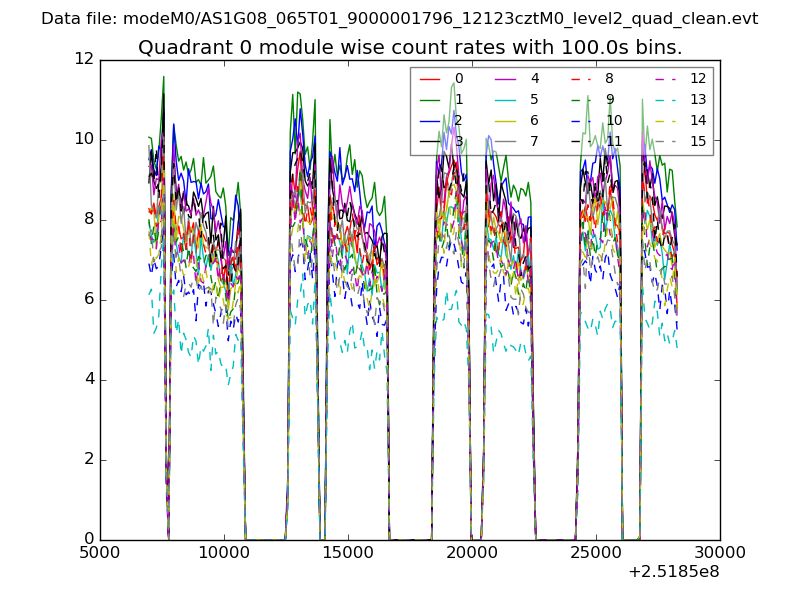 |
 |
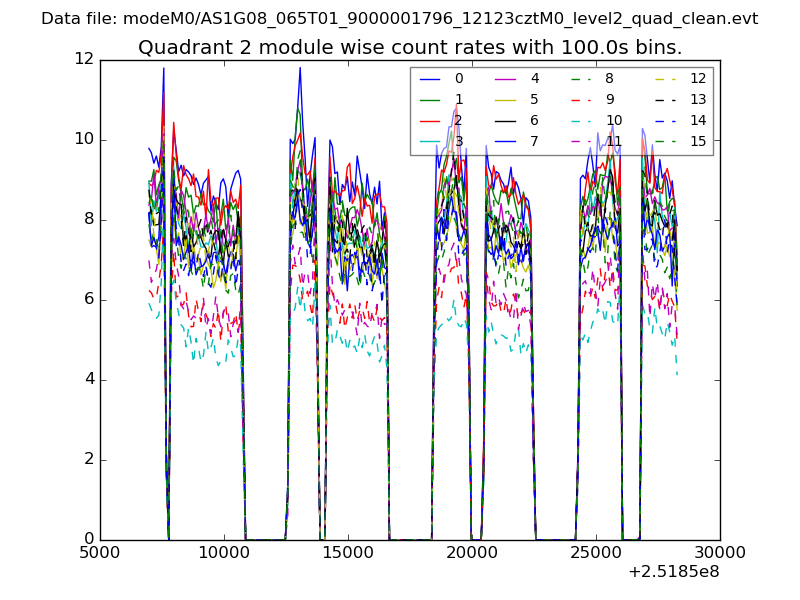
| Module-wise count rates for Quadrant B Data is divided into 100 sec bins |
 |
 |
| Module-wise count rates for Quadrant C Data is divided into 100 sec bins |
 |
 |
| Module-wise count rates for Quadrant D Data is divided into 100 sec bins |
 |
 |
| Parameter | Plot |
|---|---|
| CZT HV Monitor | 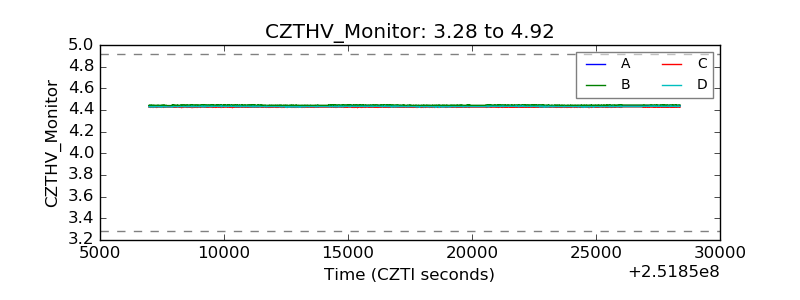 |
| D_VDD | 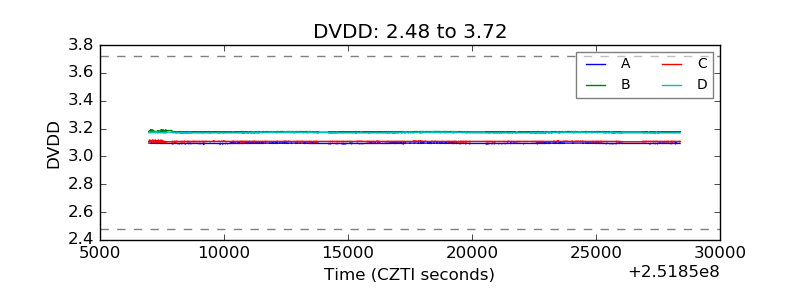 |
| Temperature 1 | 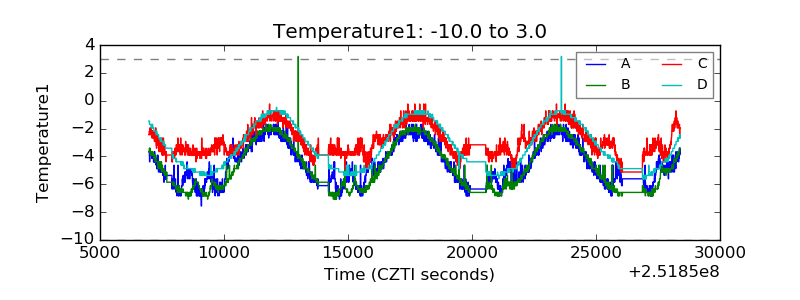 |
| Veto HV Monitor | 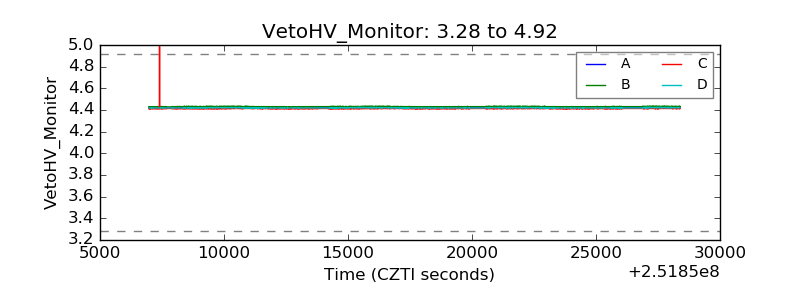 |
| Veto LLD | 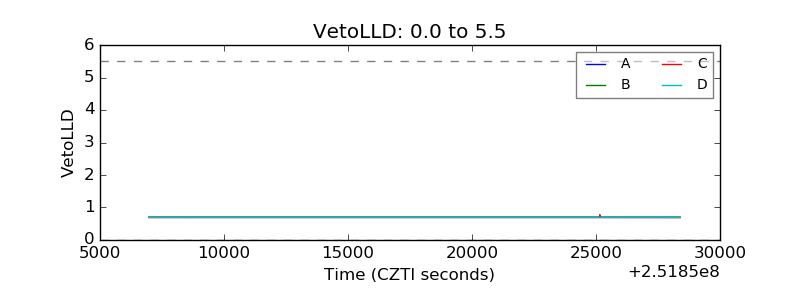 |
| Alpha Counter | 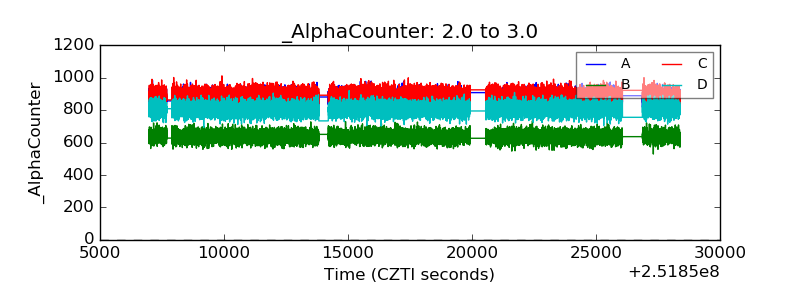 |
| _CPM_Rate | 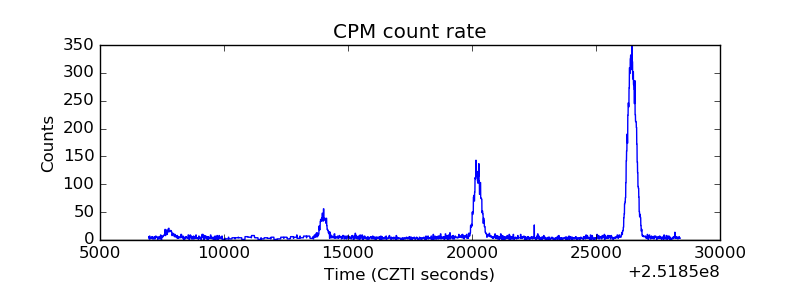 |
| CZT Counter | 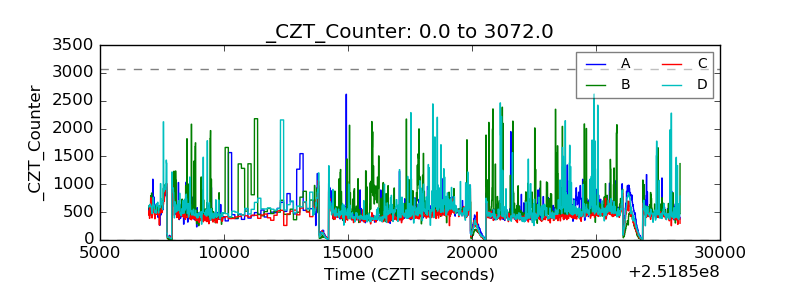 |
| +2.5 Volts monitor |  |
| +5 Volts monitor | 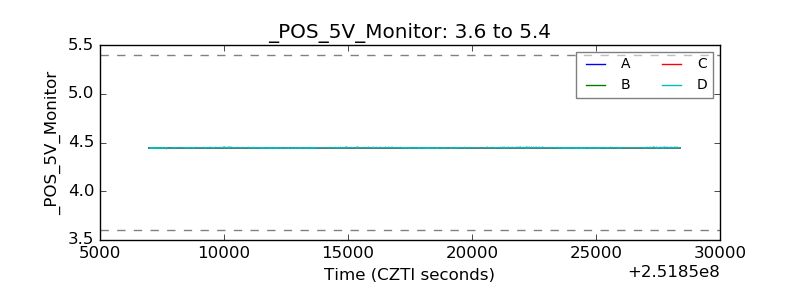 |
| _ROLL_ROT | 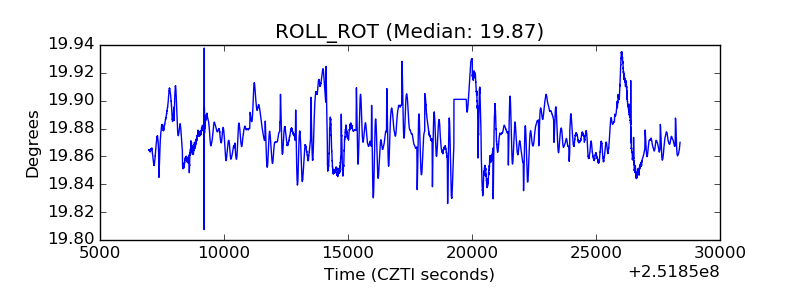 |
| _Roll_DEC | 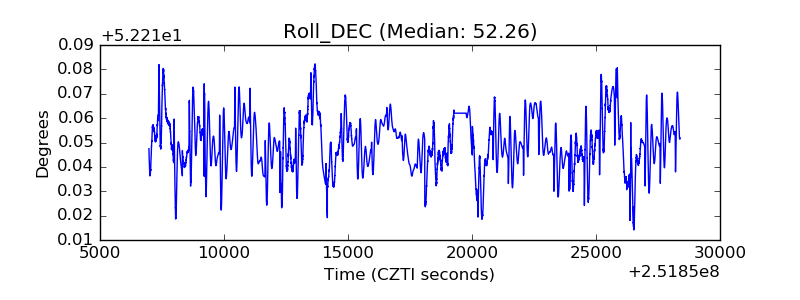 |
| _Roll_RA | 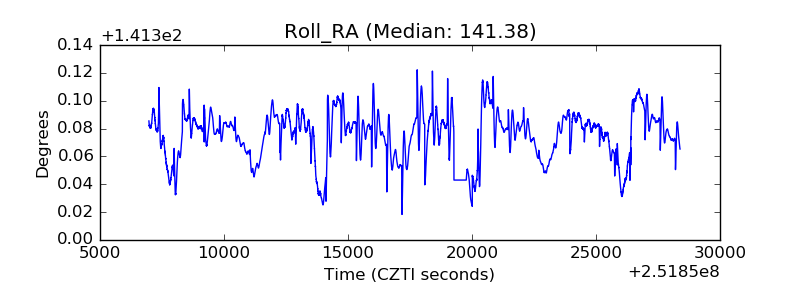 |
| Veto Counter | 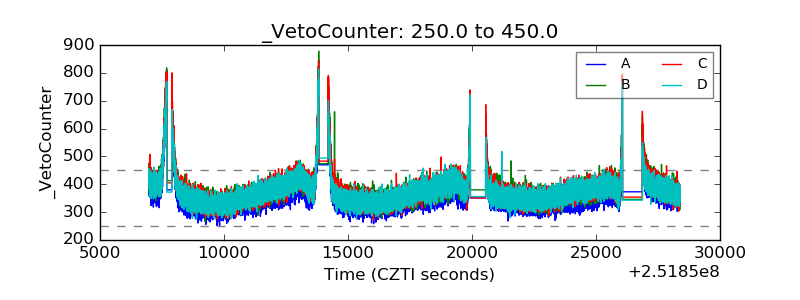 |