| Param | Original file | Final file |
|---|---|---|
| Filename | modeM0/AS1G08_065T01_9000001796_12124cztM0_level2.evt | modeM0/AS1G08_065T01_9000001796_12124cztM0_level2_quad_clean.evt |
| Size (bytes) | 1,407,430,080 | 250,416,000 |
| Size | 1.3 GB | 238.8 MB |
| Events in quadrant A | 10,258,905 | 1,591,634 |
| Events in quadrant B | 11,849,941 | 1,578,911 |
| Events in quadrant C | 8,311,922 | 1,589,427 |
| Events in quadrant D | 10,936,447 | 1,531,665 |
| Mode M0 | |||
|---|---|---|---|
| Quadrant | BADHDUFLAG | Total packets | Discarded packets |
| A | 0 | 43319 | 5 |
| B | 0 | 47390 | 5 |
| C | 0 | 38168 | 4 |
| D | 0 | 44798 | 4 |
| Mode M9 | |||
|---|---|---|---|
| Quadrant | BADHDUFLAG | Total packets | Discarded packets |
| A | 0 | 22 | 0 |
| B | 0 | 22 | 0 |
| C | 0 | 22 | 0 |
| D | 0 | 22 | 0 |
| Mode SS | |||
|---|---|---|---|
| Quadrant | BADHDUFLAG | Total packets | Discarded packets |
| A | 0 | 382 | 0 |
| B | 0 | 382 | 0 |
| C | 0 | 382 | 0 |
| D | 0 | 382 | 0 |
| Quadrant | Total seconds | Saturated seconds | Saturation percentage |
|---|---|---|---|
| A | 18758 | 356 | 1.897857% |
| B | 18757 | 712 | 3.795916% |
| C | 18757 | 77 | 0.410513% |
| D | 18757 | 481 | 2.564376% |
Noise dominated data is calculated using 1-second bins in cleaned event files. If a bin has >2000 counts, and if more than 50% of those come from <1% of pixels, then it is considered to be noise-dominated and hence unusable.
| Quadrant | # 1 sec bins | Bins with >0 counts | Bins with >2000 counts | High rate bins dominated by noise | Noise dominated (total time) | Noise dominated (detector-on time) | Marked lightcurve |
|---|---|---|---|---|---|---|---|
| A | 25831 | 18762 | 70 | 70 | 0.27% | 0.37% | 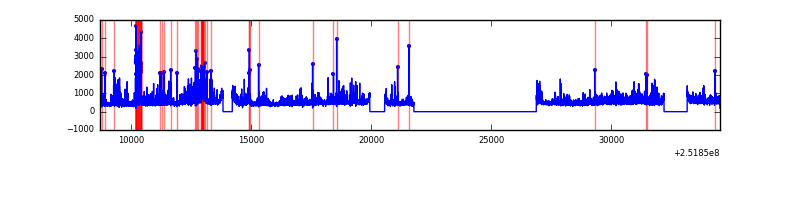 |
| B | 25831 | 18762 | 318 | 318 | 1.23% | 1.69% | 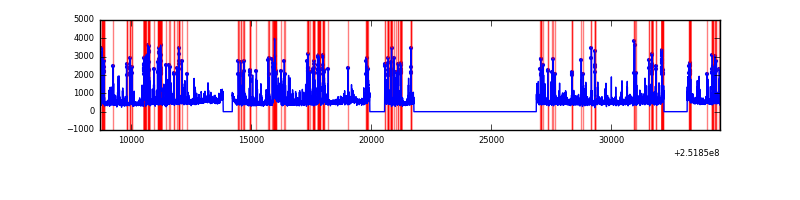 |
| C | 25831 | 18762 | 2 | 2 | 0.01% | 0.01% | 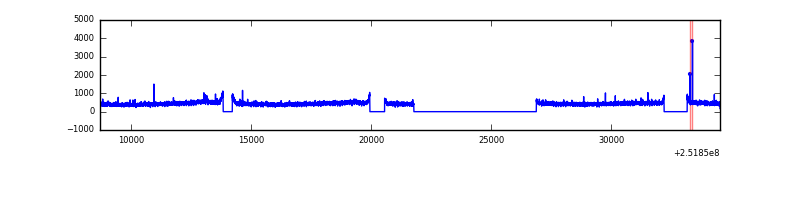 |
| D | 25831 | 18762 | 300 | 300 | 1.16% | 1.60% | 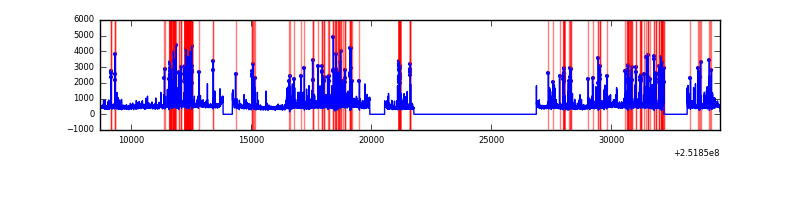 |
Top three noisy pixels from each quadrant. If the there are fewer than three noisy pixels in the level2.evt file, extra rows are filled as -1
| Pixel properties | Quadrant properties | ||||||
|---|---|---|---|---|---|---|---|
| Quadrant | DetID | PixID | Counts | Sigma | Mean | Median | Sigma |
| A | 14 | 63 | 500144 | 1129.04 | 2193 | 2143 | 441.1 |
| A | 1 | 162 | 382819 | 863.05 | 2193 | 2143 | 441.1 |
| A | 13 | 248 | 200981 | 450.79 | 2193 | 2143 | 441.1 |
| B | 4 | 239 | 2433064 | 5928.81 | 2168 | 2114 | 410.0 |
| B | 11 | 51 | 263998 | 638.71 | 2168 | 2114 | 410.0 |
| B | 0 | 85 | 251806 | 608.97 | 2168 | 2114 | 410.0 |
| C | 15 | 208 | 38252 | 74.13 | 2120 | 2127 | 487.3 |
| C | 13 | 61 | 15442 | 27.32 | 2120 | 2127 | 487.3 |
| C | 14 | 234 | 12833 | 21.97 | 2120 | 2127 | 487.3 |
| D | 1 | 52 | 1448604 | 2869.66 | 2097 | 2037 | 504.1 |
| D | 8 | 195 | 587942 | 1162.3 | 2097 | 2037 | 504.1 |
| D | 13 | 104 | 279270 | 549.97 | 2097 | 2037 | 504.1 |
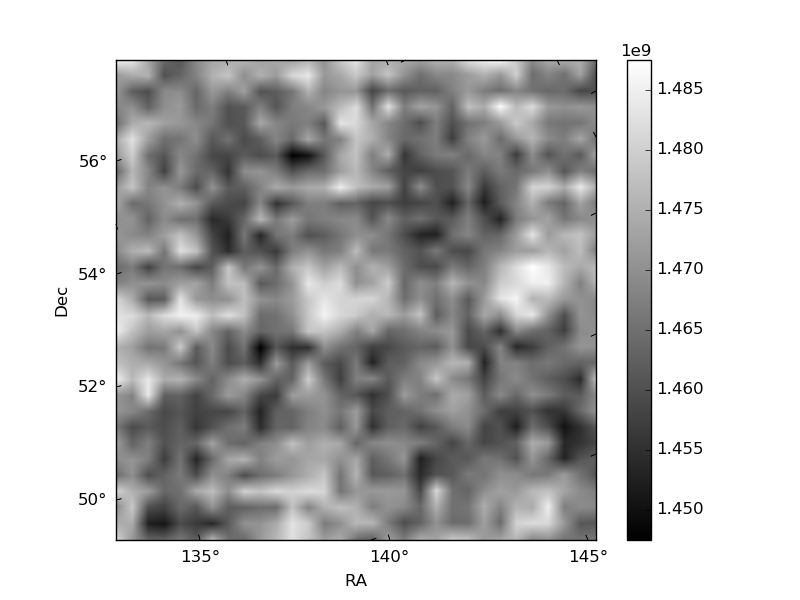
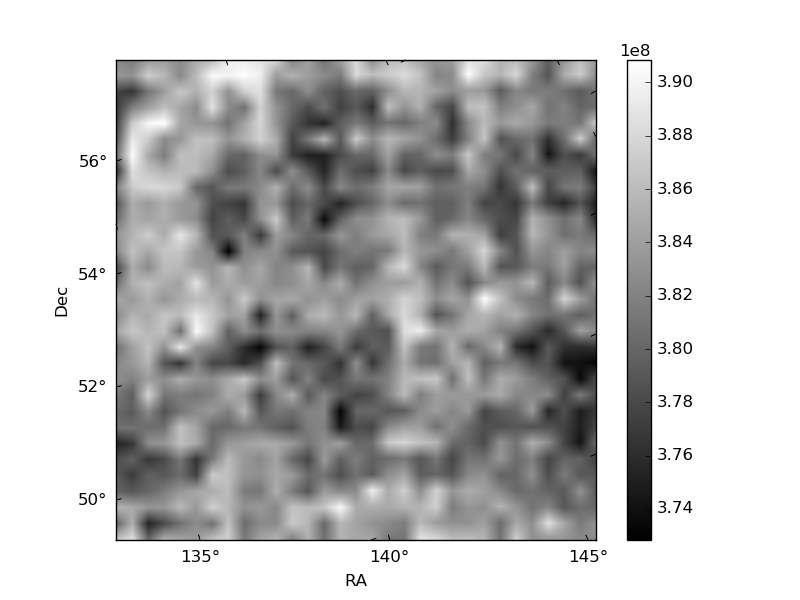
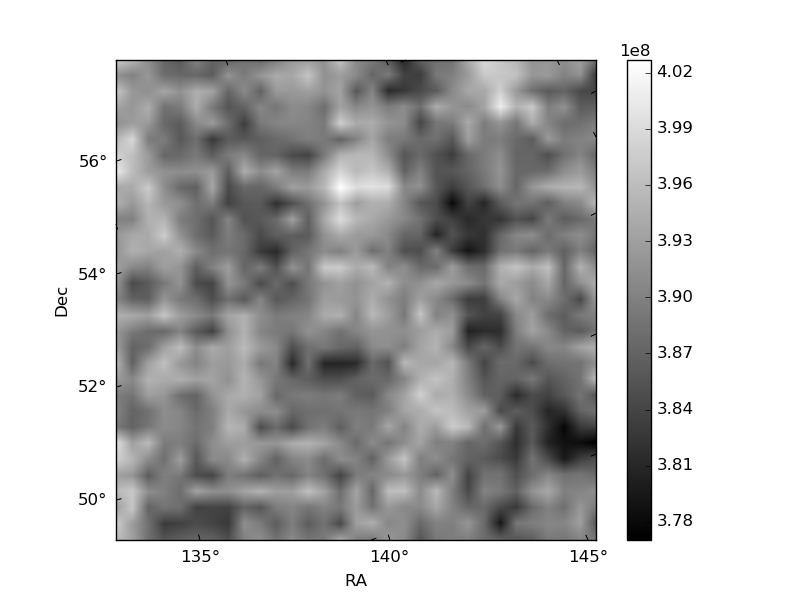
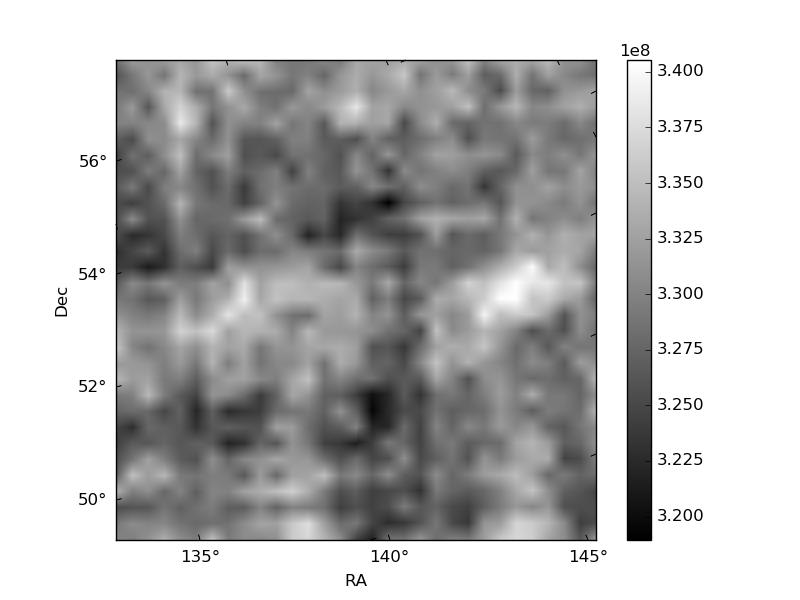
Histogram calculated using DETX and DETY for each event in the final _common_clean file
| Quadrant A | 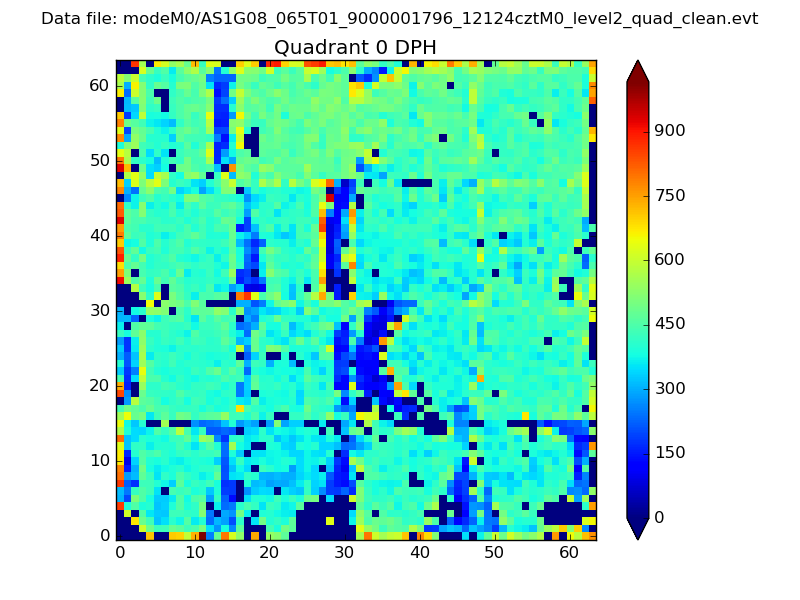 |
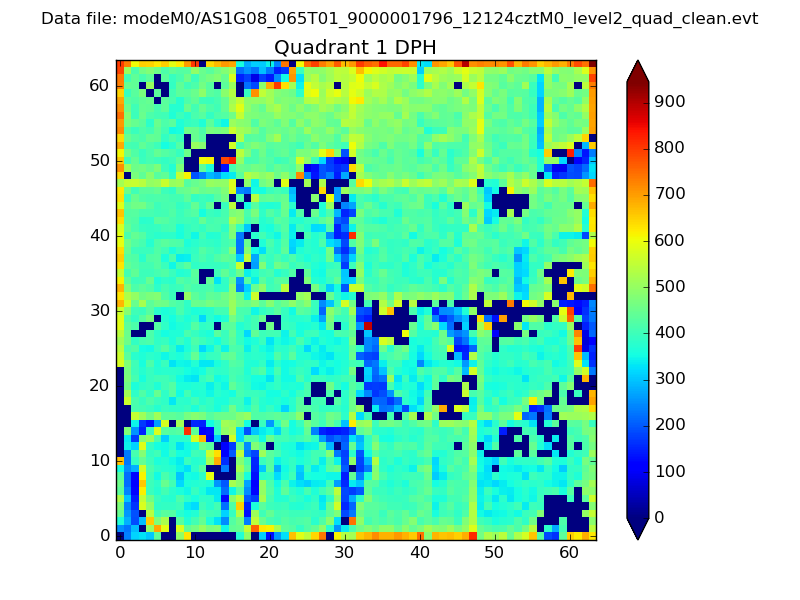 |
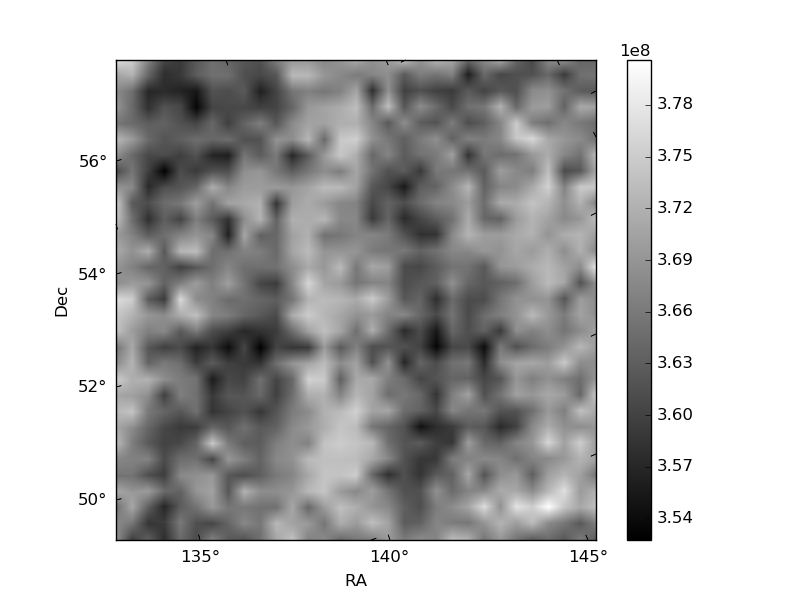
Quadrant B |
|---|---|---|---|
| Quadrant D | 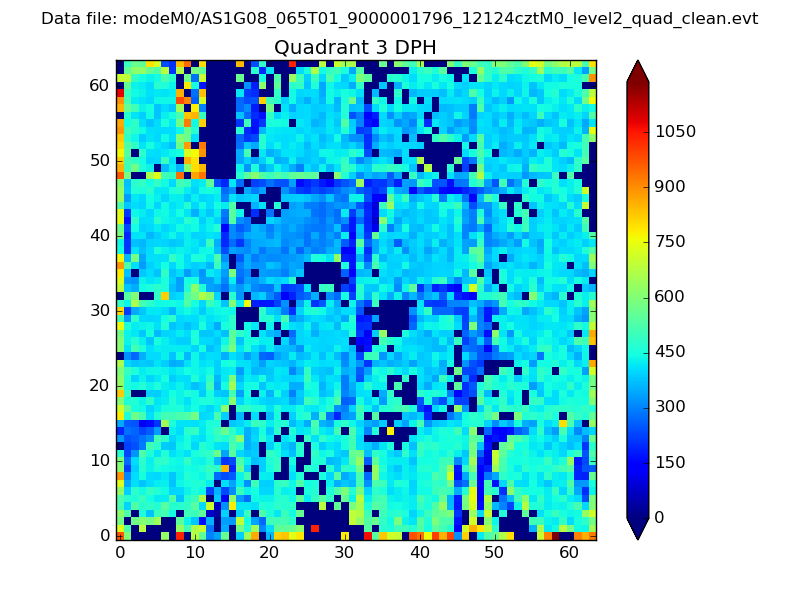 |
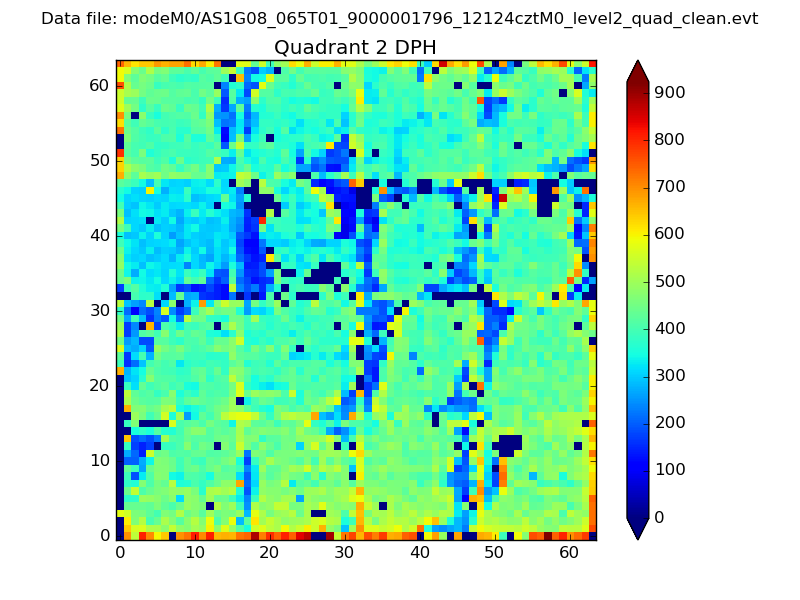 |
Quadrant C |
| Plot type | Count rate plots | Images |
|---|---|---|
| Comparison with Poisson distribution Blue bars denote a histogram of data divided into 1 sec bins. Red curve is a Poisson curve with rate = median count rate of data. |
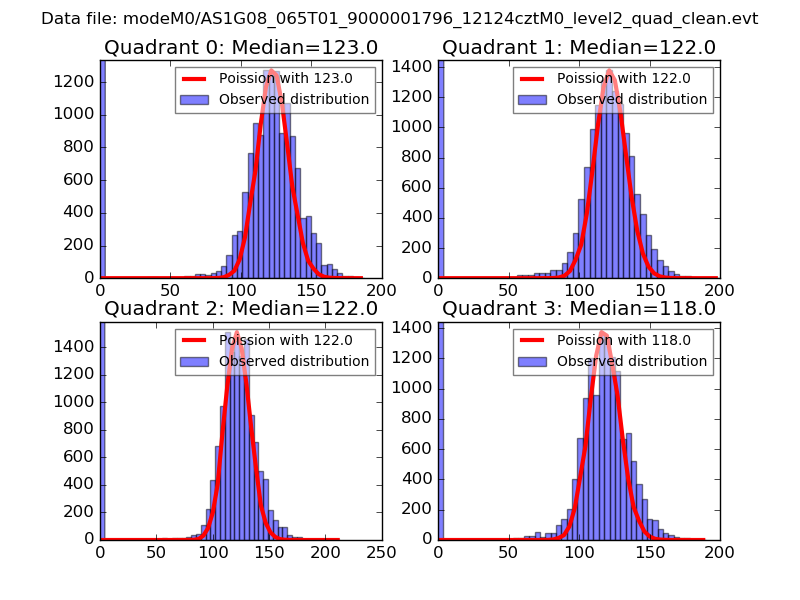 |
 |
| Quadrant-wise count rates Data is divided into 100 sec bins |
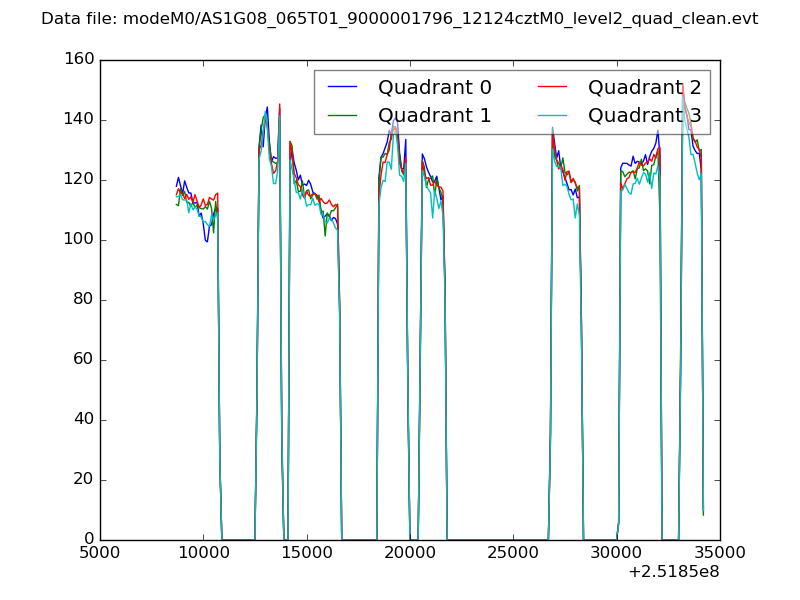 |
|
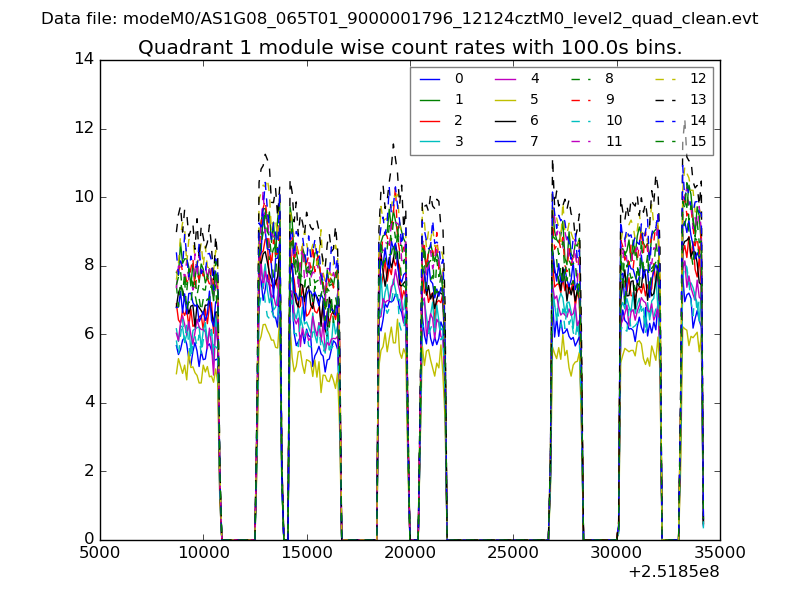
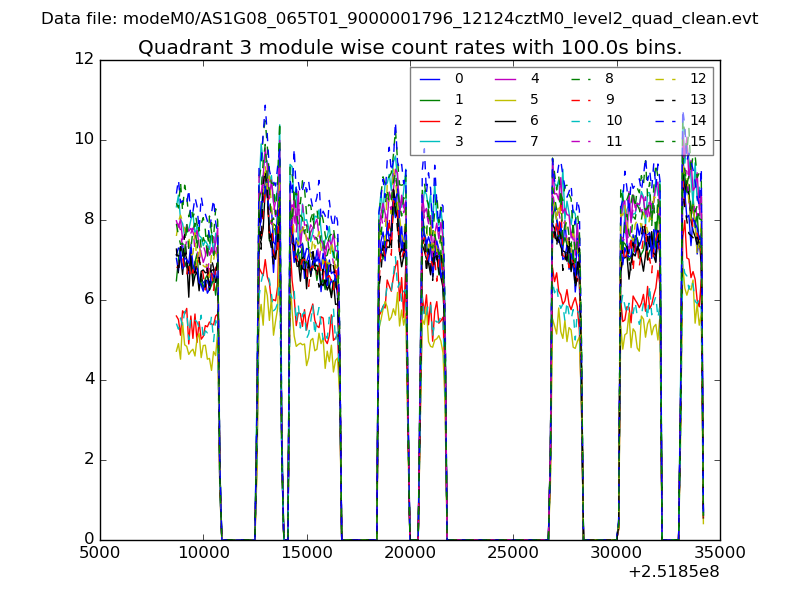
| Module-wise count rates for Quadrant A Data is divided into 100 sec bins |
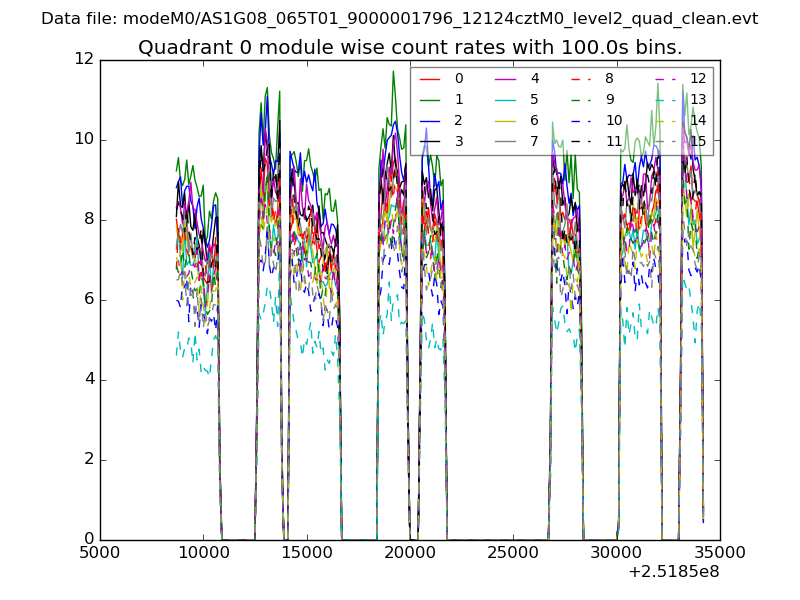 |
 |
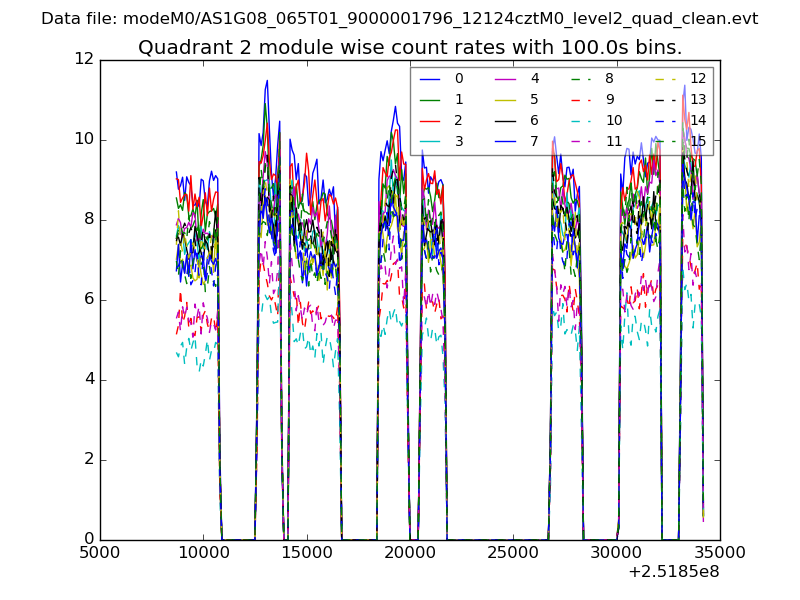
| Module-wise count rates for Quadrant B Data is divided into 100 sec bins |
 |
 |
| Module-wise count rates for Quadrant C Data is divided into 100 sec bins |
 |
 |
| Module-wise count rates for Quadrant D Data is divided into 100 sec bins |
 |
 |
| Parameter | Plot |
|---|---|
| CZT HV Monitor | 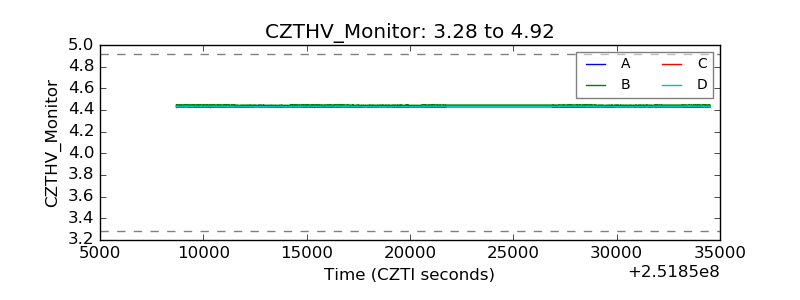 |
| D_VDD | 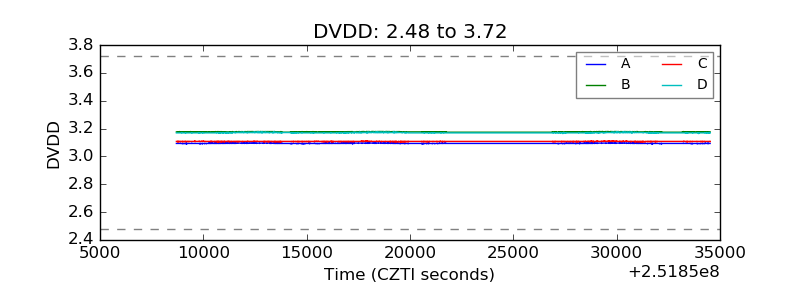 |
| Temperature 1 |  |
| Veto HV Monitor | 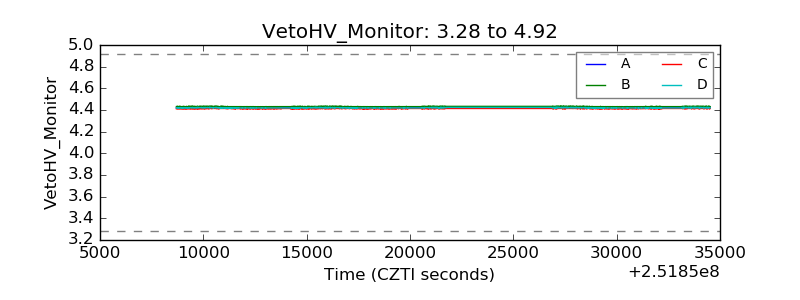 |
| Veto LLD | 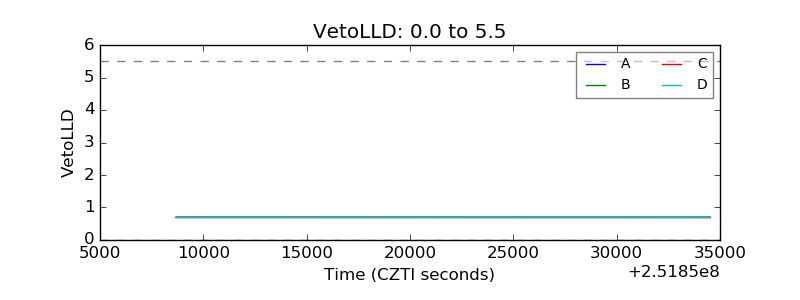 |
| Alpha Counter | 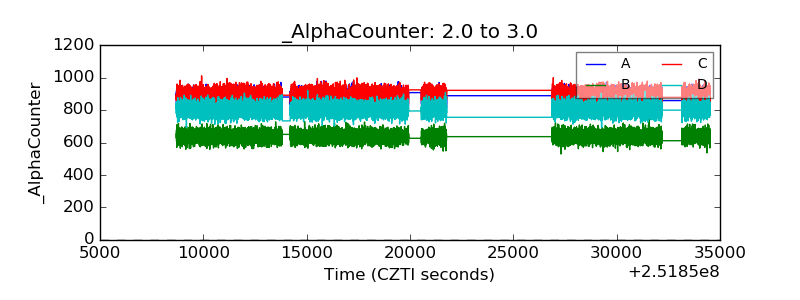 |
| _CPM_Rate | 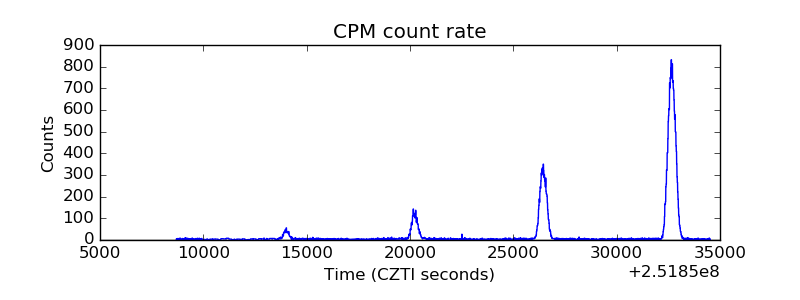 |
| CZT Counter |  |
| +2.5 Volts monitor |  |
| +5 Volts monitor |  |
| _ROLL_ROT | 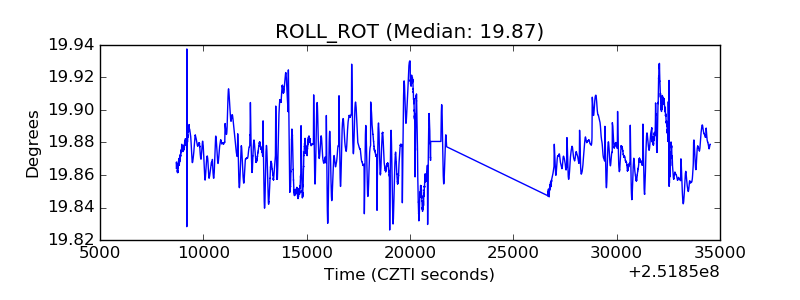 |
| _Roll_DEC | 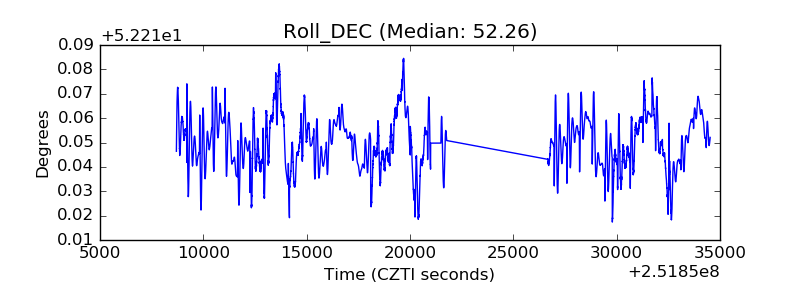 |
| _Roll_RA | 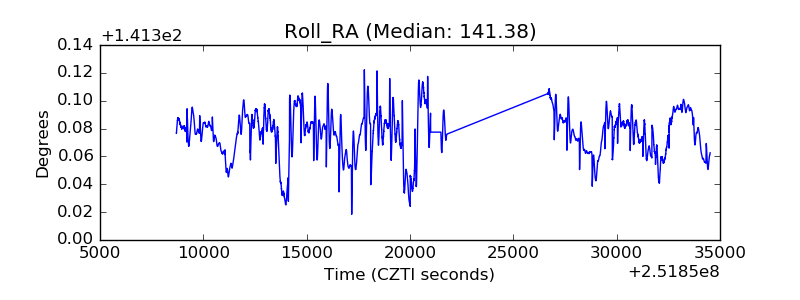 |
| Veto Counter | 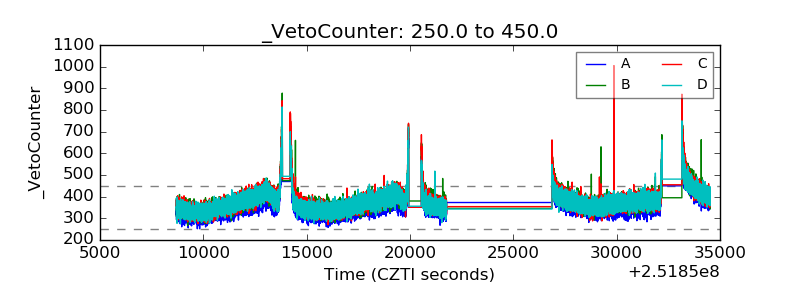 |