| Param | Original file | Final file |
|---|---|---|
| Filename | modeM0/AS1G08_065T01_9000001796_12127cztM0_level2.evt | modeM0/AS1G08_065T01_9000001796_12127cztM0_level2_quad_clean.evt |
| Size (bytes) | 4,148,608,320 | 678,075,840 |
| Size | 3.9 GB | 646.7 MB |
| Events in quadrant A | 29,959,889 | 4,289,576 |
| Events in quadrant B | 35,563,191 | 4,234,221 |
| Events in quadrant C | 24,125,767 | 4,282,054 |
| Events in quadrant D | 32,436,534 | 4,109,817 |
| Mode M0 | |||
|---|---|---|---|
| Quadrant | BADHDUFLAG | Total packets | Discarded packets |
| A | 0 | 125557 | 11 |
| B | 0 | 140836 | 10 |
| C | 0 | 108871 | 10 |
| D | 0 | 131386 | 10 |
| Mode M9 | |||
|---|---|---|---|
| Quadrant | BADHDUFLAG | Total packets | Discarded packets |
| A | 0 | 71 | 0 |
| B | 0 | 71 | 0 |
| C | 0 | 71 | 0 |
| D | 0 | 71 | 0 |
| Mode SS | |||
|---|---|---|---|
| Quadrant | BADHDUFLAG | Total packets | Discarded packets |
| A | 0 | 1070 | 0 |
| B | 0 | 1070 | 0 |
| C | 0 | 1070 | 0 |
| D | 0 | 1070 | 0 |
| Quadrant | Total seconds | Saturated seconds | Saturation percentage |
|---|---|---|---|
| A | 52806 | 1316 | 2.492141% |
| B | 52806 | 2641 | 5.001326% |
| C | 52806 | 301 | 0.570011% |
| D | 52806 | 1212 | 2.295194% |
Noise dominated data is calculated using 1-second bins in cleaned event files. If a bin has >2000 counts, and if more than 50% of those come from <1% of pixels, then it is considered to be noise-dominated and hence unusable.
| Quadrant | # 1 sec bins | Bins with >0 counts | Bins with >2000 counts | High rate bins dominated by noise | Noise dominated (total time) | Noise dominated (detector-on time) | Marked lightcurve |
|---|---|---|---|---|---|---|---|
| A | 59597 | 52813 | 443 | 443 | 0.74% | 0.84% | 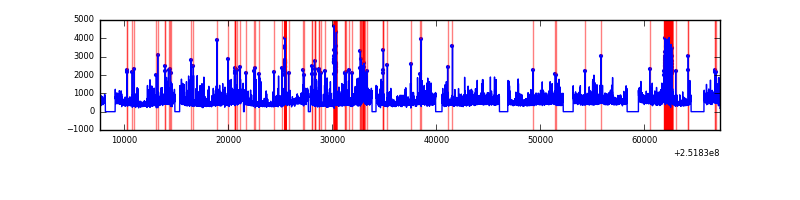 |
| B | 59597 | 52816 | 1199 | 1199 | 2.01% | 2.27% | 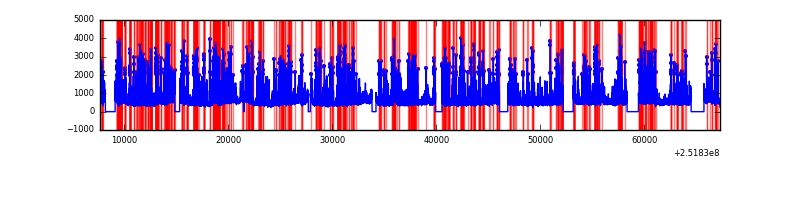 |
| C | 59597 | 52817 | 20 | 20 | 0.03% | 0.04% | 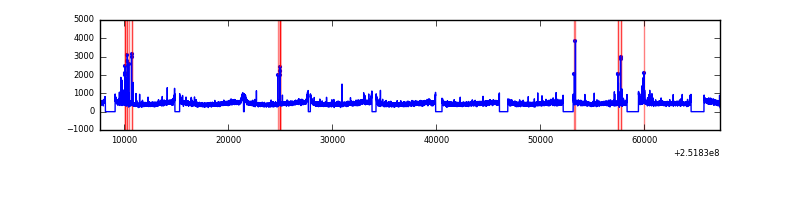 |
| D | 59597 | 52817 | 690 | 690 | 1.16% | 1.31% | 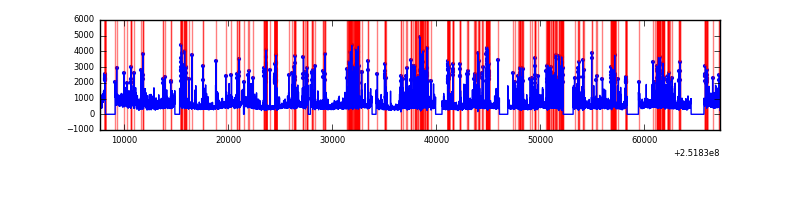 |
Top three noisy pixels from each quadrant. If the there are fewer than three noisy pixels in the level2.evt file, extra rows are filled as -1
| Pixel properties | Quadrant properties | ||||||
|---|---|---|---|---|---|---|---|
| Quadrant | DetID | PixID | Counts | Sigma | Mean | Median | Sigma |
| A | 14 | 63 | 1678749 | 1322.12 | 6300 | 6158 | 1265.1 |
| A | 13 | 248 | 1534299 | 1207.93 | 6300 | 6158 | 1265.1 |
| A | 1 | 162 | 928183 | 728.82 | 6300 | 6158 | 1265.1 |
| B | 4 | 239 | 7711271 | 6600.4 | 6222 | 6072 | 1167.4 |
| B | 15 | 204 | 867711 | 738.09 | 6222 | 6072 | 1167.4 |
| B | 11 | 51 | 806467 | 685.63 | 6222 | 6072 | 1167.4 |
| C | 15 | 208 | 190135 | 130.42 | 6129 | 6145 | 1410.8 |
| C | 14 | 234 | 49525 | 30.75 | 6129 | 6145 | 1410.8 |
| C | 13 | 61 | 44714 | 27.34 | 6129 | 6145 | 1410.8 |
| D | 1 | 52 | 4567191 | 3121.69 | 6083 | 5911 | 1461.2 |
| D | 8 | 195 | 1807473 | 1232.97 | 6083 | 5911 | 1461.2 |
| D | 13 | 104 | 663040 | 449.73 | 6083 | 5911 | 1461.2 |
Histogram calculated using DETX and DETY for each event in the final _common_clean file
| Quadrant A | 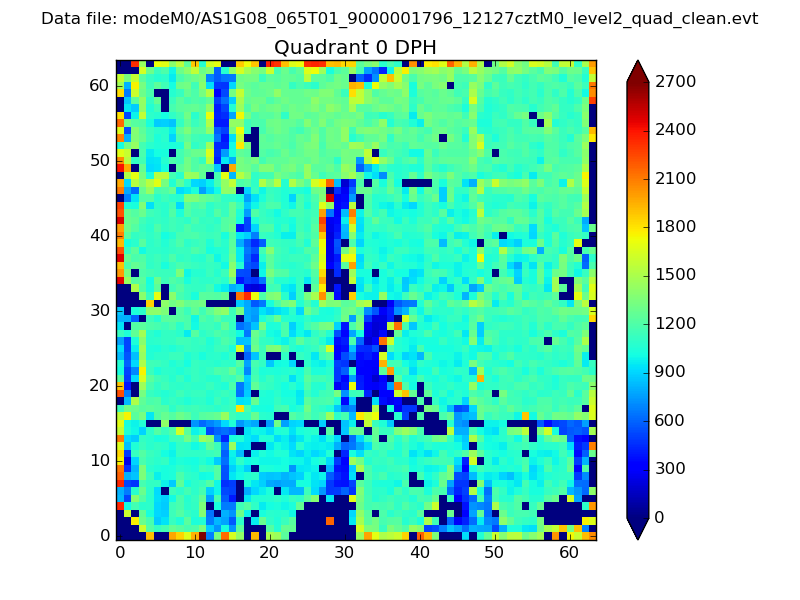 |
 |
Quadrant B |
|---|---|---|---|
| Quadrant D | 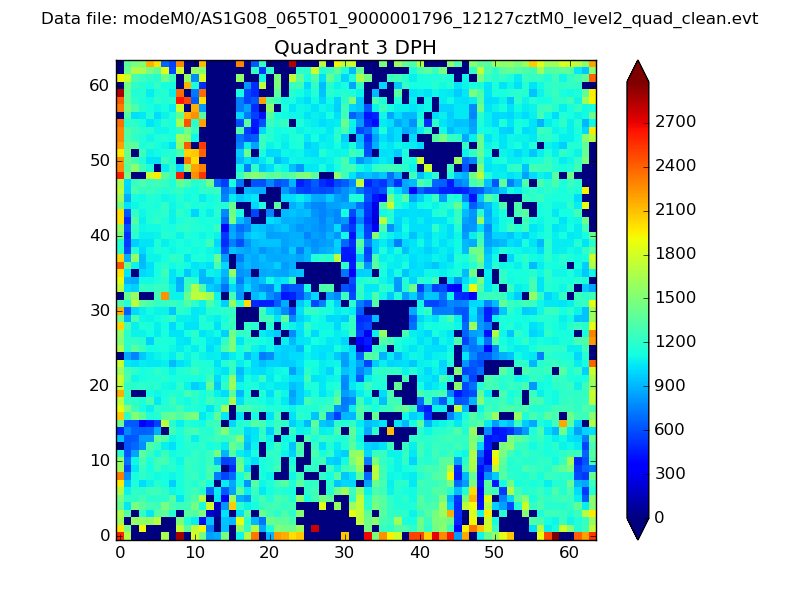 |
 |
Quadrant C |
| Plot type | Count rate plots | Images |
|---|---|---|
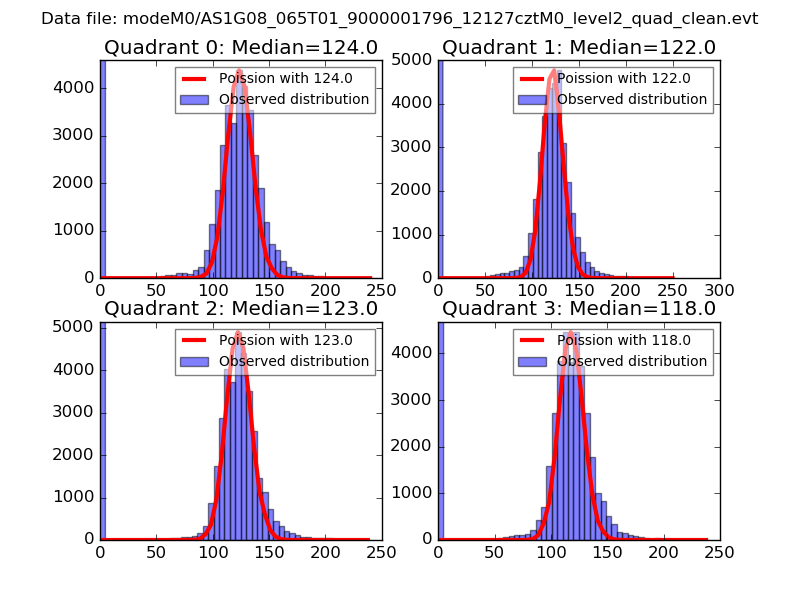
| Comparison with Poisson distribution Blue bars denote a histogram of data divided into 1 sec bins. Red curve is a Poisson curve with rate = median count rate of data. |
 |
 |
| Quadrant-wise count rates Data is divided into 100 sec bins |
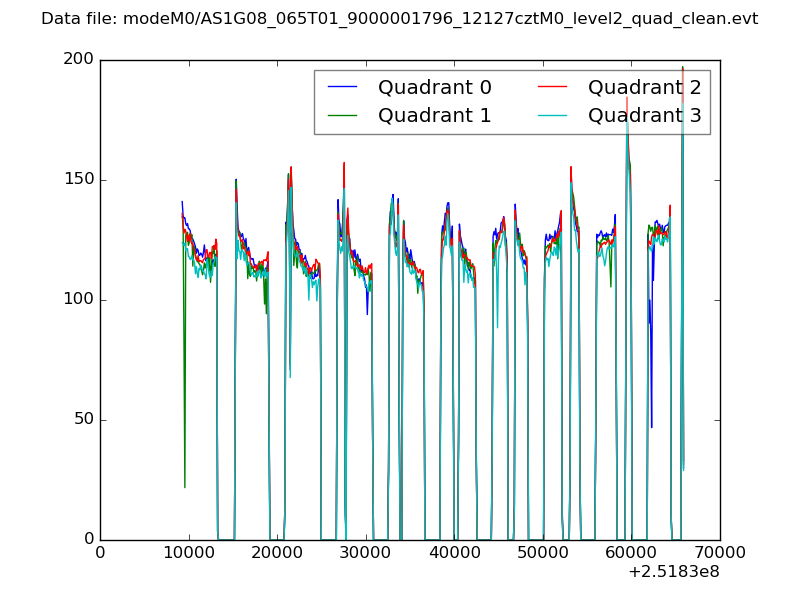 |
|
| Module-wise count rates for Quadrant A Data is divided into 100 sec bins |
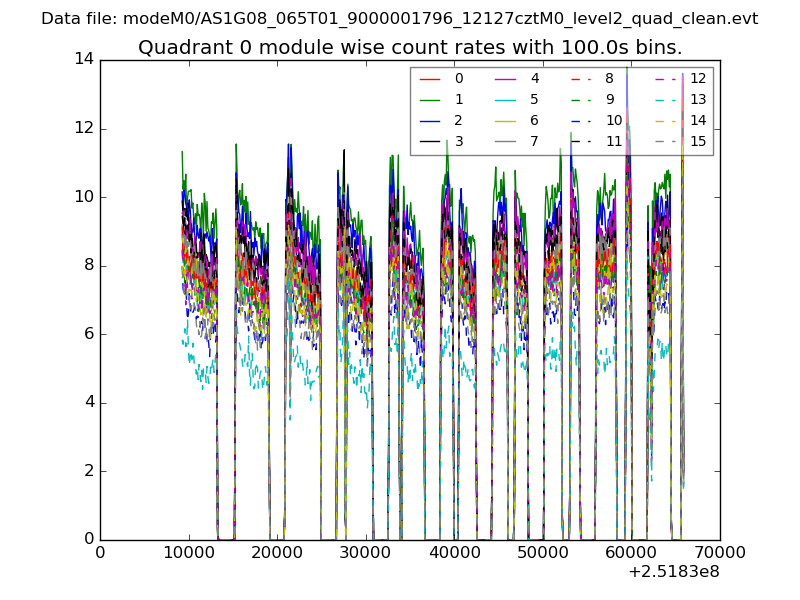 |
 |
| Module-wise count rates for Quadrant B Data is divided into 100 sec bins |
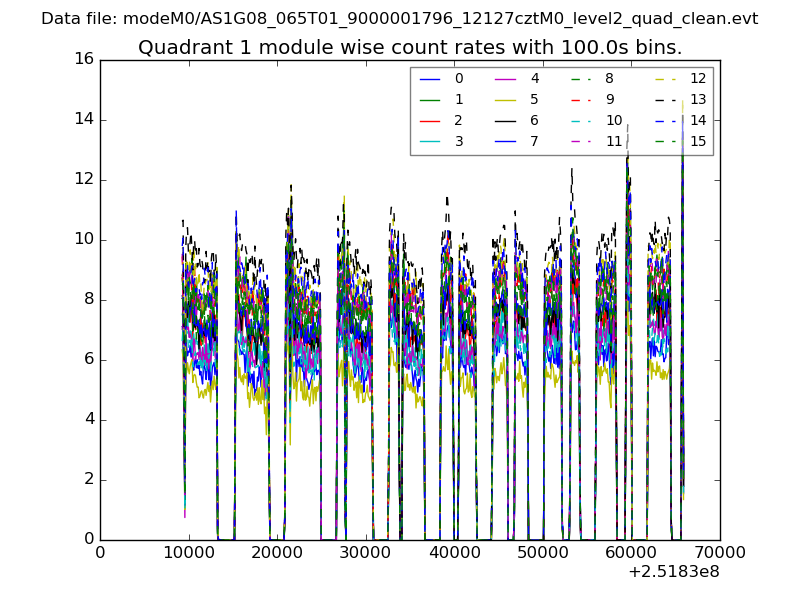 |
 |
| Module-wise count rates for Quadrant C Data is divided into 100 sec bins |
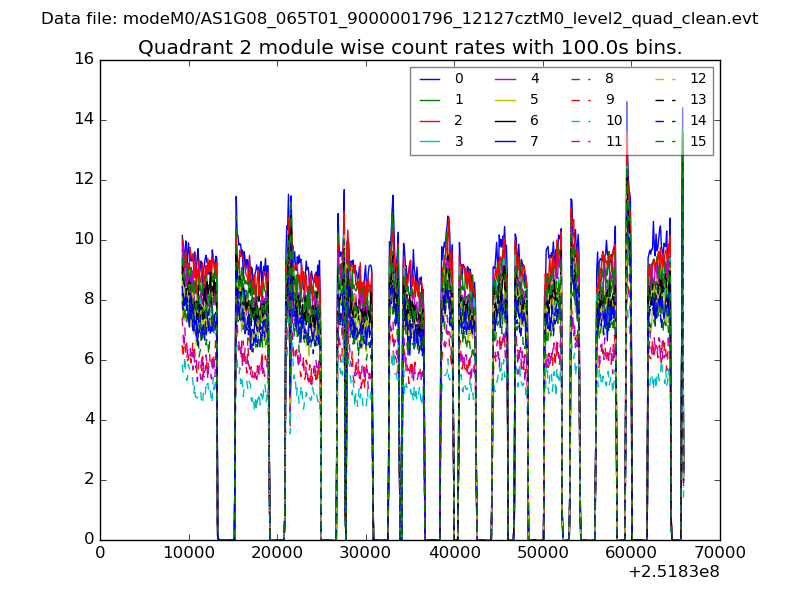 |
 |
| Module-wise count rates for Quadrant D Data is divided into 100 sec bins |
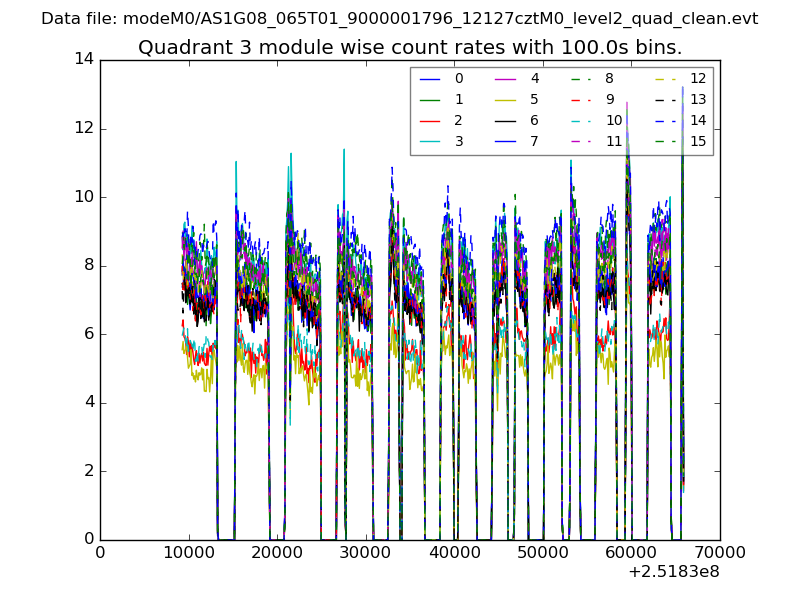 |
 |
| Parameter | Plot |
|---|---|
| CZT HV Monitor | 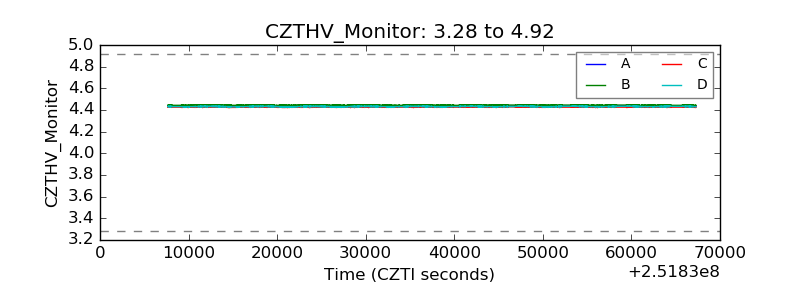 |
| D_VDD | 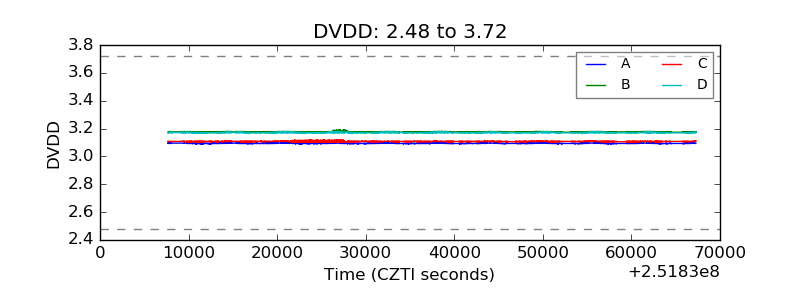 |
| Temperature 1 | 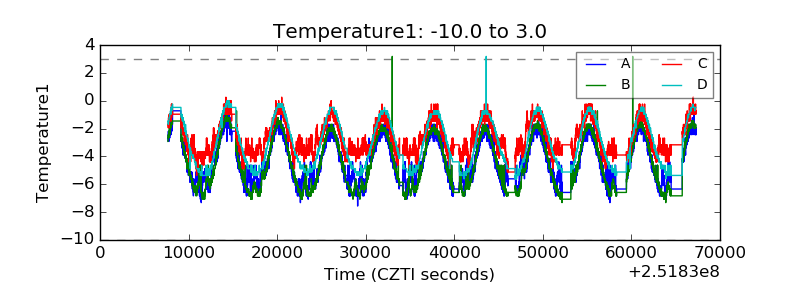 |
| Veto HV Monitor | 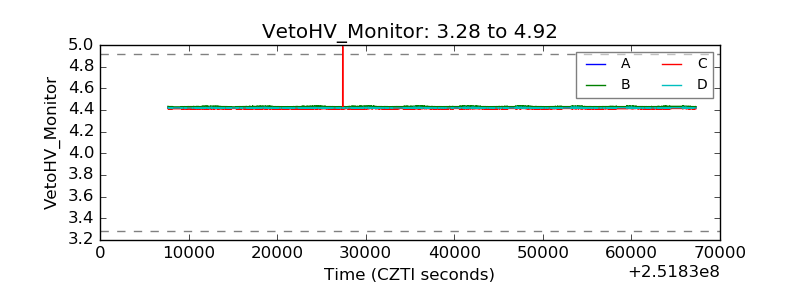 |
| Veto LLD | 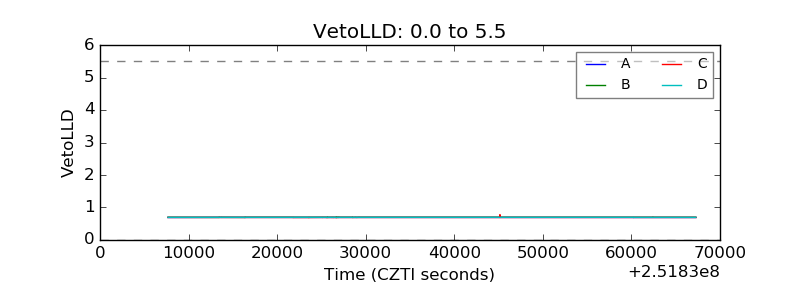 |
| Alpha Counter | 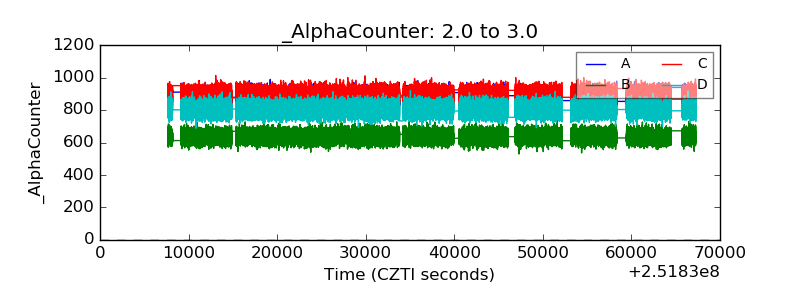 |
| _CPM_Rate | 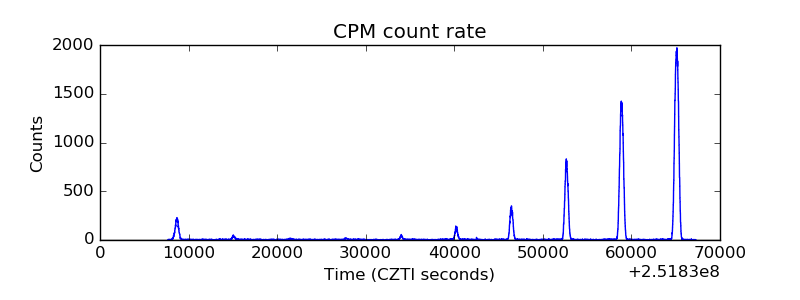 |
| CZT Counter | 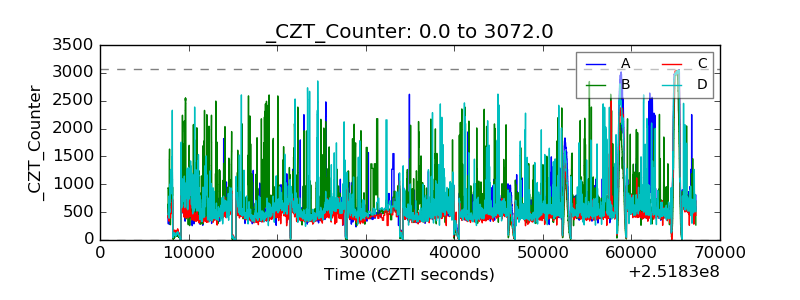 |
| +2.5 Volts monitor |  |
| +5 Volts monitor |  |
| _ROLL_ROT | 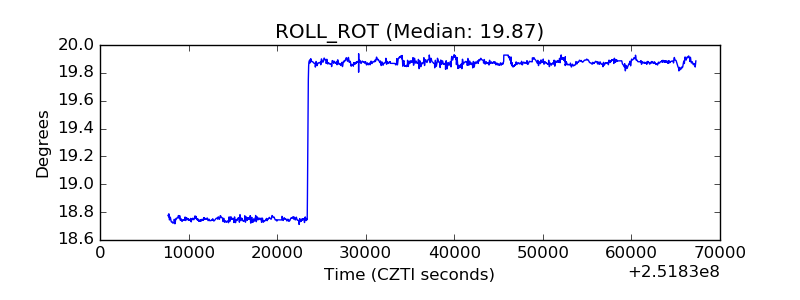 |
| _Roll_DEC | 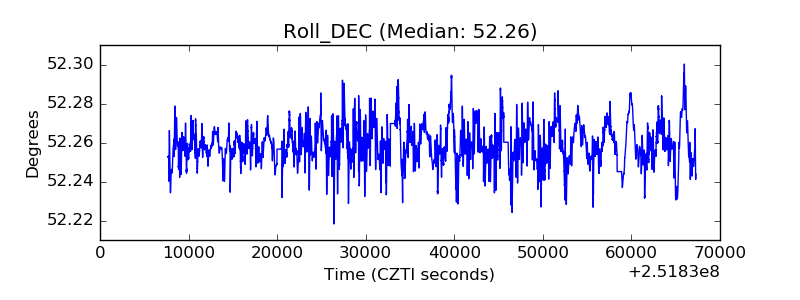 |
| _Roll_RA | 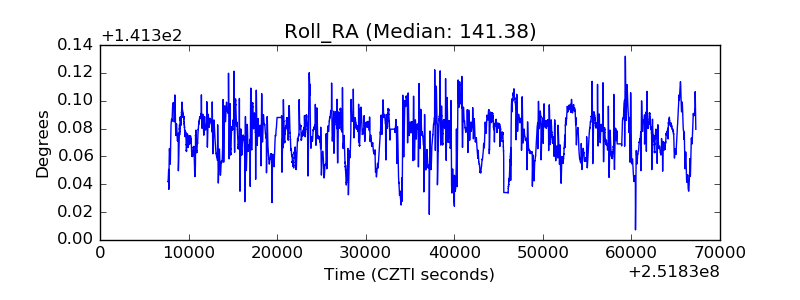 |
| Veto Counter | 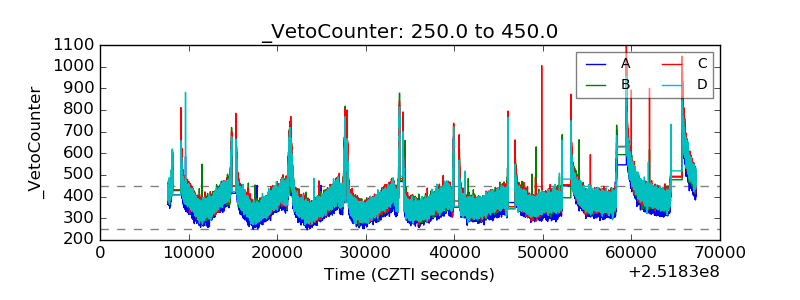 |