| Param | Original file | Final file |
|---|---|---|
| Filename | modeM0/AS1G08_065T01_9000001796_12128cztM0_level2.evt | modeM0/AS1G08_065T01_9000001796_12128cztM0_level2_quad_clean.evt |
| Size (bytes) | 544,481,280 | 70,770,240 |
| Size | 519.3 MB | 67.5 MB |
| Events in quadrant A | 4,130,161 | 433,950 |
| Events in quadrant B | 4,522,509 | 420,776 |
| Events in quadrant C | 3,298,645 | 424,161 |
| Events in quadrant D | 4,099,711 | 412,054 |
| Mode M0 | |||
|---|---|---|---|
| Quadrant | BADHDUFLAG | Total packets | Discarded packets |
| A | 0 | 16605 | 3 |
| B | 0 | 17891 | 2 |
| C | 0 | 13797 | 2 |
| D | 0 | 16551 | 2 |
| Mode M9 | |||
|---|---|---|---|
| Quadrant | BADHDUFLAG | Total packets | Discarded packets |
| A | 0 | 14 | 0 |
| B | 0 | 14 | 0 |
| C | 0 | 14 | 0 |
| D | 0 | 15 | 0 |
| Mode SS | |||
|---|---|---|---|
| Quadrant | BADHDUFLAG | Total packets | Discarded packets |
| A | 0 | 132 | 0 |
| B | 0 | 132 | 0 |
| C | 0 | 132 | 0 |
| D | 0 | 132 | 0 |
| Quadrant | Total seconds | Saturated seconds | Saturation percentage |
|---|---|---|---|
| A | 6474 | 120 | 1.853568% |
| B | 6474 | 251 | 3.877047% |
| C | 6474 | 48 | 0.741427% |
| D | 6474 | 130 | 2.008032% |
Noise dominated data is calculated using 1-second bins in cleaned event files. If a bin has >2000 counts, and if more than 50% of those come from <1% of pixels, then it is considered to be noise-dominated and hence unusable.
| Quadrant | # 1 sec bins | Bins with >0 counts | Bins with >2000 counts | High rate bins dominated by noise | Noise dominated (total time) | Noise dominated (detector-on time) | Marked lightcurve |
|---|---|---|---|---|---|---|---|
| A | 7780 | 6476 | 16 | 16 | 0.21% | 0.25% | 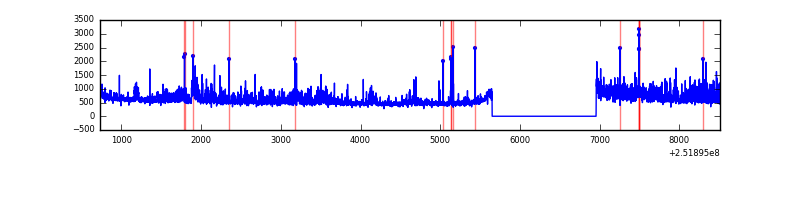 |
| B | 7780 | 6476 | 100 | 100 | 1.29% | 1.54% | 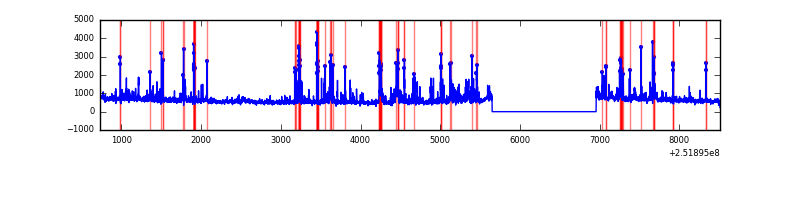 |
| C | 7780 | 6476 | 2 | 2 | 0.03% | 0.03% | 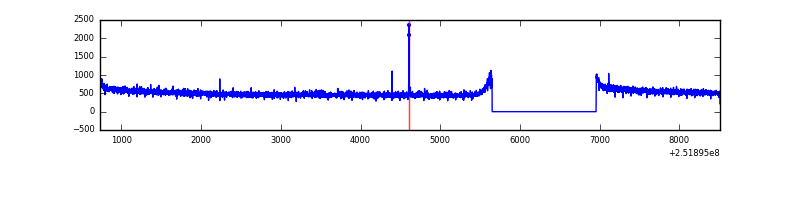 |
| D | 7780 | 6476 | 73 | 73 | 0.94% | 1.13% | 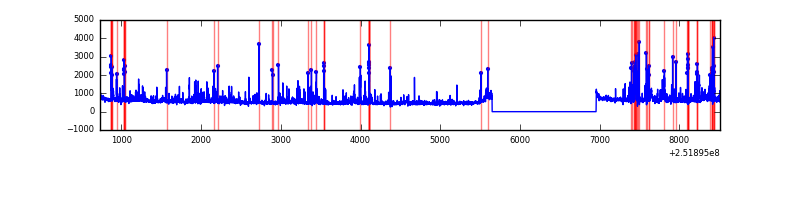 |
Top three noisy pixels from each quadrant. If the there are fewer than three noisy pixels in the level2.evt file, extra rows are filled as -1
| Pixel properties | Quadrant properties | ||||||
|---|---|---|---|---|---|---|---|
| Quadrant | DetID | PixID | Counts | Sigma | Mean | Median | Sigma |
| A | 14 | 63 | 531724 | 3070.45 | 872 | 856 | 172.9 |
| A | 1 | 162 | 83060 | 475.45 | 872 | 856 | 172.9 |
| A | 13 | 248 | 61425 | 350.32 | 872 | 856 | 172.9 |
| B | 4 | 239 | 595554 | 3770.28 | 855 | 837 | 157.7 |
| B | 15 | 201 | 142410 | 897.52 | 855 | 837 | 157.7 |
| B | 15 | 204 | 136003 | 856.9 | 855 | 837 | 157.7 |
| C | 15 | 208 | 12071 | 58.72 | 842 | 849 | 191.1 |
| C | 13 | 61 | 6221 | 28.11 | 842 | 849 | 191.1 |
| C | 14 | 234 | 4177 | 17.41 | 842 | 849 | 191.1 |
| D | 1 | 52 | 427059 | 2132.86 | 843 | 823 | 199.8 |
| D | 10 | 50 | 104424 | 518.41 | 843 | 823 | 199.8 |
| D | 8 | 195 | 92627 | 459.38 | 843 | 823 | 199.8 |
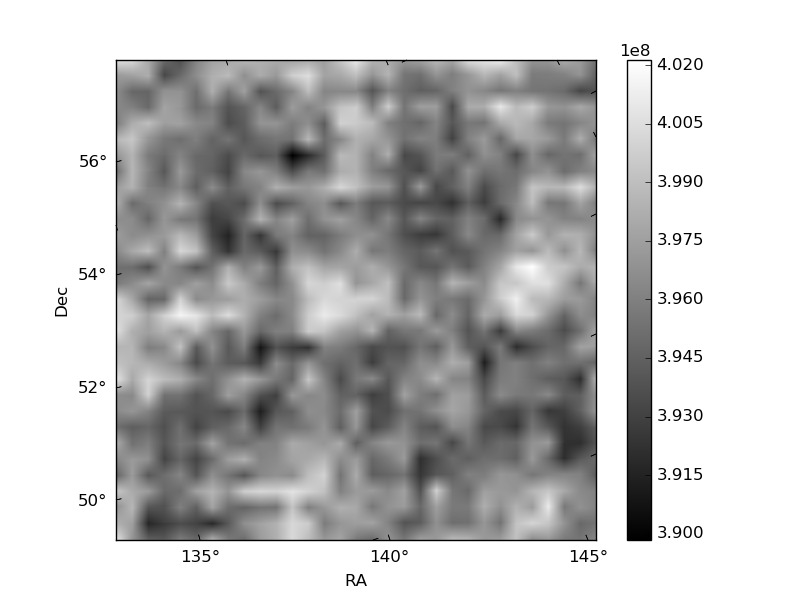
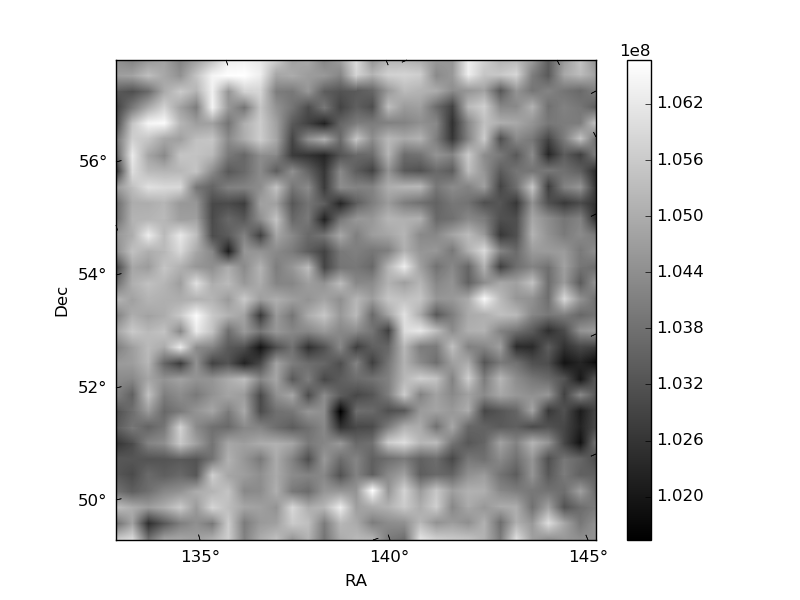
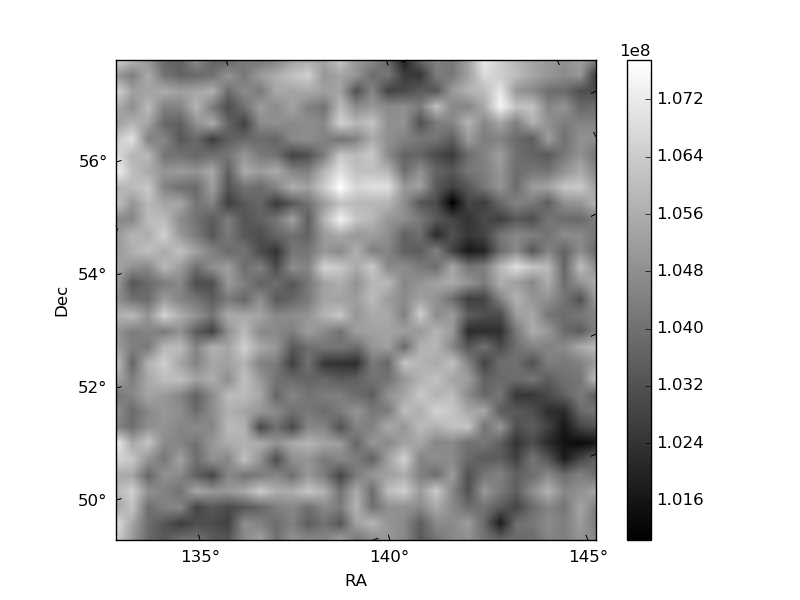
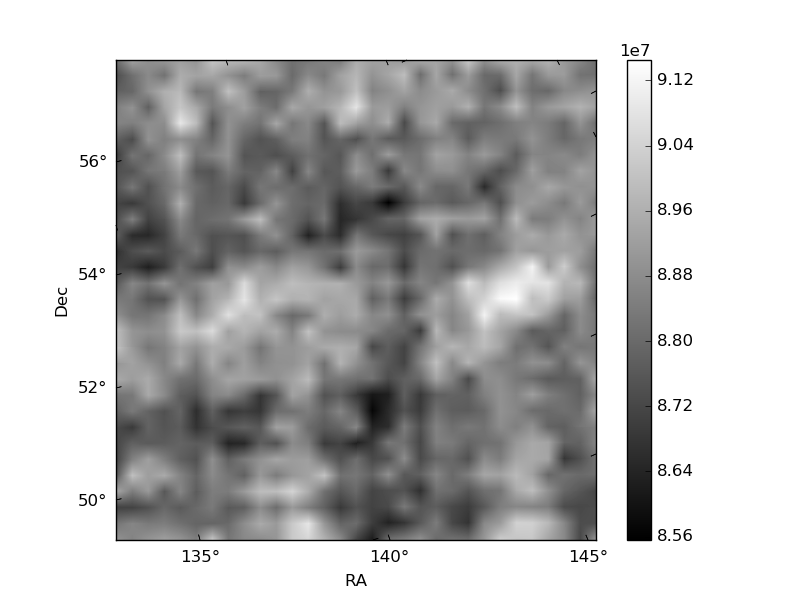
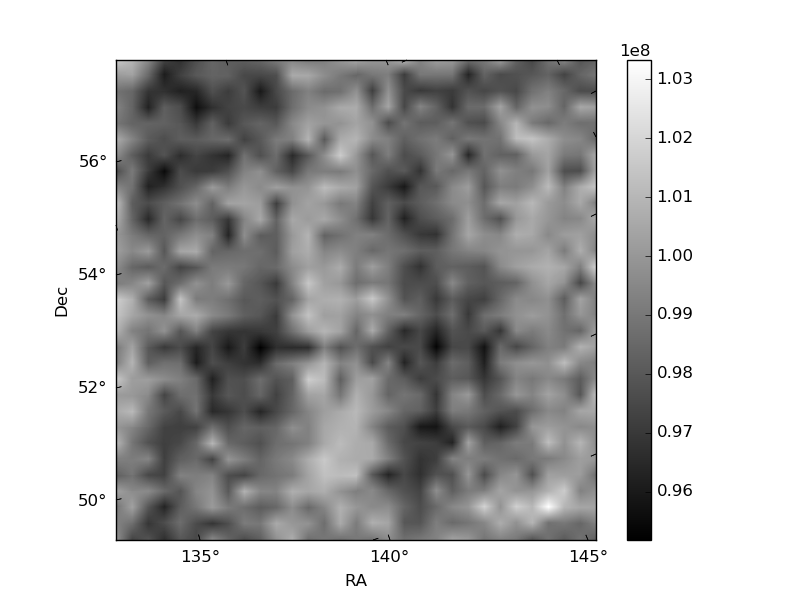
Histogram calculated using DETX and DETY for each event in the final _common_clean file
| Quadrant A | 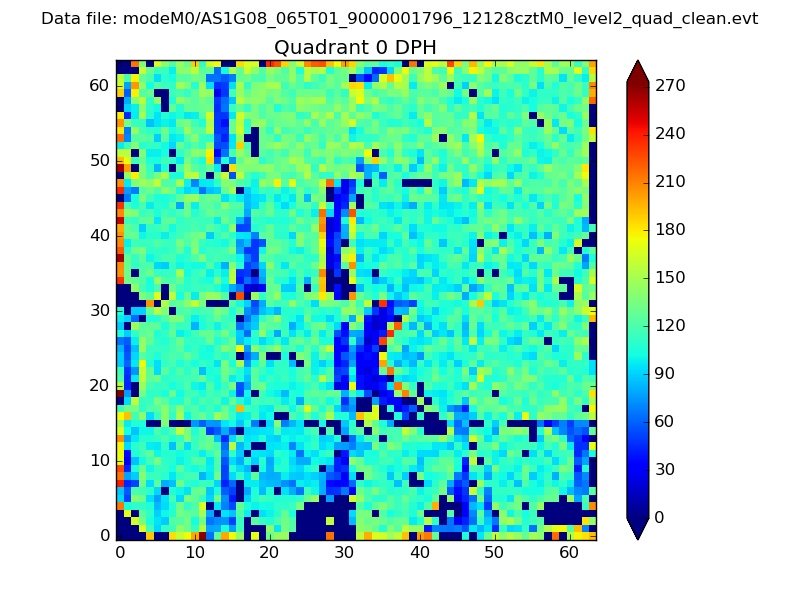 |
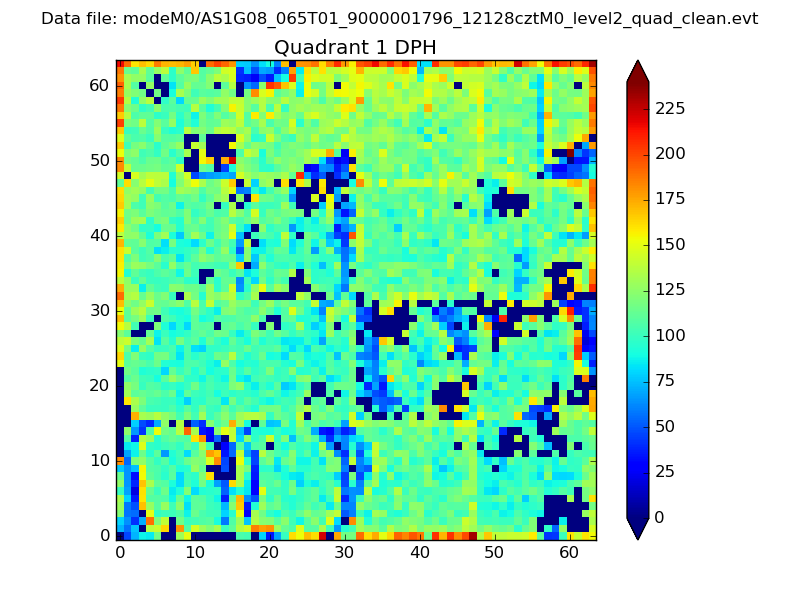 |
Quadrant B |
|---|---|---|---|
| Quadrant D |  |
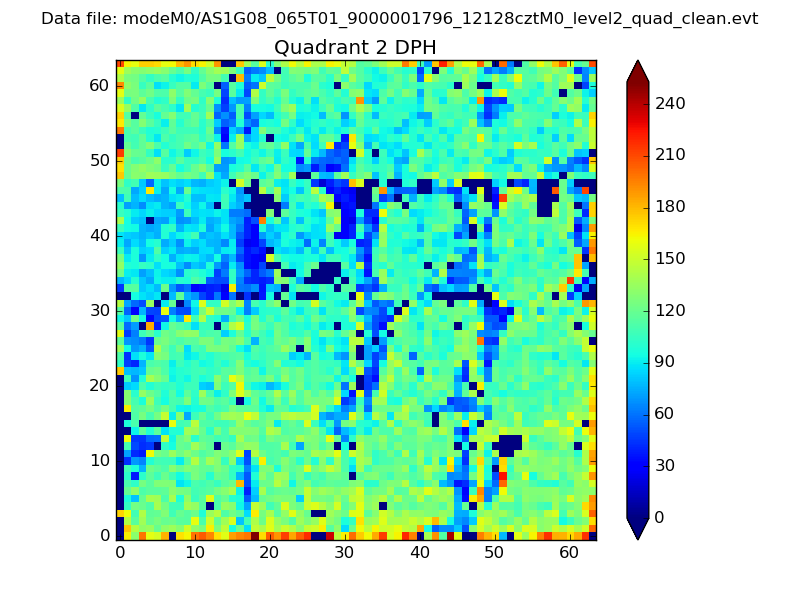 |
Quadrant C |
| Plot type | Count rate plots | Images |
|---|---|---|
| Comparison with Poisson distribution Blue bars denote a histogram of data divided into 1 sec bins. Red curve is a Poisson curve with rate = median count rate of data. |
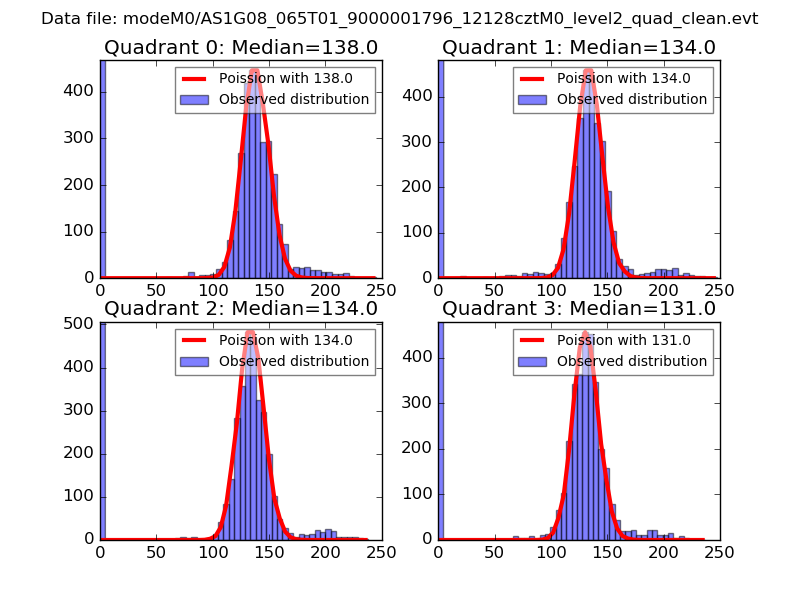 |
 |
| Quadrant-wise count rates Data is divided into 100 sec bins |
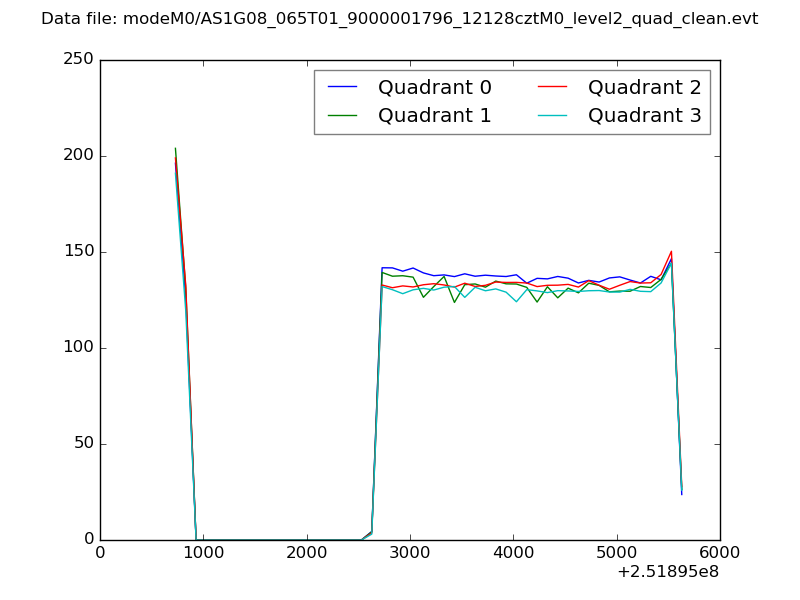 |
|
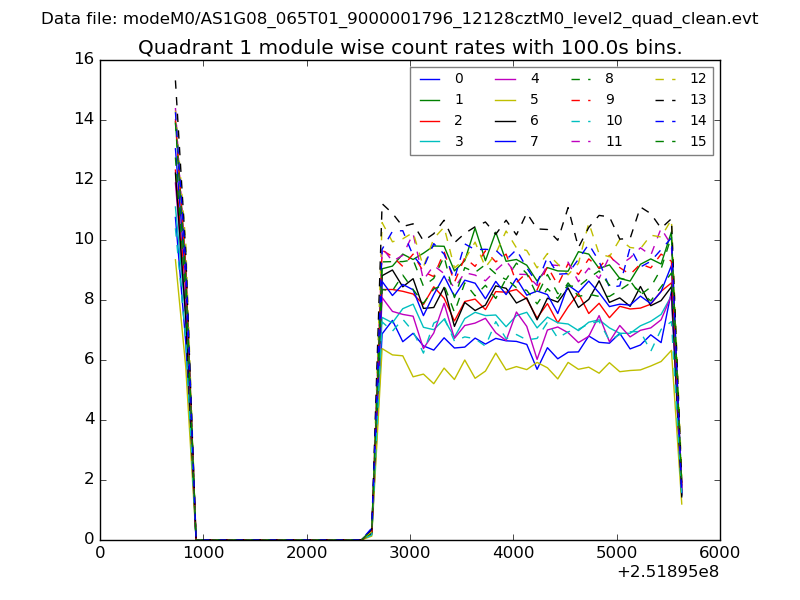
| Module-wise count rates for Quadrant A Data is divided into 100 sec bins |
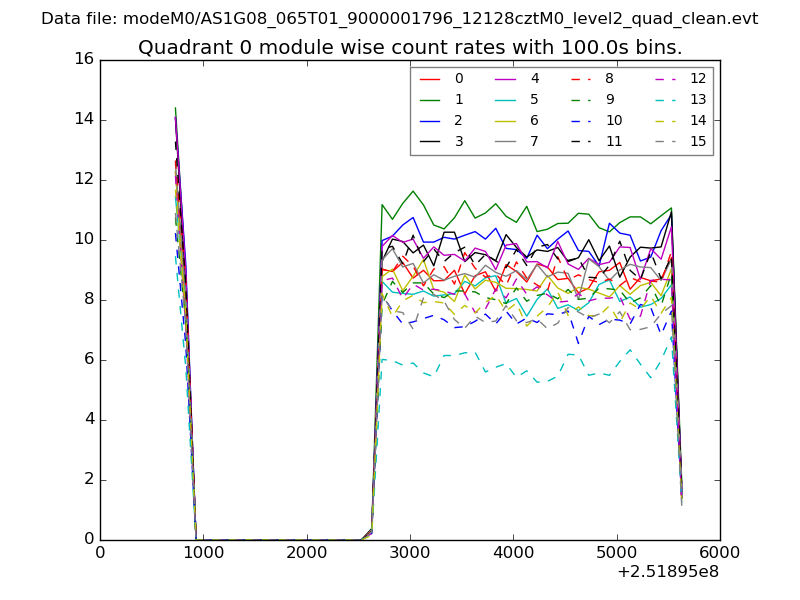 |
 |
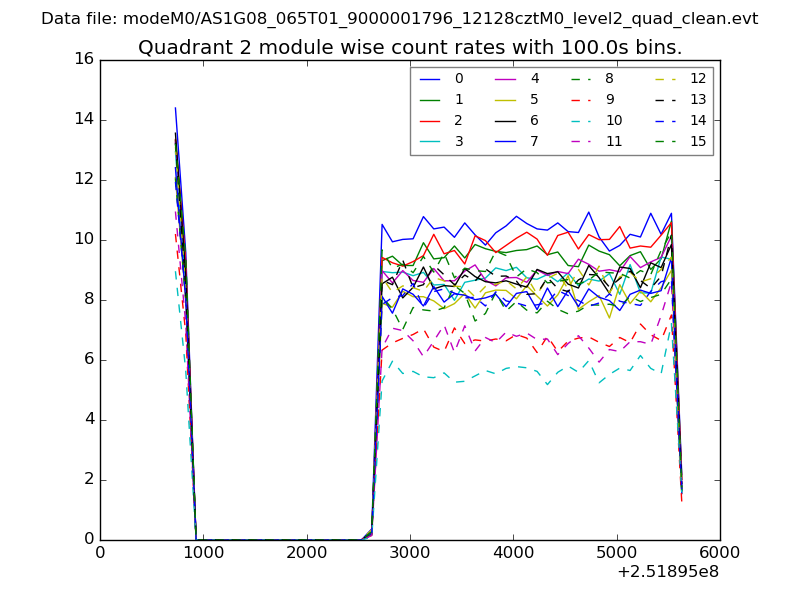
| Module-wise count rates for Quadrant B Data is divided into 100 sec bins |
 |
 |
| Module-wise count rates for Quadrant C Data is divided into 100 sec bins |
 |
 |
| Module-wise count rates for Quadrant D Data is divided into 100 sec bins |
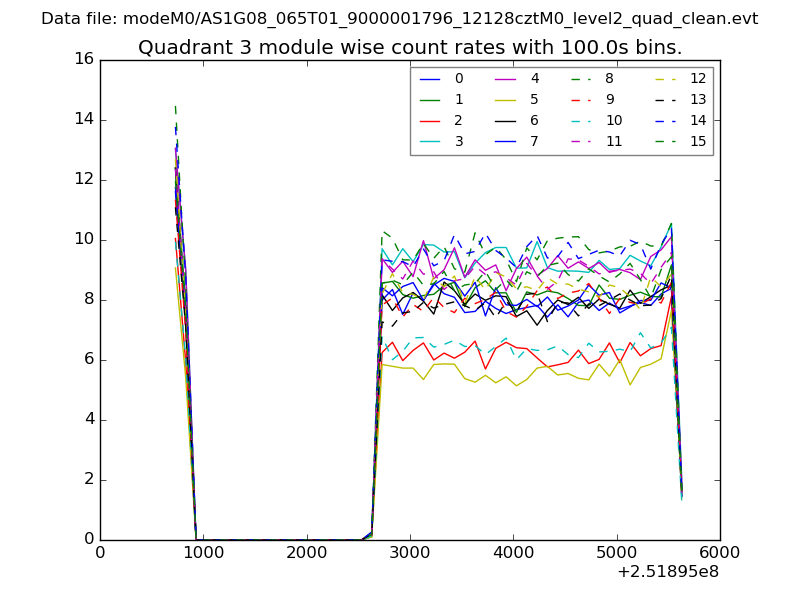 |
 |
| Parameter | Plot |
|---|---|
| CZT HV Monitor | 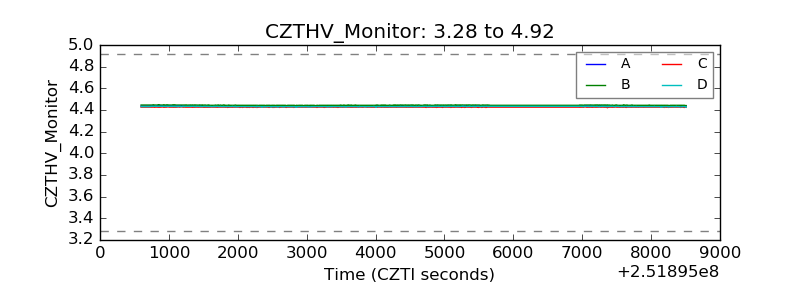 |
| D_VDD | 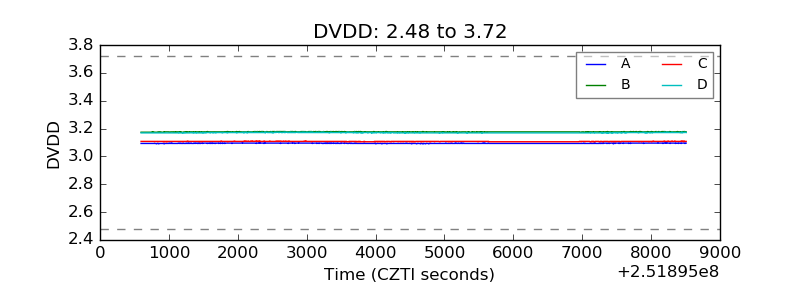 |
| Temperature 1 | 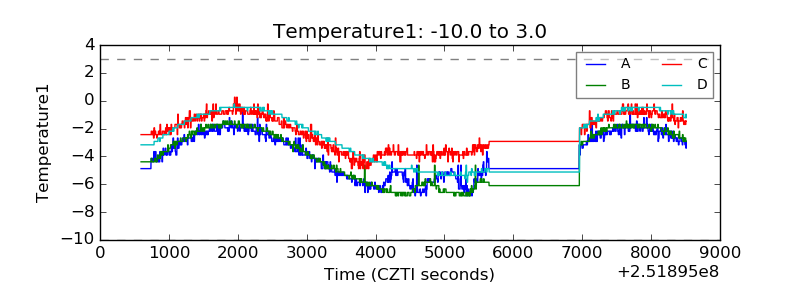 |
| Veto HV Monitor | 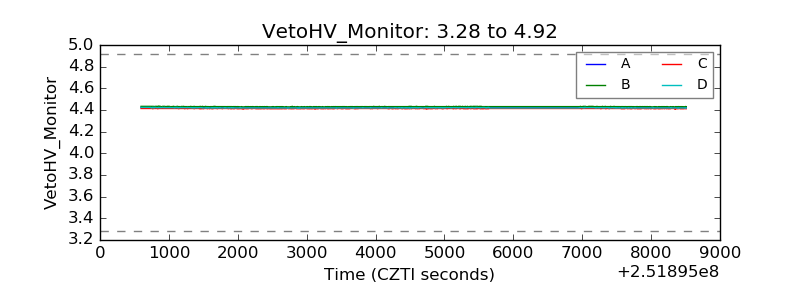 |
| Veto LLD | 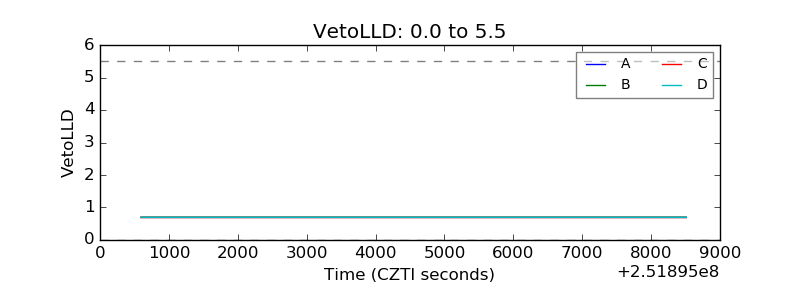 |
| Alpha Counter | 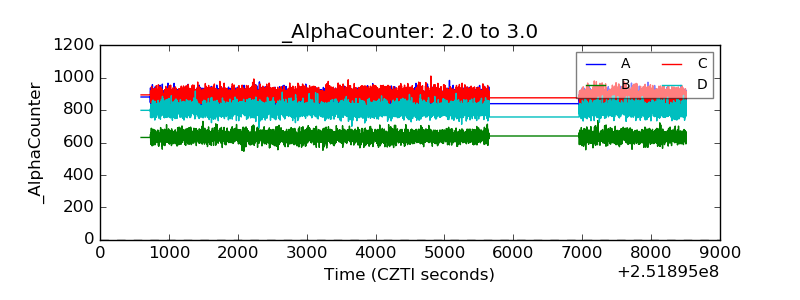 |
| _CPM_Rate | 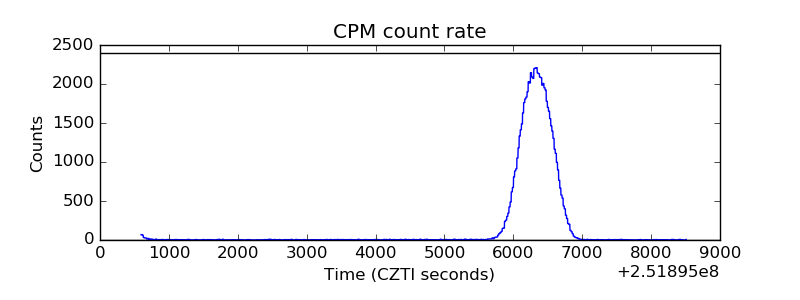 |
| CZT Counter | 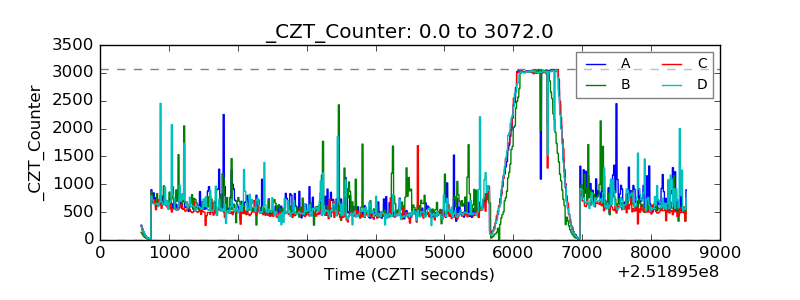 |
| +2.5 Volts monitor | 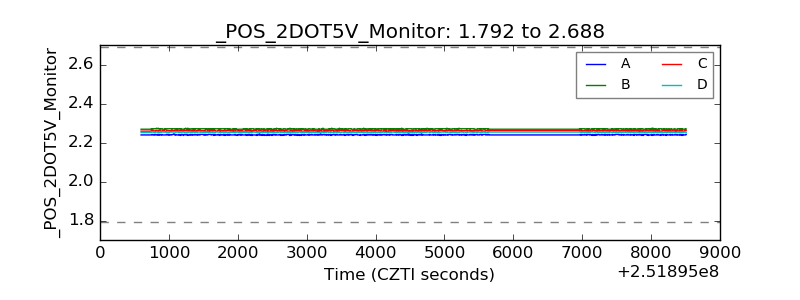 |
| +5 Volts monitor |  |
| _ROLL_ROT | 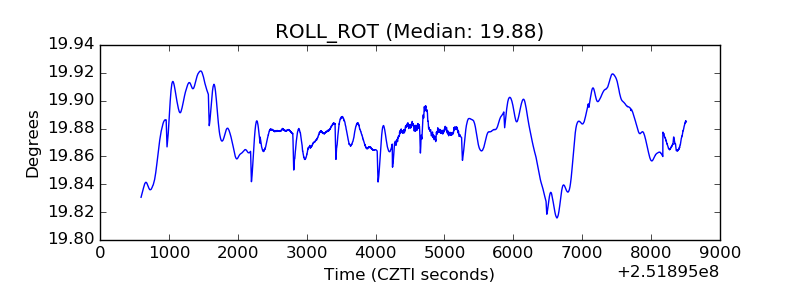 |
| _Roll_DEC | 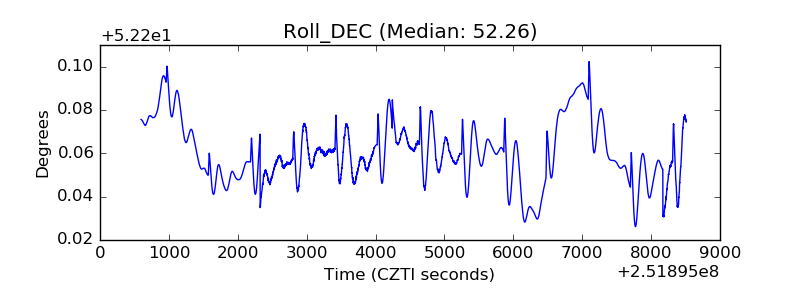 |
| _Roll_RA | 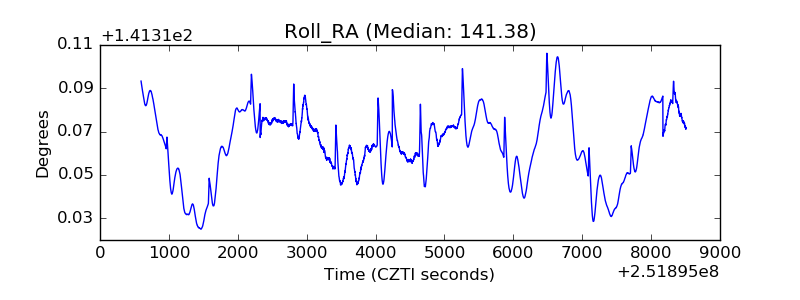 |
| Veto Counter | 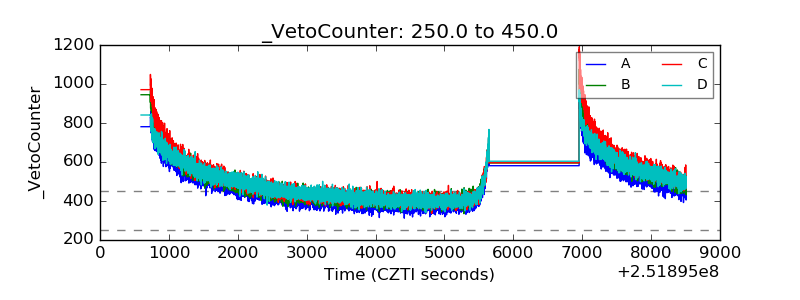 |