| Param | Original file | Final file |
|---|---|---|
| Filename | modeM0/AS1G08_065T01_9000001796_12129cztM0_level2.evt | modeM0/AS1G08_065T01_9000001796_12129cztM0_level2_quad_clean.evt |
| Size (bytes) | 568,710,720 | 77,489,280 |
| Size | 542.4 MB | 73.9 MB |
| Events in quadrant A | 4,444,761 | 496,872 |
| Events in quadrant B | 5,021,102 | 448,990 |
| Events in quadrant C | 3,236,899 | 491,574 |
| Events in quadrant D | 4,095,802 | 470,863 |
| Mode M0 | |||
|---|---|---|---|
| Quadrant | BADHDUFLAG | Total packets | Discarded packets |
| A | 0 | 17533 | 2 |
| B | 0 | 19254 | 1 |
| C | 0 | 13516 | 1 |
| D | 0 | 16469 | 1 |
| Mode M9 | |||
|---|---|---|---|
| Quadrant | BADHDUFLAG | Total packets | Discarded packets |
| A | 0 | 14 | 0 |
| B | 0 | 14 | 0 |
| C | 0 | 14 | 0 |
| D | 0 | 14 | 0 |
| Mode SS | |||
|---|---|---|---|
| Quadrant | BADHDUFLAG | Total packets | Discarded packets |
| A | 0 | 126 | 0 |
| B | 0 | 126 | 0 |
| C | 0 | 126 | 0 |
| D | 0 | 126 | 0 |
| Quadrant | Total seconds | Saturated seconds | Saturation percentage |
|---|---|---|---|
| A | 6278 | 185 | 2.946798% |
| B | 6278 | 682 | 10.863332% |
| C | 6278 | 87 | 1.385792% |
| D | 6278 | 211 | 3.360943% |
Noise dominated data is calculated using 1-second bins in cleaned event files. If a bin has >2000 counts, and if more than 50% of those come from <1% of pixels, then it is considered to be noise-dominated and hence unusable.
| Quadrant | # 1 sec bins | Bins with >0 counts | Bins with >2000 counts | High rate bins dominated by noise | Noise dominated (total time) | Noise dominated (detector-on time) | Marked lightcurve |
|---|---|---|---|---|---|---|---|
| A | 7594 | 6279 | 15 | 15 | 0.20% | 0.24% | 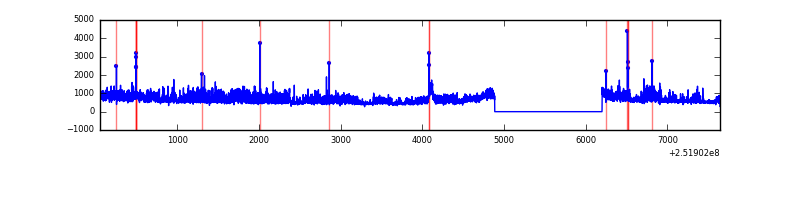 |
| B | 7594 | 6279 | 399 | 399 | 5.25% | 6.35% | 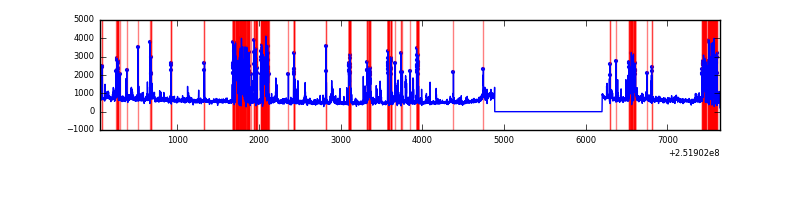 |
| C | 7594 | 6280 | 4 | 4 | 0.05% | 0.06% | 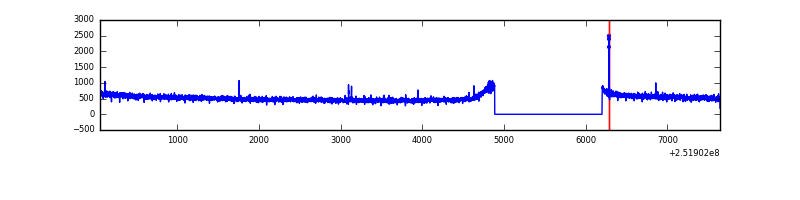 |
| D | 7594 | 6280 | 108 | 108 | 1.42% | 1.72% | 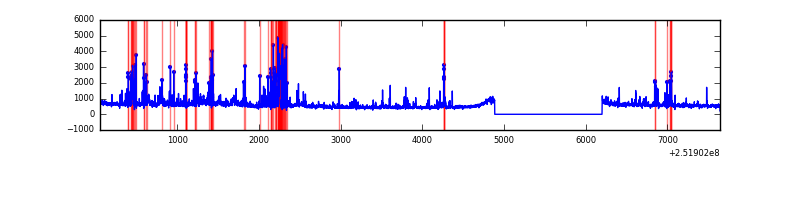 |
Top three noisy pixels from each quadrant. If the there are fewer than three noisy pixels in the level2.evt file, extra rows are filled as -1
| Pixel properties | Quadrant properties | ||||||
|---|---|---|---|---|---|---|---|
| Quadrant | DetID | PixID | Counts | Sigma | Mean | Median | Sigma |
| A | 14 | 63 | 916653 | 5465.48 | 845 | 830 | 167.6 |
| A | 1 | 162 | 94031 | 556.21 | 845 | 830 | 167.6 |
| A | 15 | 249 | 41822 | 244.63 | 845 | 830 | 167.6 |
| B | 4 | 239 | 1405007 | 9525.51 | 801 | 785 | 147.4 |
| B | 15 | 204 | 173738 | 1173.22 | 801 | 785 | 147.4 |
| B | 0 | 85 | 133845 | 902.61 | 801 | 785 | 147.4 |
| C | 14 | 234 | 11800 | 58.58 | 825 | 831 | 187.3 |
| C | 13 | 61 | 6161 | 28.46 | 825 | 831 | 187.3 |
| C | 15 | 208 | 4777 | 21.07 | 825 | 831 | 187.3 |
| D | 1 | 52 | 537997 | 2787.63 | 818 | 796 | 192.7 |
| D | 10 | 50 | 177903 | 919.04 | 818 | 796 | 192.7 |
| D | 8 | 195 | 77471 | 397.88 | 818 | 796 | 192.7 |
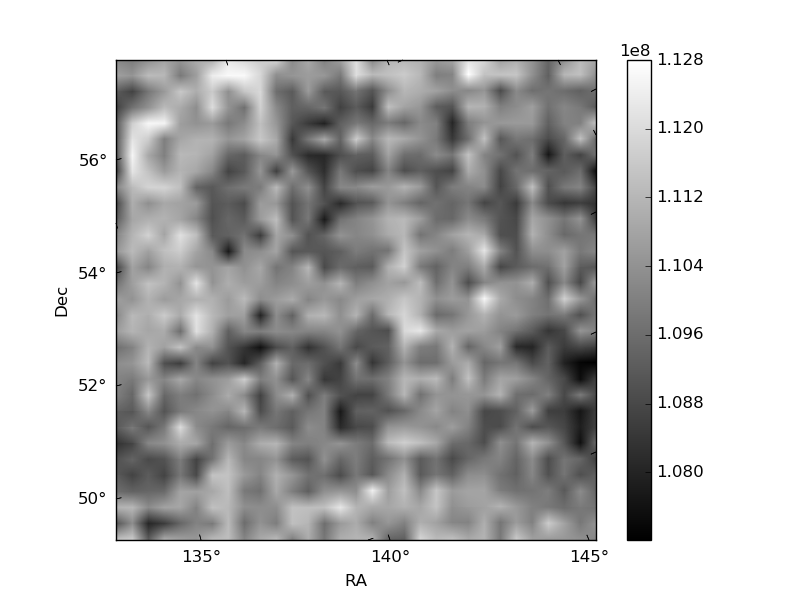
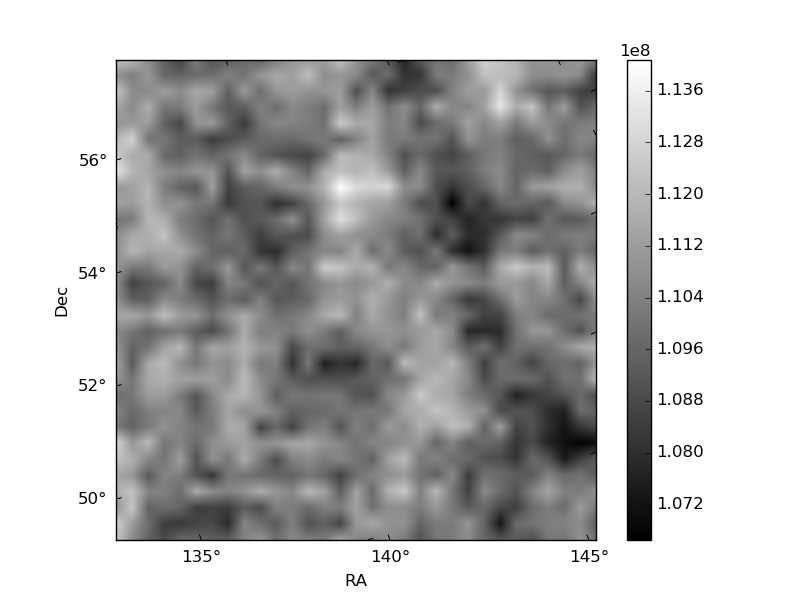
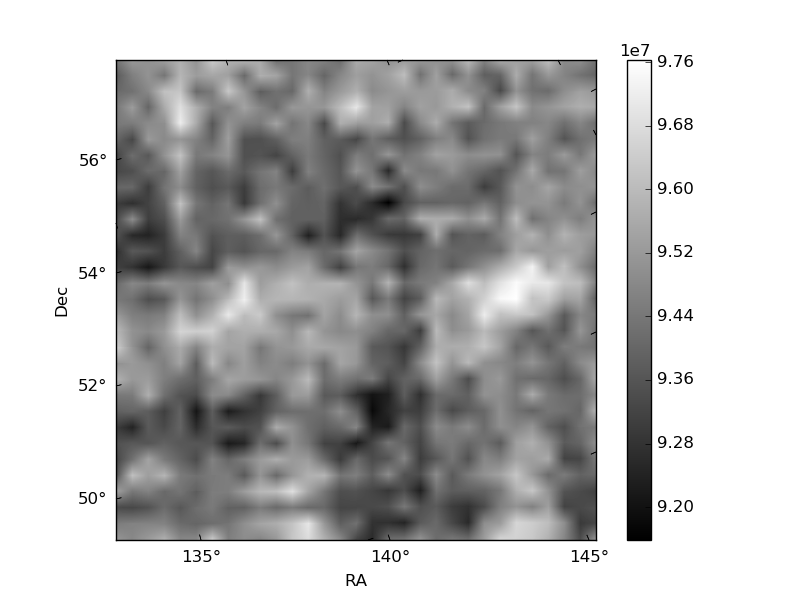
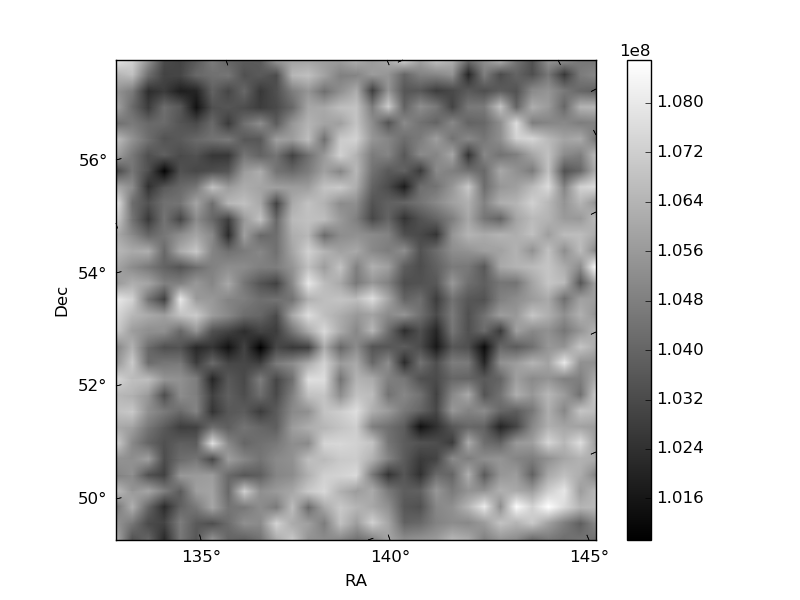
Histogram calculated using DETX and DETY for each event in the final _common_clean file
| Quadrant A | 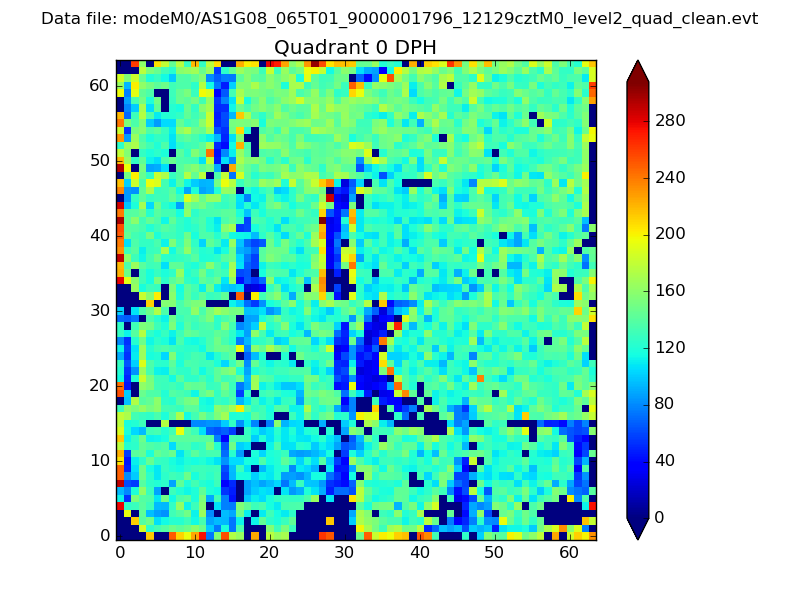 |
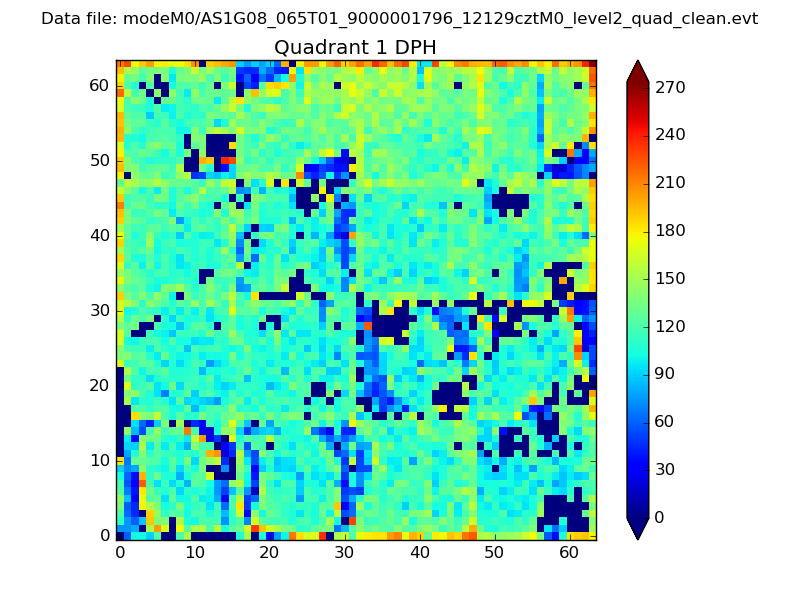 |
Quadrant B |
|---|---|---|---|
| Quadrant D |  |
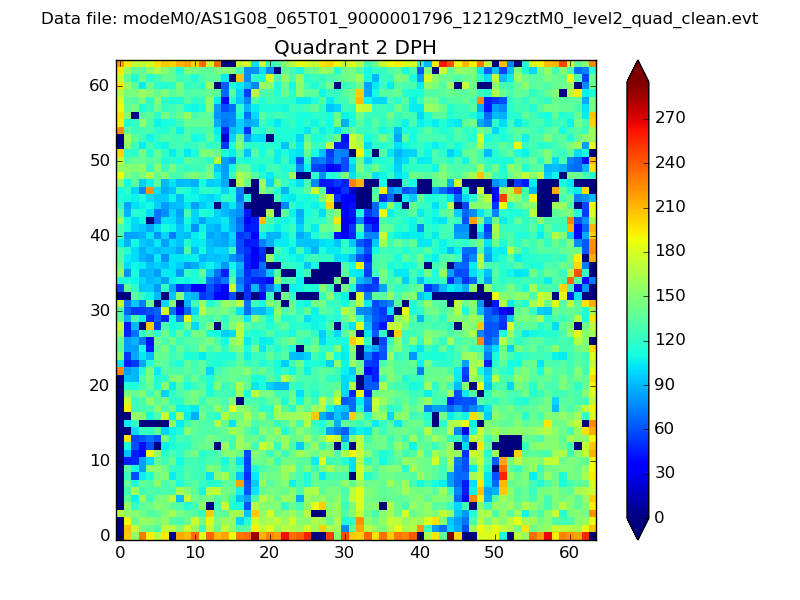 |
Quadrant C |
| Plot type | Count rate plots | Images |
|---|---|---|
| Comparison with Poisson distribution Blue bars denote a histogram of data divided into 1 sec bins. Red curve is a Poisson curve with rate = median count rate of data. |
 |
 |
| Quadrant-wise count rates Data is divided into 100 sec bins |
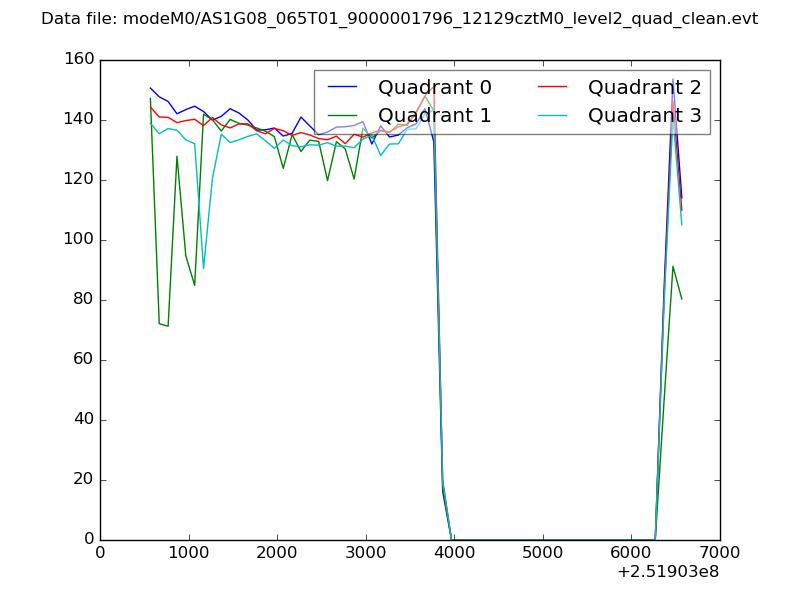 |
|
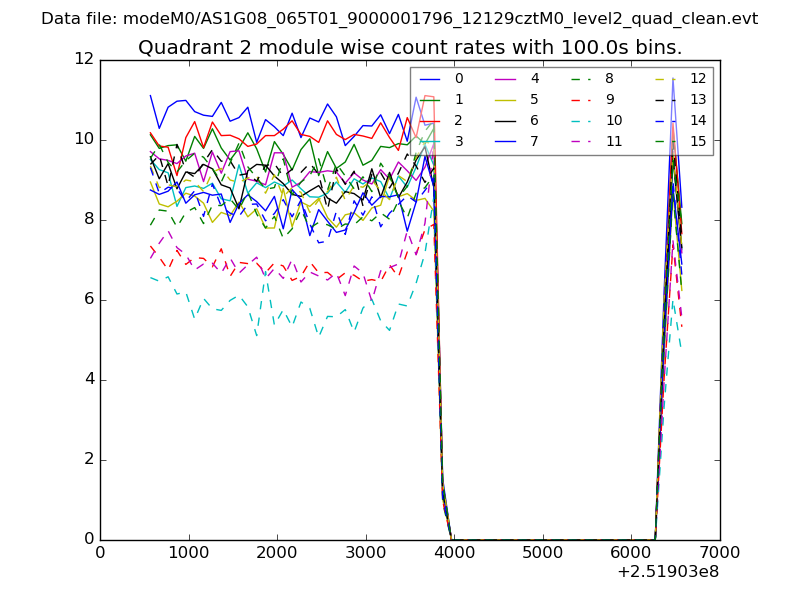
| Module-wise count rates for Quadrant A Data is divided into 100 sec bins |
 |
 |
| Module-wise count rates for Quadrant B Data is divided into 100 sec bins |
 |
 |
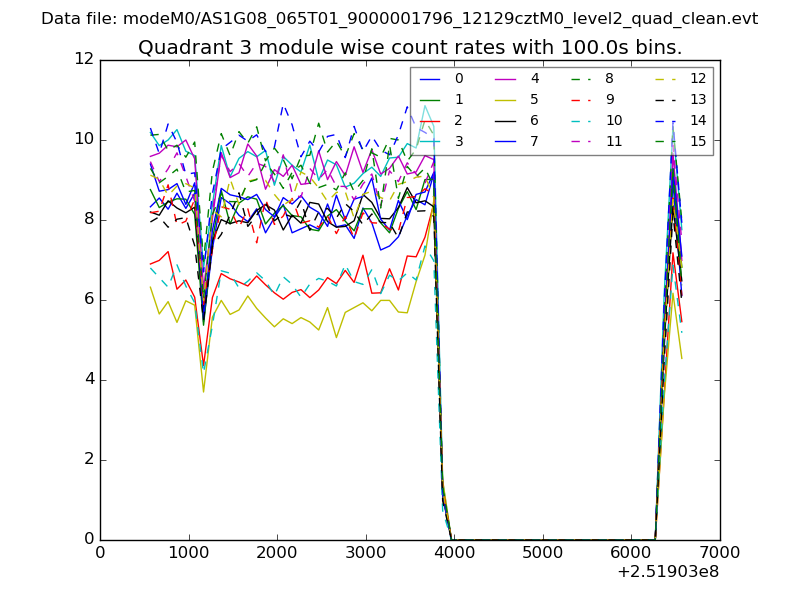
| Module-wise count rates for Quadrant C Data is divided into 100 sec bins |
 |
 |
| Module-wise count rates for Quadrant D Data is divided into 100 sec bins |
 |
 |
| Parameter | Plot |
|---|---|
| CZT HV Monitor |  |
| D_VDD | 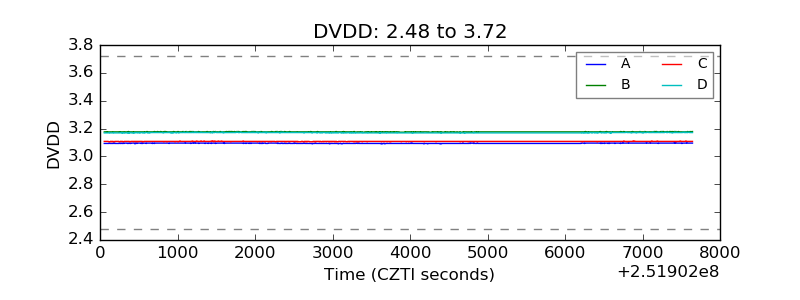 |
| Temperature 1 | 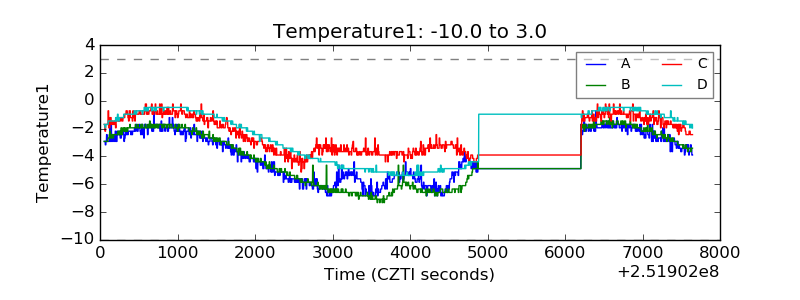 |
| Veto HV Monitor | 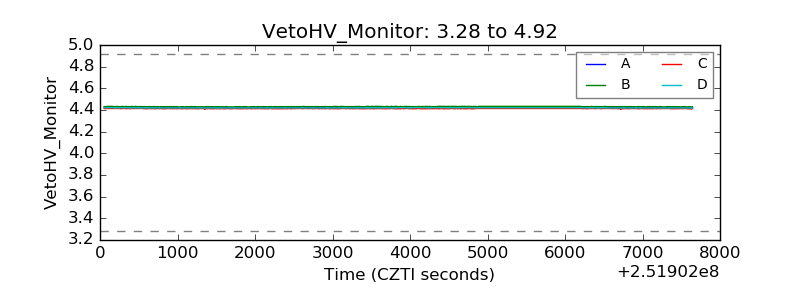 |
| Veto LLD |  |
| Alpha Counter | 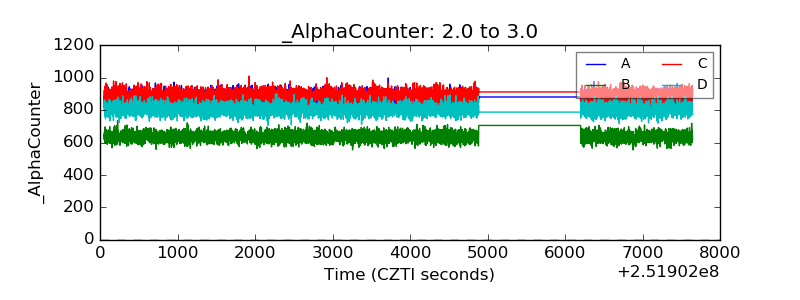 |
| _CPM_Rate | 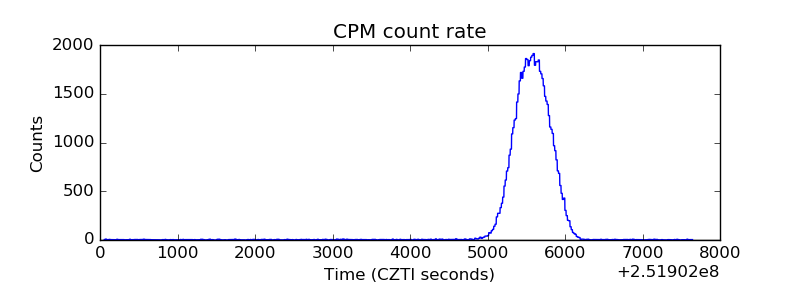 |
| CZT Counter | 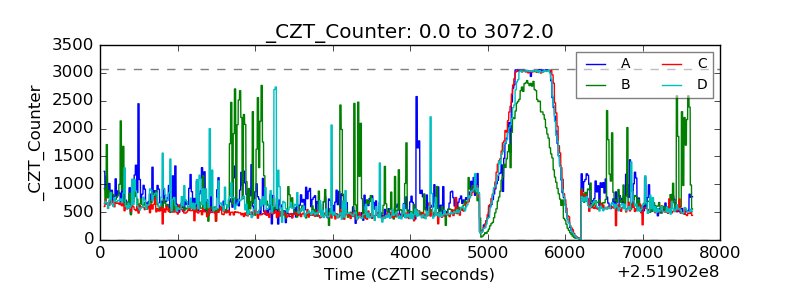 |
| +2.5 Volts monitor |  |
| +5 Volts monitor |  |
| _ROLL_ROT | 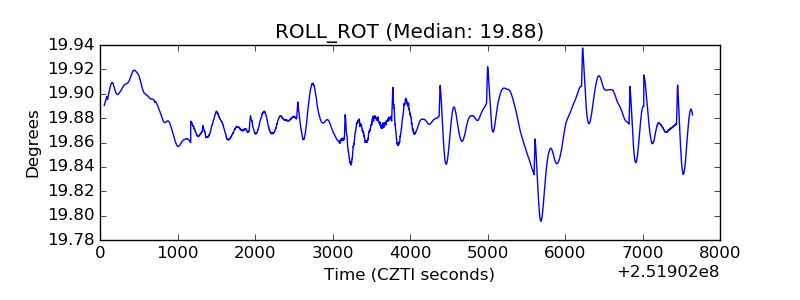 |
| _Roll_DEC | 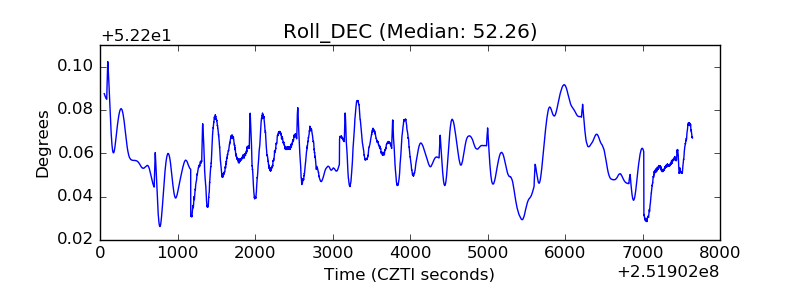 |
| _Roll_RA | 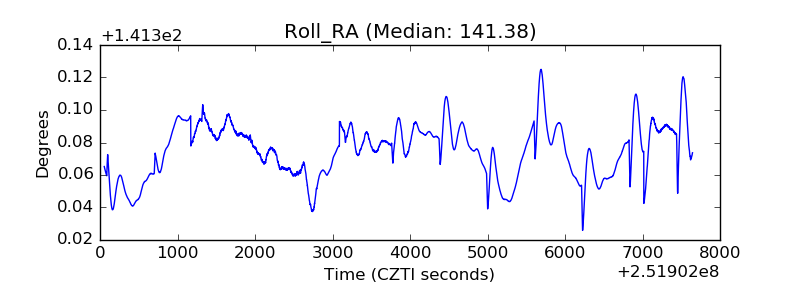 |
| Veto Counter |  |