| Param | Original file | Final file |
|---|---|---|
| Filename | modeM0/AS1G08_065T01_9000001796_12130cztM0_level2.evt | modeM0/AS1G08_065T01_9000001796_12130cztM0_level2_quad_clean.evt |
| Size (bytes) | 571,187,520 | 89,579,520 |
| Size | 544.7 MB | 85.4 MB |
| Events in quadrant A | 4,736,470 | 582,988 |
| Events in quadrant B | 5,078,534 | 539,139 |
| Events in quadrant C | 3,197,269 | 586,436 |
| Events in quadrant D | 3,859,078 | 564,002 |
| Mode M0 | |||
|---|---|---|---|
| Quadrant | BADHDUFLAG | Total packets | Discarded packets |
| A | 0 | 18338 | 3 |
| B | 0 | 19376 | 2 |
| C | 0 | 13491 | 2 |
| D | 0 | 15651 | 2 |
| Mode M9 | |||
|---|---|---|---|
| Quadrant | BADHDUFLAG | Total packets | Discarded packets |
| A | 0 | 23 | 0 |
| B | 0 | 23 | 0 |
| C | 0 | 23 | 0 |
| D | 0 | 24 | 0 |
| Mode SS | |||
|---|---|---|---|
| Quadrant | BADHDUFLAG | Total packets | Discarded packets |
| A | 0 | 126 | 0 |
| B | 0 | 126 | 0 |
| C | 0 | 126 | 0 |
| D | 0 | 126 | 0 |
| Quadrant | Total seconds | Saturated seconds | Saturation percentage |
|---|---|---|---|
| A | 6311 | 414 | 6.559975% |
| B | 6311 | 799 | 12.660434% |
| C | 6311 | 89 | 1.410236% |
| D | 6311 | 169 | 2.677864% |
Noise dominated data is calculated using 1-second bins in cleaned event files. If a bin has >2000 counts, and if more than 50% of those come from <1% of pixels, then it is considered to be noise-dominated and hence unusable.
| Quadrant | # 1 sec bins | Bins with >0 counts | Bins with >2000 counts | High rate bins dominated by noise | Noise dominated (total time) | Noise dominated (detector-on time) | Marked lightcurve |
|---|---|---|---|---|---|---|---|
| A | 7577 | 6313 | 179 | 179 | 2.36% | 2.84% | 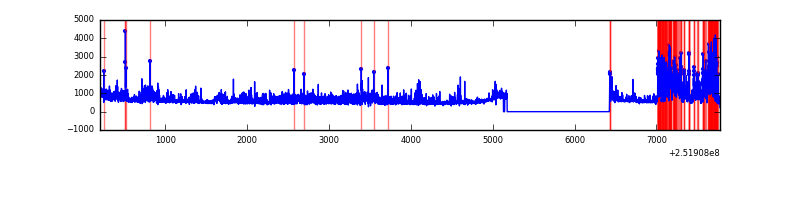 |
| B | 7577 | 6314 | 415 | 415 | 5.48% | 6.57% | 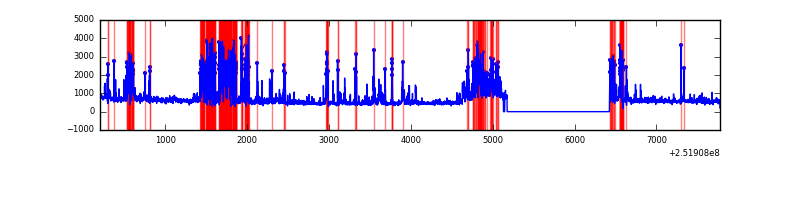 |
| C | 7577 | 6314 | 4 | 4 | 0.05% | 0.06% | 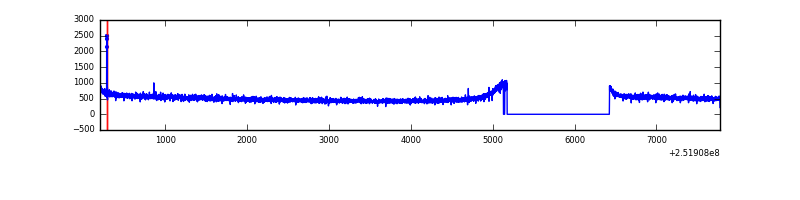 |
| D | 7577 | 6314 | 67 | 67 | 0.88% | 1.06% |  |
Top three noisy pixels from each quadrant. If the there are fewer than three noisy pixels in the level2.evt file, extra rows are filled as -1
| Pixel properties | Quadrant properties | ||||||
|---|---|---|---|---|---|---|---|
| Quadrant | DetID | PixID | Counts | Sigma | Mean | Median | Sigma |
| A | 13 | 248 | 711009 | 4416.44 | 817 | 803 | 160.8 |
| A | 14 | 63 | 548432 | 3405.45 | 817 | 803 | 160.8 |
| A | 1 | 162 | 135602 | 838.25 | 817 | 803 | 160.8 |
| B | 4 | 239 | 1631057 | 11292.31 | 778 | 760 | 144.4 |
| B | 15 | 204 | 150960 | 1040.37 | 778 | 760 | 144.4 |
| B | 0 | 85 | 111879 | 769.67 | 778 | 760 | 144.4 |
| C | 14 | 234 | 10183 | 50.61 | 814 | 819 | 185.0 |
| C | 13 | 61 | 6105 | 28.57 | 814 | 819 | 185.0 |
| C | 1 | 16 | 3917 | 16.74 | 814 | 819 | 185.0 |
| D | 1 | 52 | 287082 | 1514.4 | 808 | 788 | 189.0 |
| D | 14 | 34 | 213469 | 1125.02 | 808 | 788 | 189.0 |
| D | 10 | 50 | 86735 | 454.63 | 808 | 788 | 189.0 |
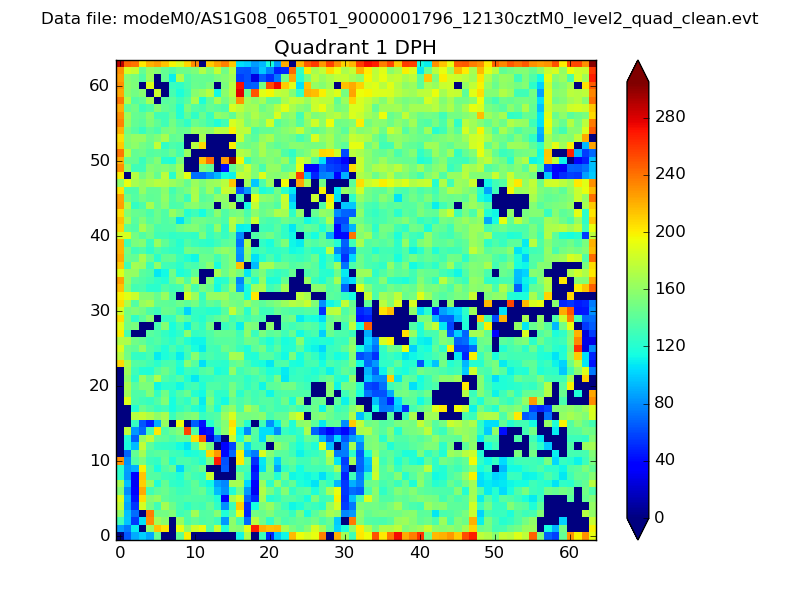
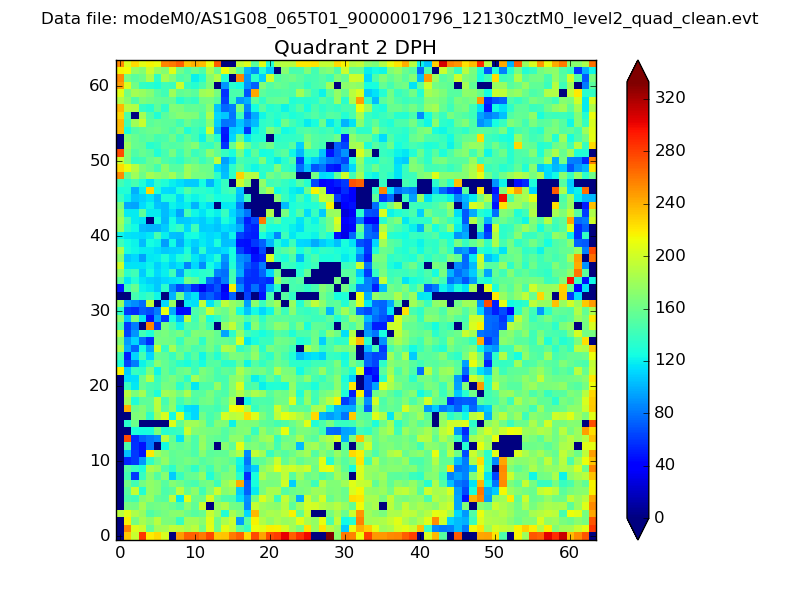
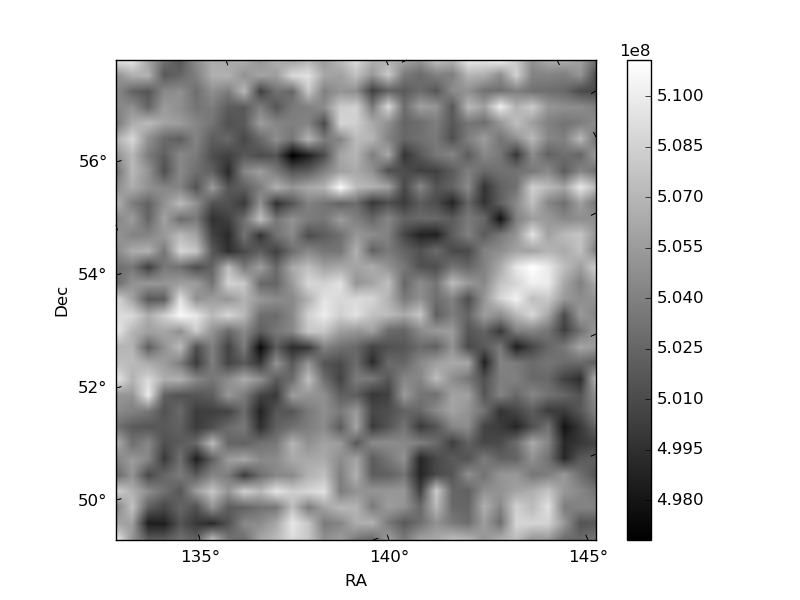
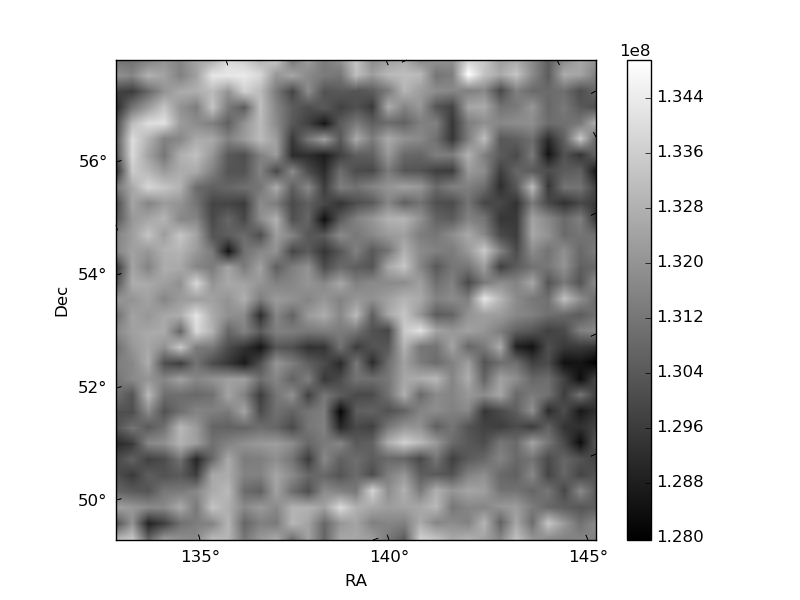
Histogram calculated using DETX and DETY for each event in the final _common_clean file
| Quadrant A | 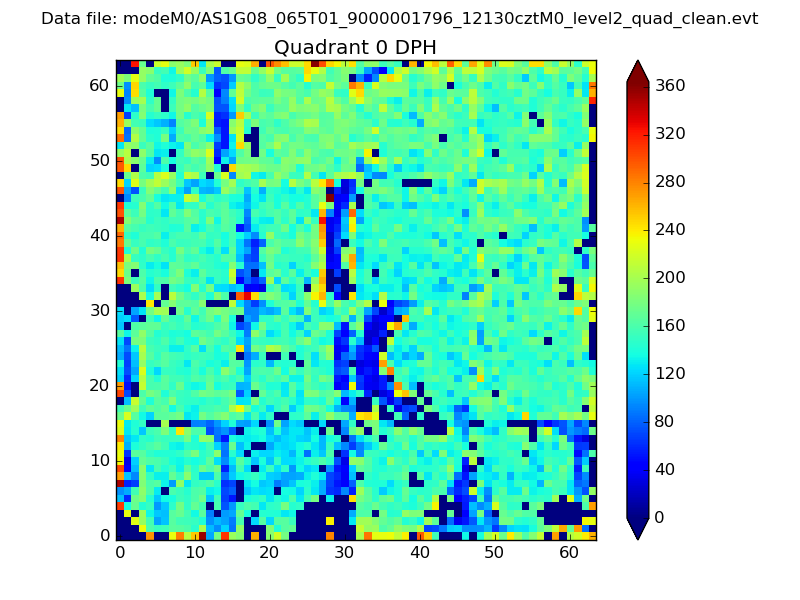 |
 |
Quadrant B |
|---|---|---|---|
| Quadrant D | 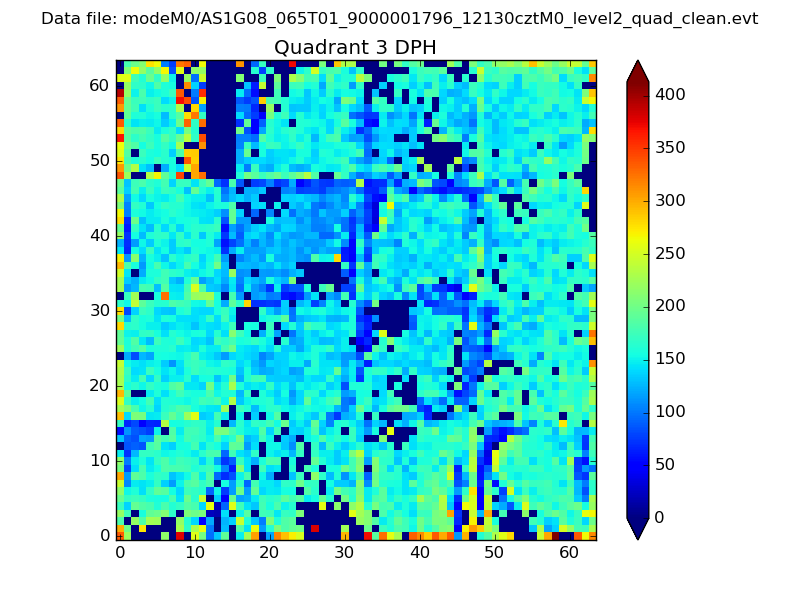 |
 |
Quadrant C |
| Plot type | Count rate plots | Images |
|---|---|---|
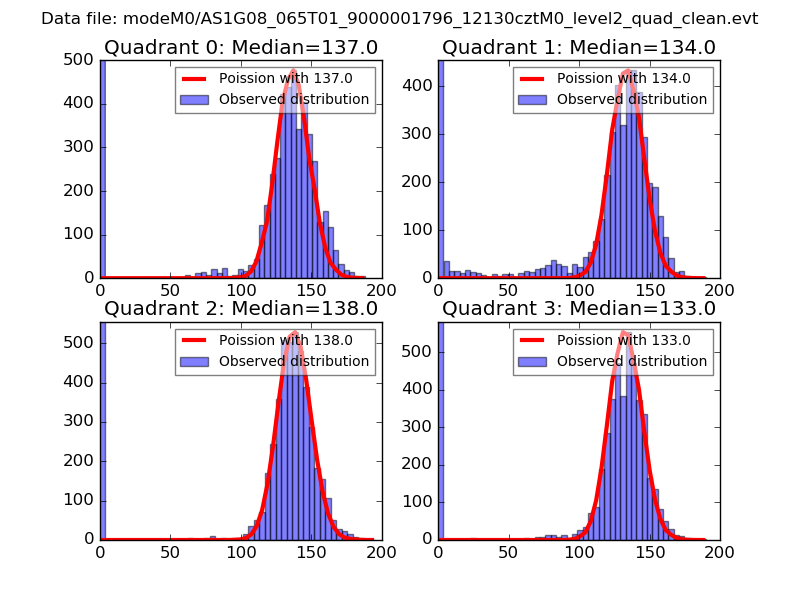
| Comparison with Poisson distribution Blue bars denote a histogram of data divided into 1 sec bins. Red curve is a Poisson curve with rate = median count rate of data. |
 |
 |
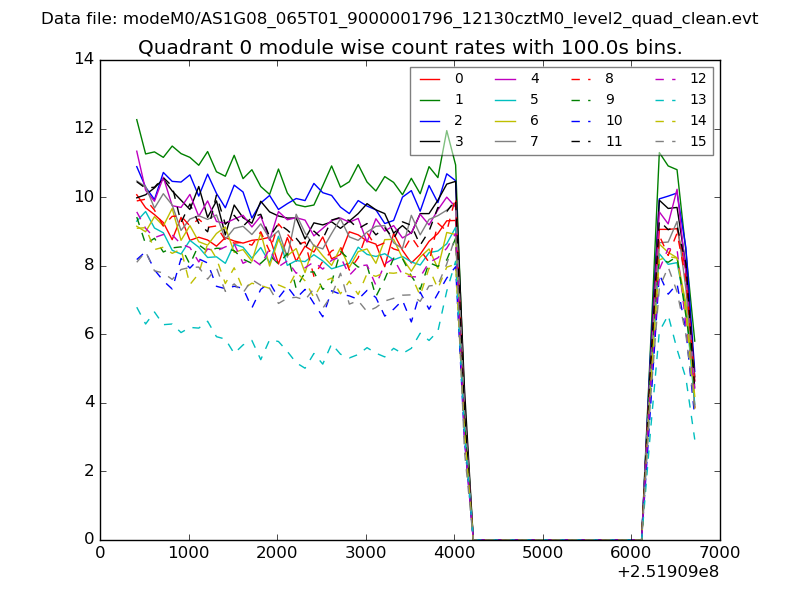
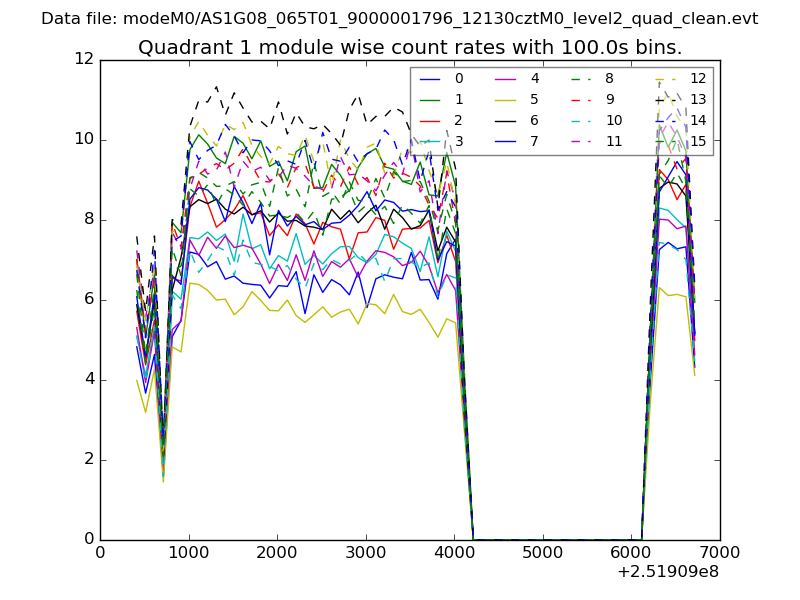
| Quadrant-wise count rates Data is divided into 100 sec bins |
 |
|
| Module-wise count rates for Quadrant A Data is divided into 100 sec bins |
 |
 |
| Module-wise count rates for Quadrant B Data is divided into 100 sec bins |
 |
 |
| Module-wise count rates for Quadrant C Data is divided into 100 sec bins |
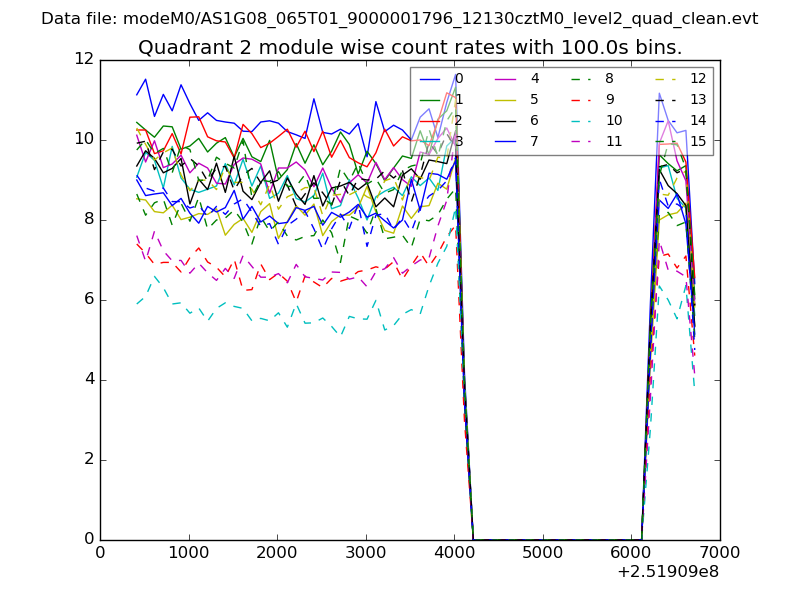 |
 |
| Module-wise count rates for Quadrant D Data is divided into 100 sec bins |
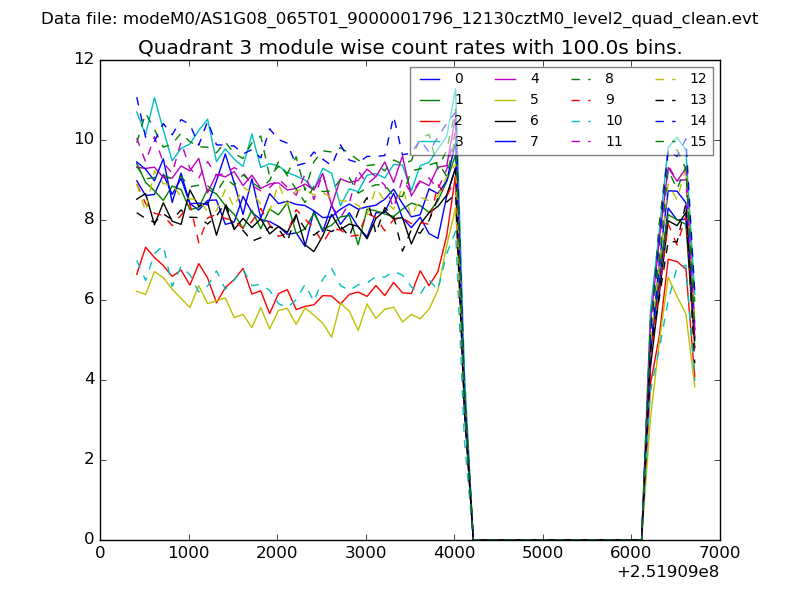 |
 |
| Parameter | Plot |
|---|---|
| CZT HV Monitor | 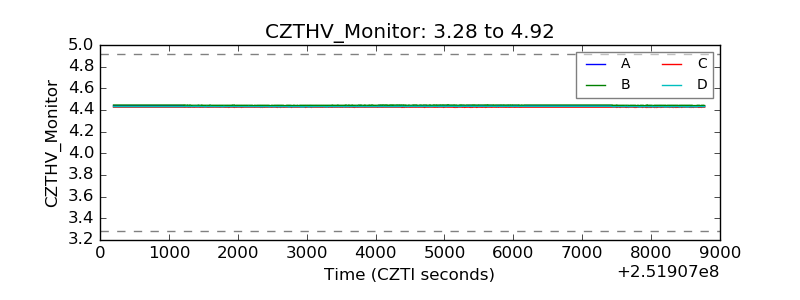 |
| D_VDD | 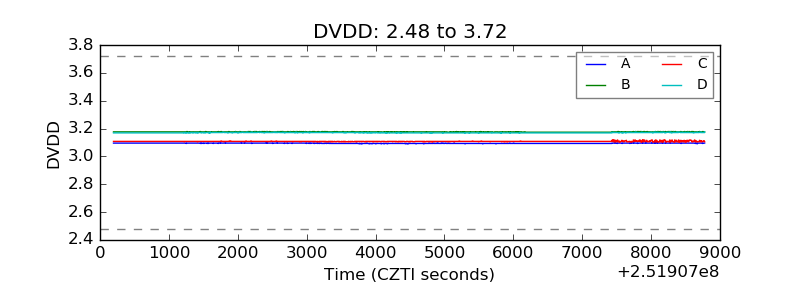 |
| Temperature 1 | 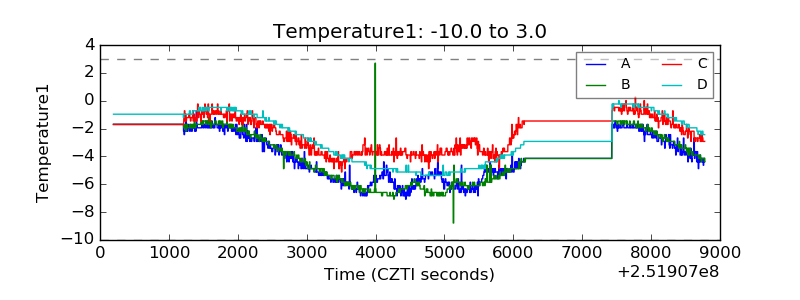 |
| Veto HV Monitor | 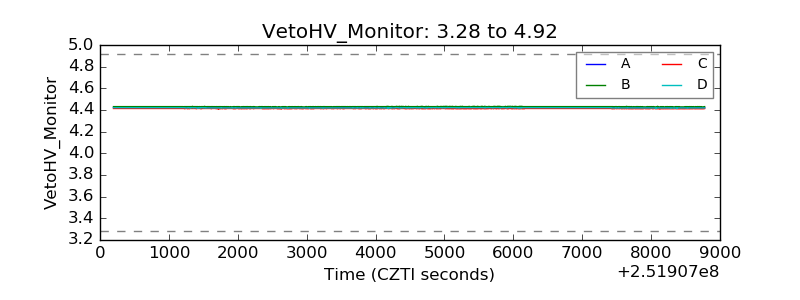 |
| Veto LLD | 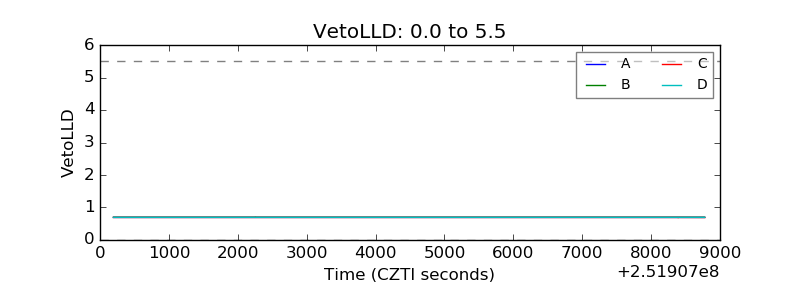 |
| Alpha Counter | 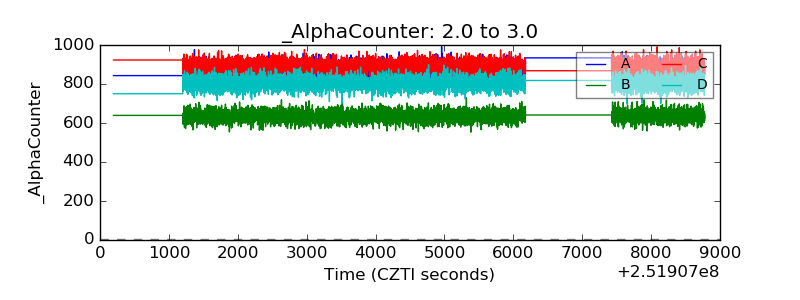 |
| _CPM_Rate | 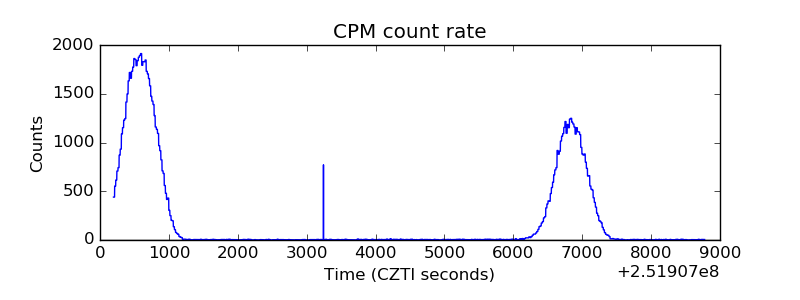 |
| CZT Counter | 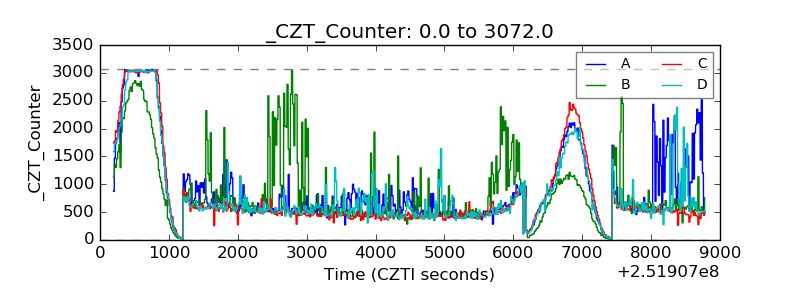 |
| +2.5 Volts monitor |  |
| +5 Volts monitor |  |
| _ROLL_ROT | 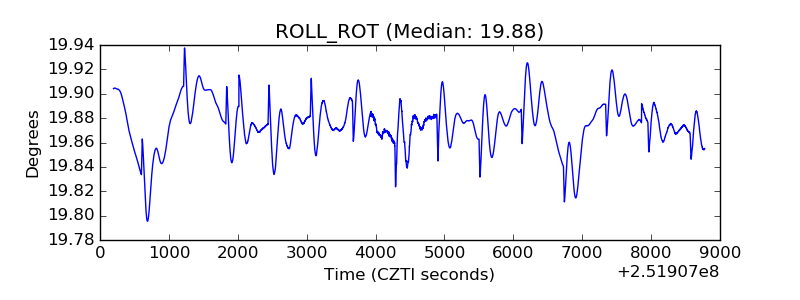 |
| _Roll_DEC | 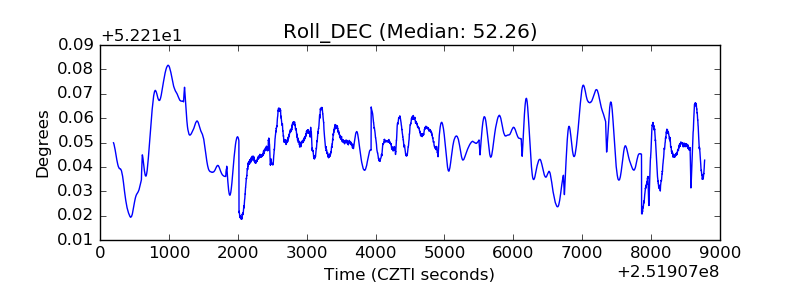 |
| _Roll_RA | 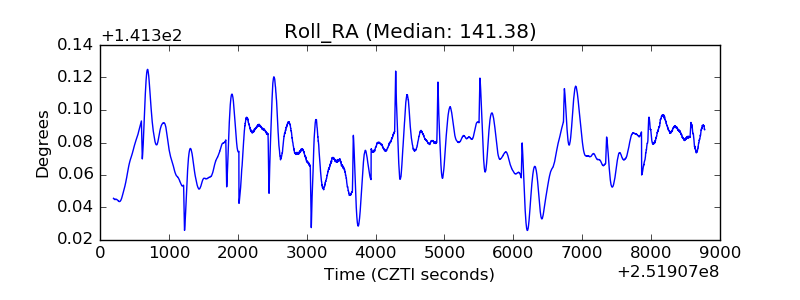 |
| Veto Counter | 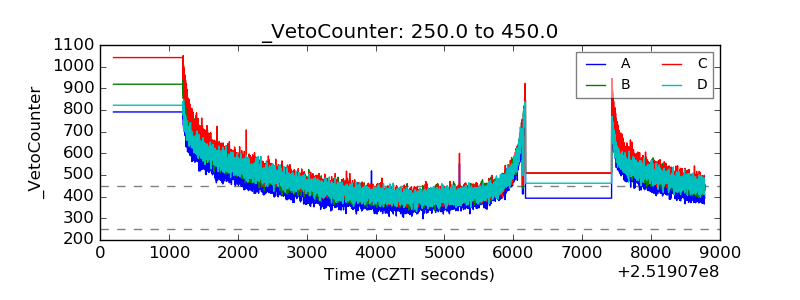 |