| Param | Original file | Final file |
|---|---|---|
| Filename | modeM0/AS1G08_065T01_9000001796_12132cztM0_level2.evt | modeM0/AS1G08_065T01_9000001796_12132cztM0_level2_quad_clean.evt |
| Size (bytes) | 592,352,640 | 103,576,320 |
| Size | 564.9 MB | 98.8 MB |
| Events in quadrant A | 5,311,097 | 677,641 |
| Events in quadrant B | 5,071,908 | 647,649 |
| Events in quadrant C | 3,171,007 | 677,379 |
| Events in quadrant D | 3,915,310 | 650,524 |
| Mode M0 | |||
|---|---|---|---|
| Quadrant | BADHDUFLAG | Total packets | Discarded packets |
| A | 0 | 20736 | 3 |
| B | 0 | 19704 | 2 |
| C | 0 | 14237 | 2 |
| D | 0 | 16385 | 2 |
| Mode M9 | |||
|---|---|---|---|
| Quadrant | BADHDUFLAG | Total packets | Discarded packets |
| A | 0 | 8 | 0 |
| B | 0 | 8 | 0 |
| C | 0 | 8 | 0 |
| D | 0 | 8 | 0 |
| Mode SS | |||
|---|---|---|---|
| Quadrant | BADHDUFLAG | Total packets | Discarded packets |
| A | 0 | 140 | 0 |
| B | 0 | 140 | 0 |
| C | 0 | 140 | 0 |
| D | 0 | 140 | 0 |
| Quadrant | Total seconds | Saturated seconds | Saturation percentage |
|---|---|---|---|
| A | 6945 | 138 | 1.987041% |
| B | 6945 | 600 | 8.639309% |
| C | 6945 | 32 | 0.460763% |
| D | 6946 | 125 | 1.799597% |
Noise dominated data is calculated using 1-second bins in cleaned event files. If a bin has >2000 counts, and if more than 50% of those come from <1% of pixels, then it is considered to be noise-dominated and hence unusable.
| Quadrant | # 1 sec bins | Bins with >0 counts | Bins with >2000 counts | High rate bins dominated by noise | Noise dominated (total time) | Noise dominated (detector-on time) | Marked lightcurve |
|---|---|---|---|---|---|---|---|
| A | 7656 | 6947 | 12 | 12 | 0.16% | 0.17% | 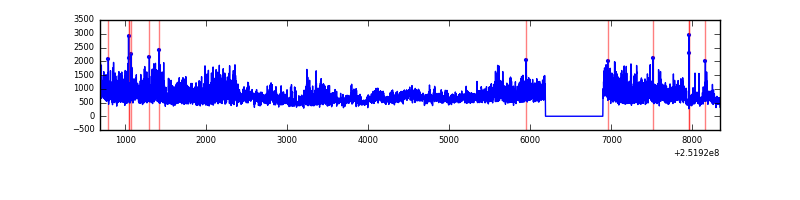 |
| B | 7656 | 6947 | 355 | 355 | 4.64% | 5.11% | 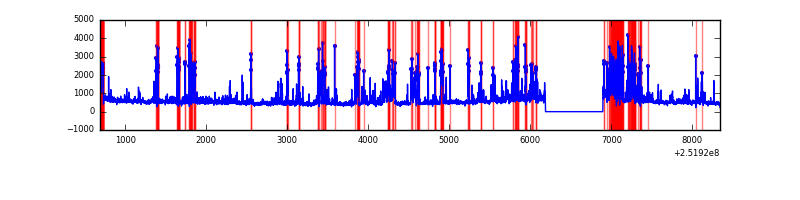 |
| C | 7656 | 6947 | 0 | 0 | 0.00% | 0.00% | 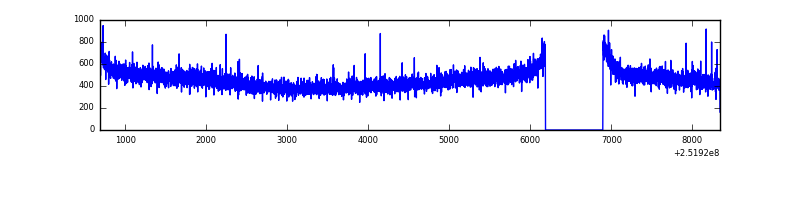 |
| D | 7657 | 6948 | 68 | 68 | 0.89% | 0.98% | 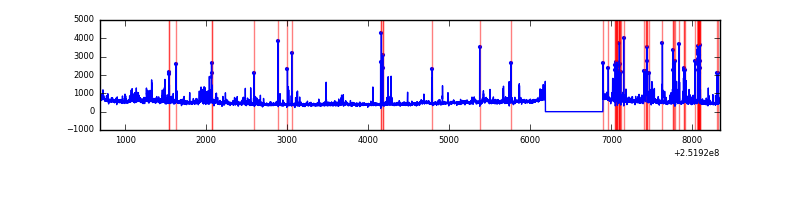 |
Top three noisy pixels from each quadrant. If the there are fewer than three noisy pixels in the level2.evt file, extra rows are filled as -1
| Pixel properties | Quadrant properties | ||||||
|---|---|---|---|---|---|---|---|
| Quadrant | DetID | PixID | Counts | Sigma | Mean | Median | Sigma |
| A | 14 | 63 | 1934920 | 11603.39 | 827 | 809 | 166.7 |
| A | 1 | 162 | 61551 | 364.41 | 827 | 809 | 166.7 |
| A | 13 | 248 | 41883 | 246.42 | 827 | 809 | 166.7 |
| B | 4 | 239 | 1486655 | 9961.58 | 792 | 773 | 149.2 |
| B | 11 | 51 | 147055 | 980.7 | 792 | 773 | 149.2 |
| B | 10 | 16 | 115690 | 770.42 | 792 | 773 | 149.2 |
| C | 13 | 61 | 5993 | 27.75 | 811 | 814 | 186.6 |
| C | 14 | 234 | 3718 | 15.56 | 811 | 814 | 186.6 |
| C | 15 | 208 | 3369 | 13.69 | 811 | 814 | 186.6 |
| D | 1 | 52 | 269439 | 1381.68 | 805 | 782 | 194.4 |
| D | 13 | 104 | 182081 | 932.4 | 805 | 782 | 194.4 |
| D | 8 | 195 | 135916 | 694.98 | 805 | 782 | 194.4 |
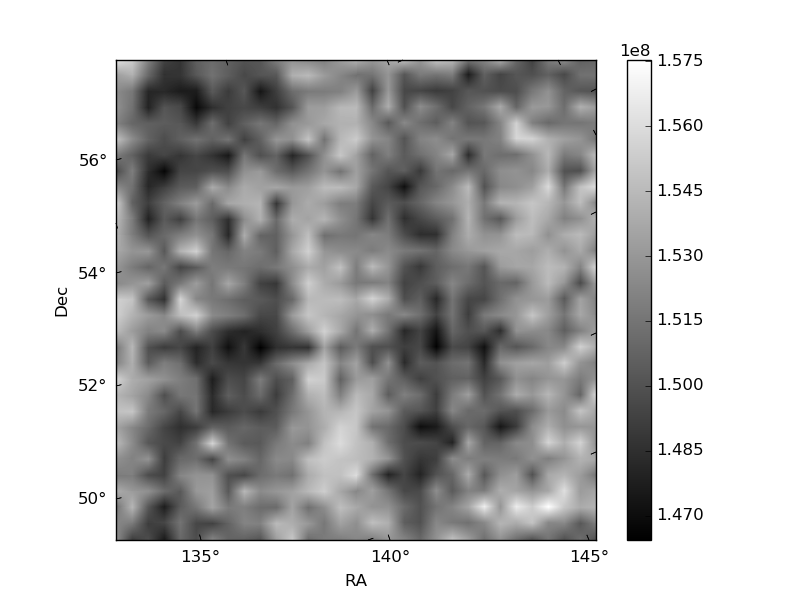
Histogram calculated using DETX and DETY for each event in the final _common_clean file
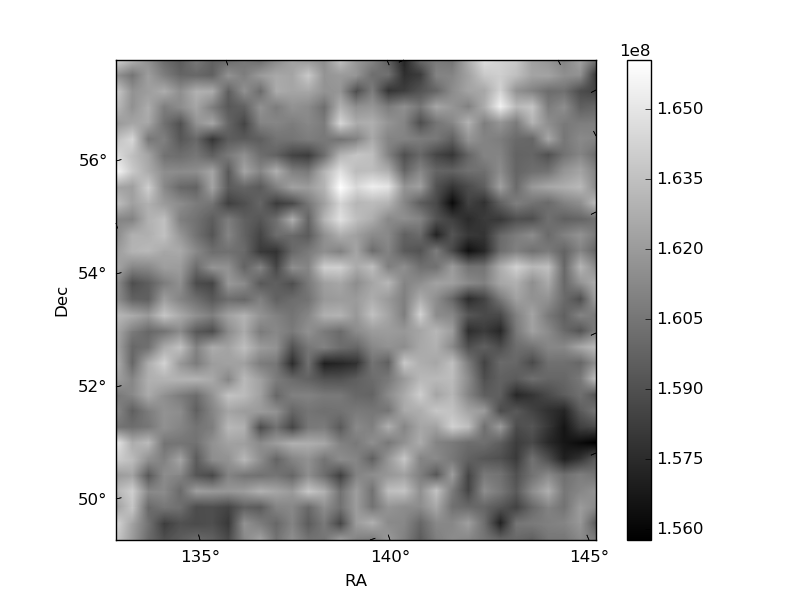
| Quadrant A |  |
 |
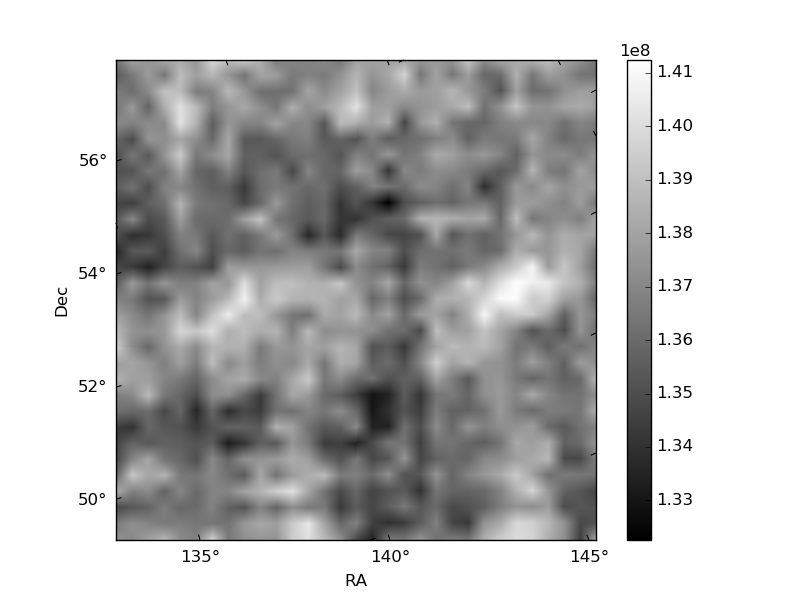
Quadrant B |
|---|---|---|---|
| Quadrant D |  |
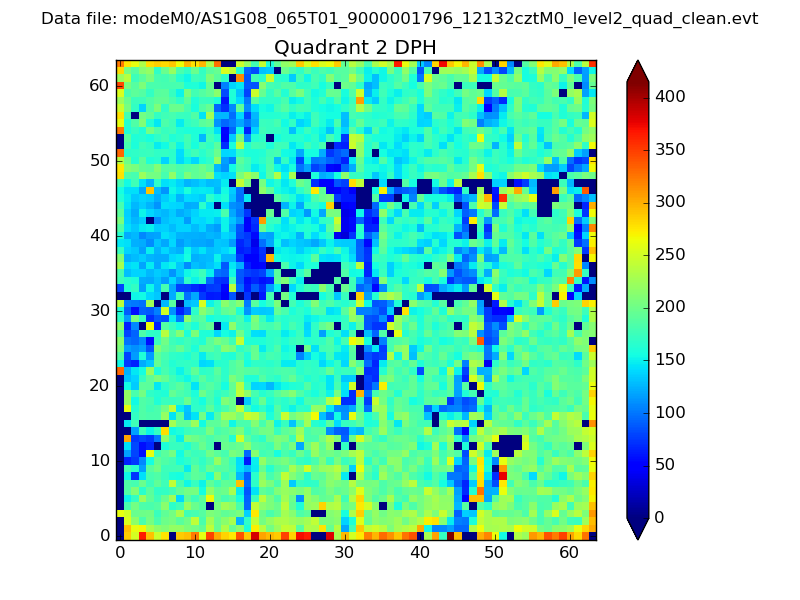 |
Quadrant C |
| Plot type | Count rate plots | Images |
|---|---|---|
| Comparison with Poisson distribution Blue bars denote a histogram of data divided into 1 sec bins. Red curve is a Poisson curve with rate = median count rate of data. |
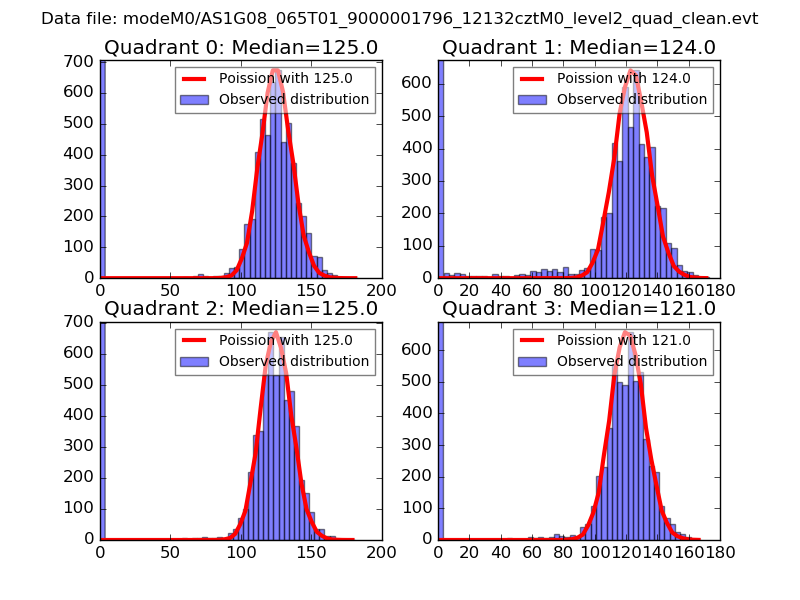 |
 |
| Quadrant-wise count rates Data is divided into 100 sec bins |
 |
|
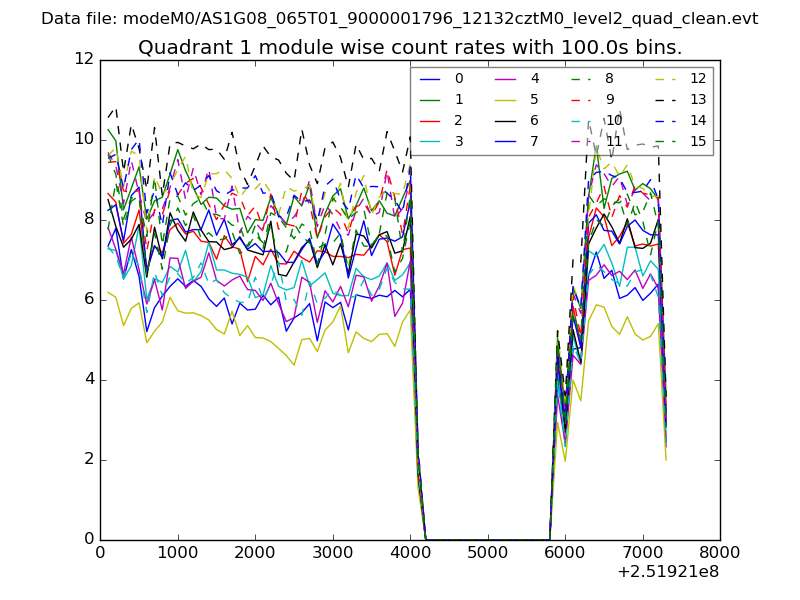
| Module-wise count rates for Quadrant A Data is divided into 100 sec bins |
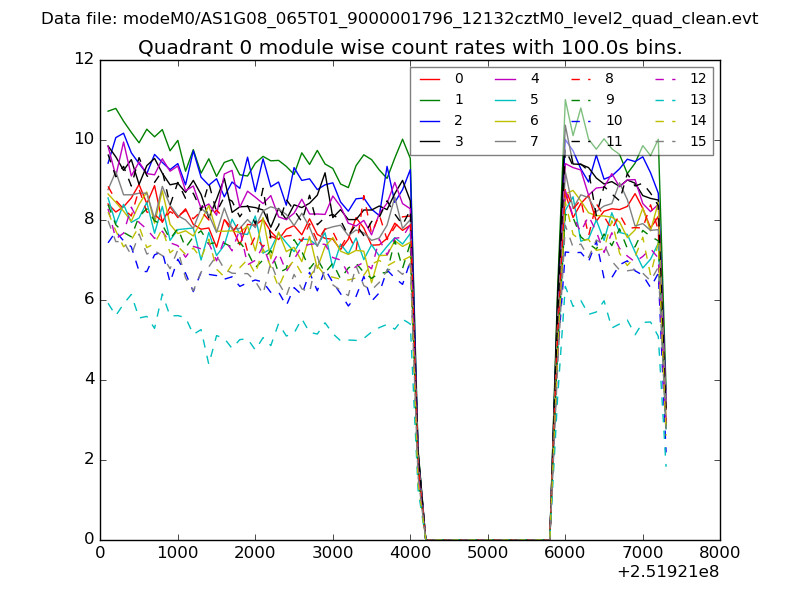 |
 |
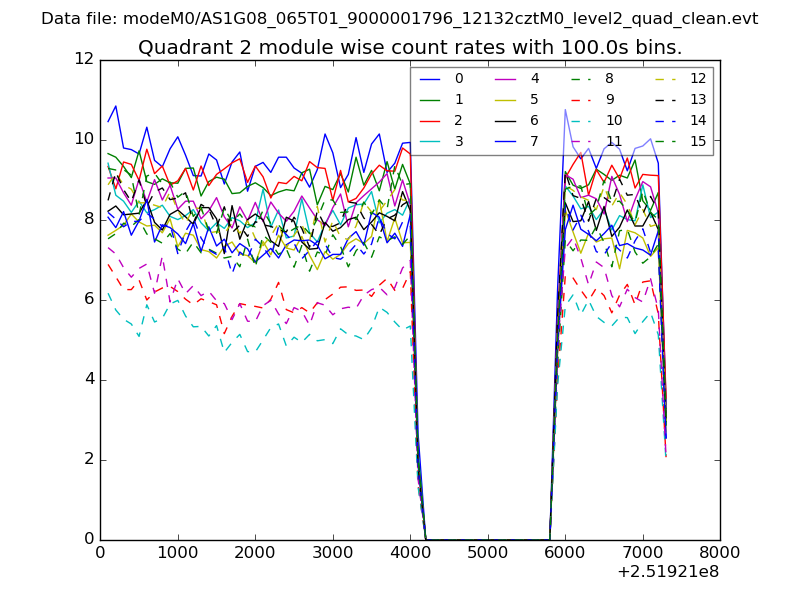
| Module-wise count rates for Quadrant B Data is divided into 100 sec bins |
 |
 |
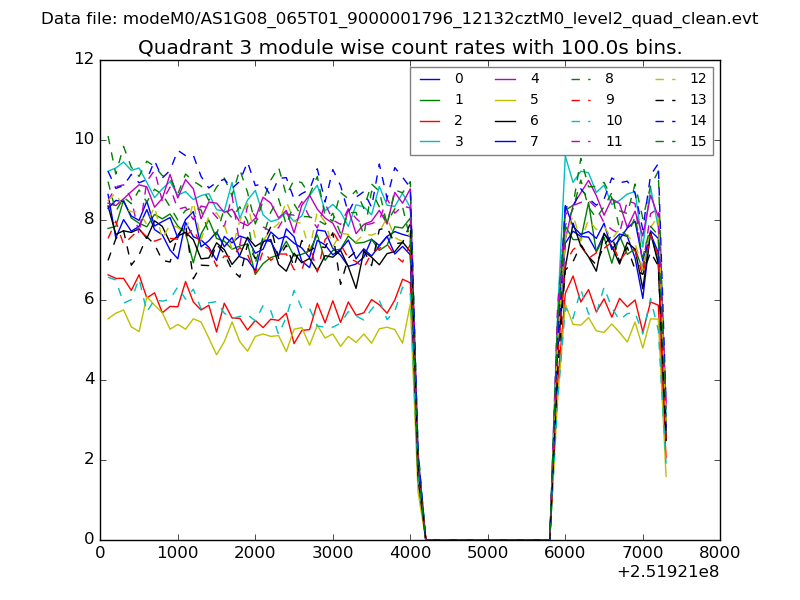
| Module-wise count rates for Quadrant C Data is divided into 100 sec bins |
 |
 |
| Module-wise count rates for Quadrant D Data is divided into 100 sec bins |
 |
 |
| Parameter | Plot |
|---|---|
| CZT HV Monitor | 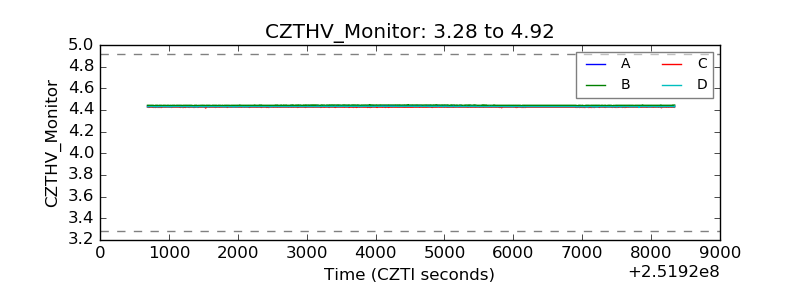 |
| D_VDD | 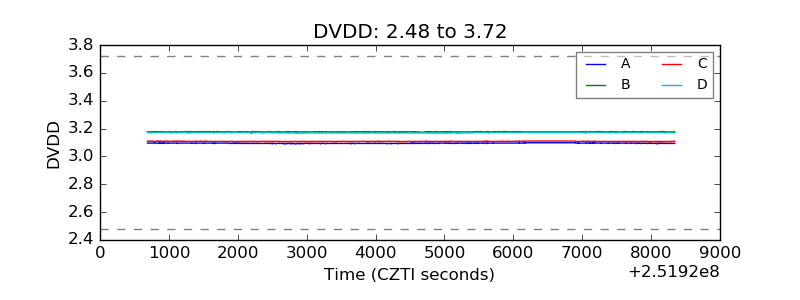 |
| Temperature 1 |  |
| Veto HV Monitor | 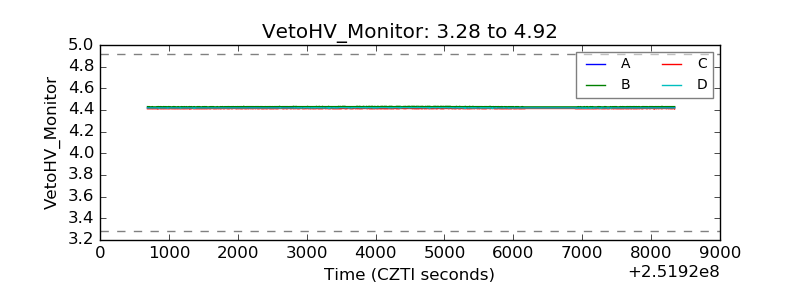 |
| Veto LLD | 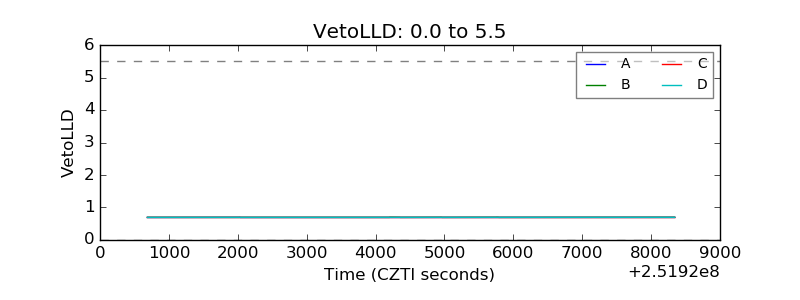 |
| Alpha Counter | 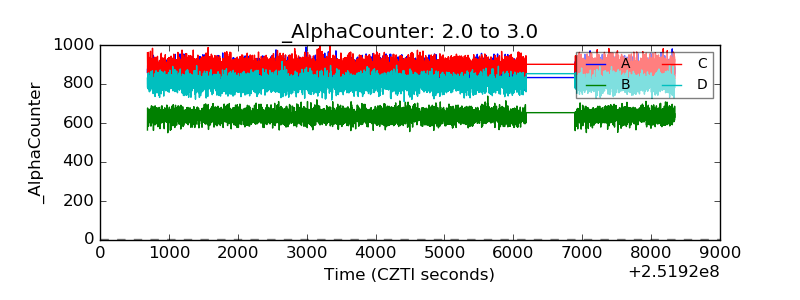 |
| _CPM_Rate | 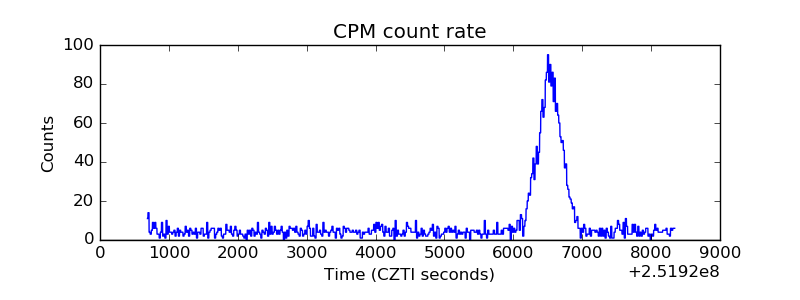 |
| CZT Counter |  |
| +2.5 Volts monitor |  |
| +5 Volts monitor |  |
| _ROLL_ROT | 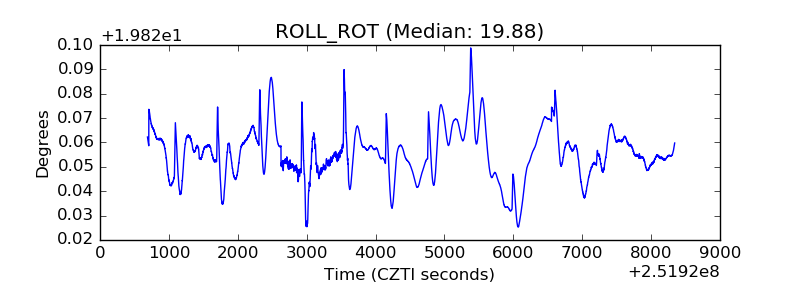 |
| _Roll_DEC | 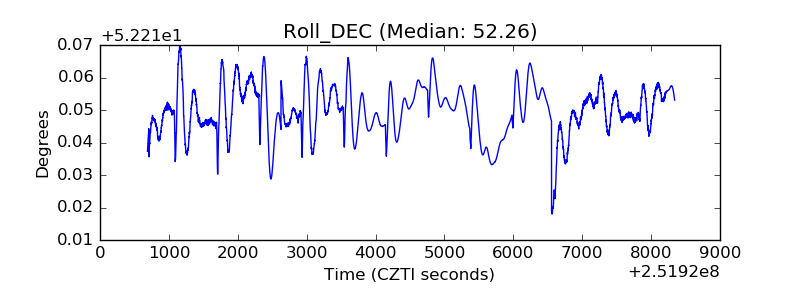 |
| _Roll_RA |  |
| Veto Counter | 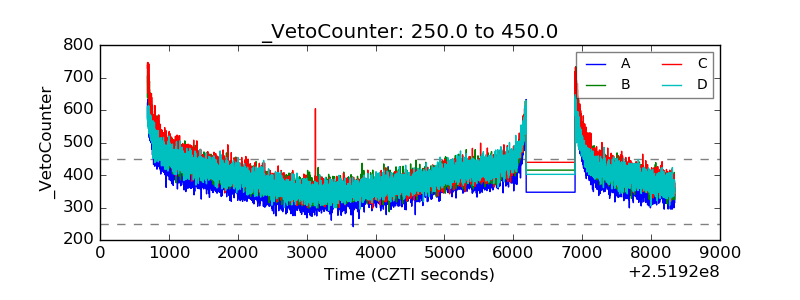 |