| Param | Original file | Final file |
|---|---|---|
| Filename | modeM0/AS1G08_065T01_9000001796_12134cztM0_level2.evt | modeM0/AS1G08_065T01_9000001796_12134cztM0_level2_quad_clean.evt |
| Size (bytes) | 723,349,440 | 111,263,040 |
| Size | 689.8 MB | 106.1 MB |
| Events in quadrant A | 7,066,000 | 688,099 |
| Events in quadrant B | 5,950,838 | 708,860 |
| Events in quadrant C | 3,656,736 | 731,078 |
| Events in quadrant D | 4,705,209 | 698,247 |
| Mode M0 | |||
|---|---|---|---|
| Quadrant | BADHDUFLAG | Total packets | Discarded packets |
| A | 0 | 26502 | 3 |
| B | 0 | 23105 | 2 |
| C | 0 | 16480 | 2 |
| D | 0 | 19508 | 2 |
| Mode M9 | |||
|---|---|---|---|
| Quadrant | BADHDUFLAG | Total packets | Discarded packets |
| A | 0 | 3 | 0 |
| B | 0 | 3 | 0 |
| C | 0 | 3 | 0 |
| D | 0 | 3 | 0 |
| Mode SS | |||
|---|---|---|---|
| Quadrant | BADHDUFLAG | Total packets | Discarded packets |
| A | 0 | 160 | 0 |
| B | 0 | 160 | 0 |
| C | 0 | 160 | 0 |
| D | 0 | 160 | 0 |
| Quadrant | Total seconds | Saturated seconds | Saturation percentage |
|---|---|---|---|
| A | 7805 | 1032 | 13.222293% |
| B | 7805 | 773 | 9.903908% |
| C | 7805 | 65 | 0.832799% |
| D | 7805 | 241 | 3.087764% |
Noise dominated data is calculated using 1-second bins in cleaned event files. If a bin has >2000 counts, and if more than 50% of those come from <1% of pixels, then it is considered to be noise-dominated and hence unusable.
| Quadrant | # 1 sec bins | Bins with >0 counts | Bins with >2000 counts | High rate bins dominated by noise | Noise dominated (total time) | Noise dominated (detector-on time) | Marked lightcurve |
|---|---|---|---|---|---|---|---|
| A | 8141 | 7808 | 740 | 740 | 9.09% | 9.48% | 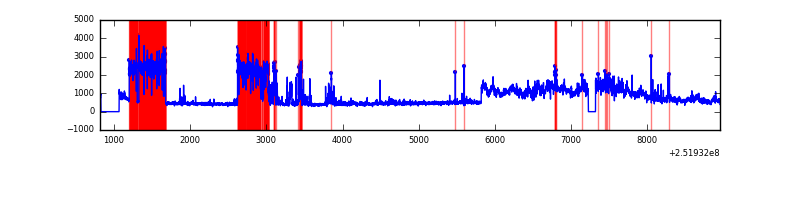 |
| B | 8141 | 7808 | 381 | 381 | 4.68% | 4.88% | 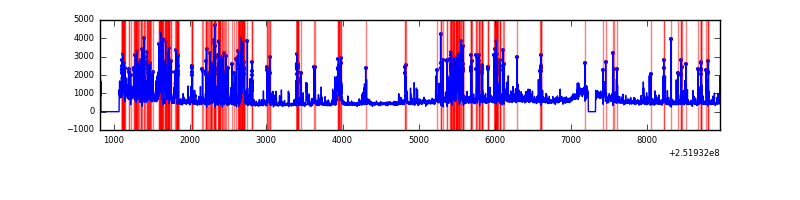 |
| C | 8141 | 7808 | 2 | 2 | 0.02% | 0.03% | 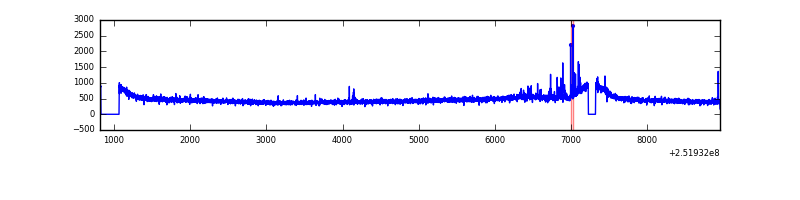 |
| D | 8141 | 7808 | 158 | 158 | 1.94% | 2.02% | 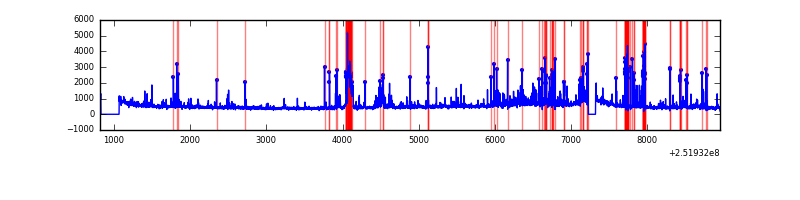 |
Top three noisy pixels from each quadrant. If the there are fewer than three noisy pixels in the level2.evt file, extra rows are filled as -1
| Pixel properties | Quadrant properties | ||||||
|---|---|---|---|---|---|---|---|
| Quadrant | DetID | PixID | Counts | Sigma | Mean | Median | Sigma |
| A | 14 | 63 | 3344620 | 18206.03 | 900 | 879 | 183.7 |
| A | 1 | 162 | 62918 | 337.79 | 900 | 879 | 183.7 |
| A | 2 | 79 | 55322 | 296.43 | 900 | 879 | 183.7 |
| B | 4 | 239 | 925628 | 5281.48 | 910 | 887 | 175.1 |
| B | 3 | 64 | 653228 | 3725.72 | 910 | 887 | 175.1 |
| B | 10 | 16 | 412152 | 2348.86 | 910 | 887 | 175.1 |
| C | 15 | 208 | 60700 | 280.1 | 918 | 921 | 213.4 |
| C | 13 | 250 | 8070 | 33.5 | 918 | 921 | 213.4 |
| C | 13 | 61 | 6839 | 27.73 | 918 | 921 | 213.4 |
| D | 1 | 52 | 530107 | 2425.15 | 904 | 877 | 218.2 |
| D | 9 | 85 | 244357 | 1115.73 | 904 | 877 | 218.2 |
| D | 8 | 195 | 194760 | 888.45 | 904 | 877 | 218.2 |
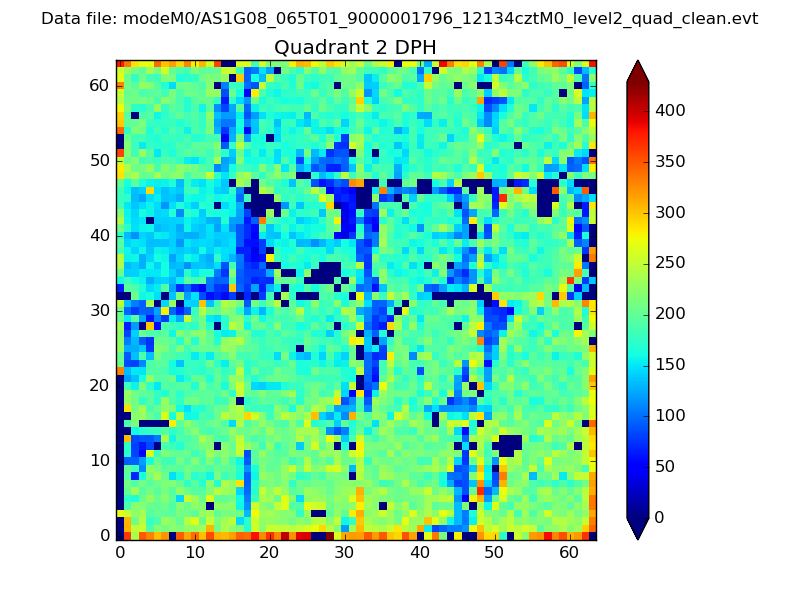
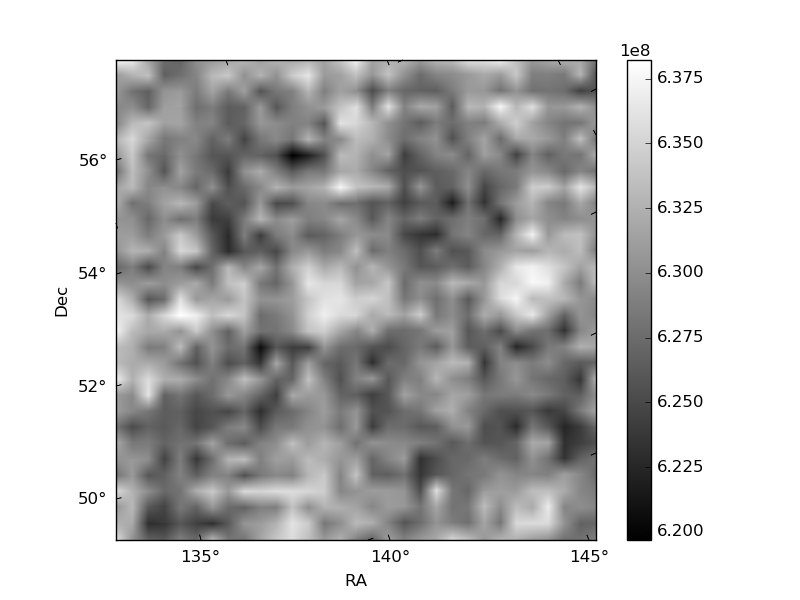
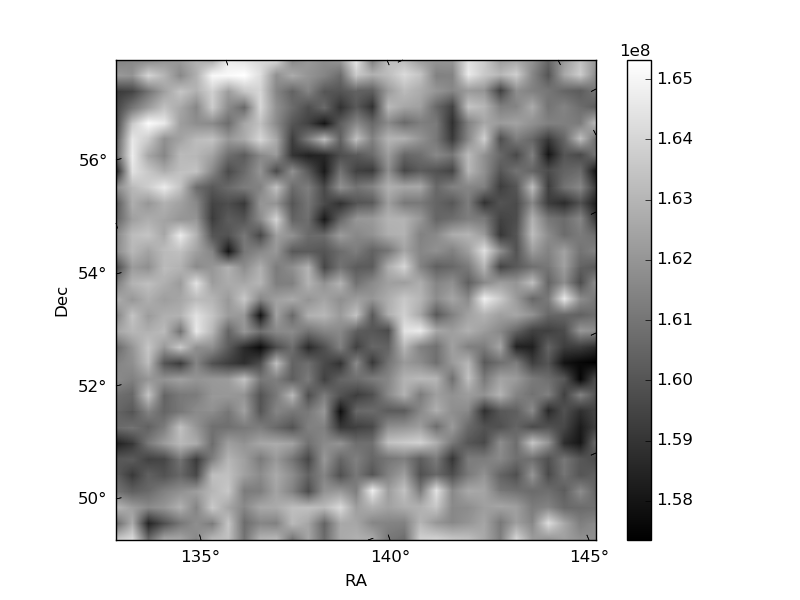
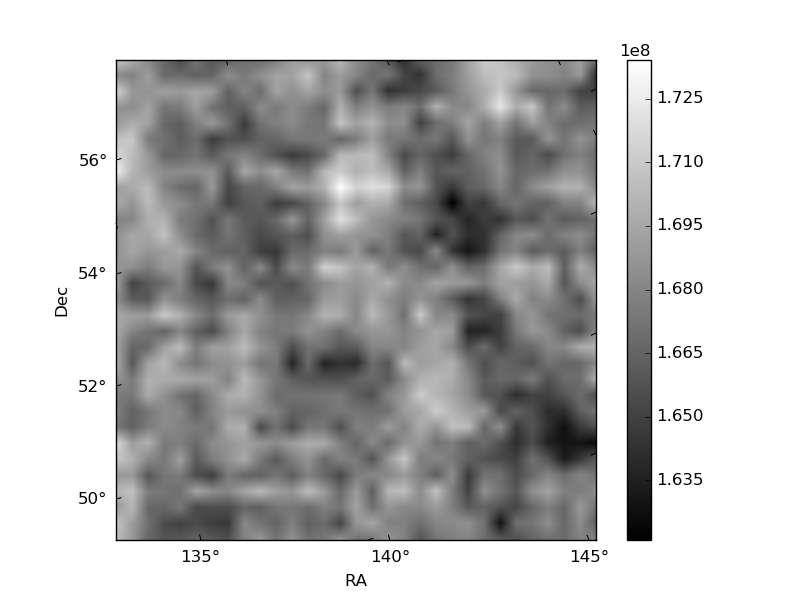
Histogram calculated using DETX and DETY for each event in the final _common_clean file
| Quadrant A | 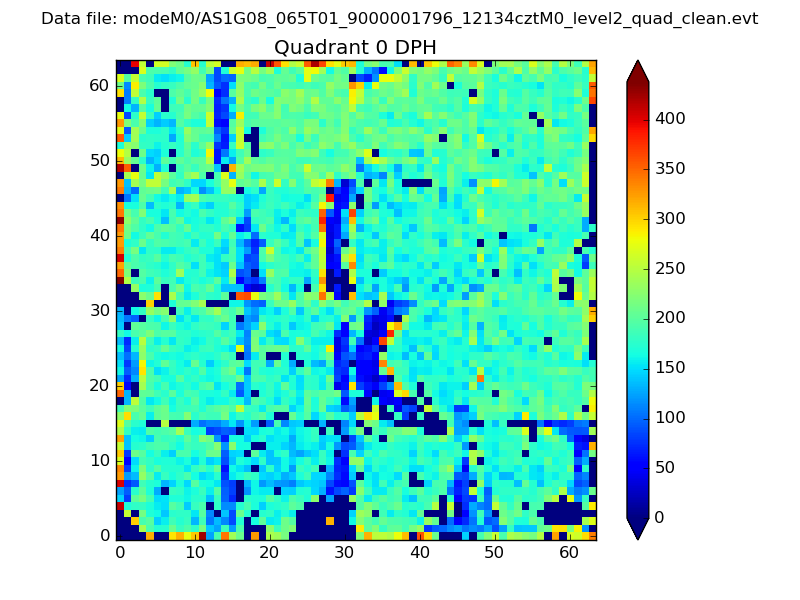 |
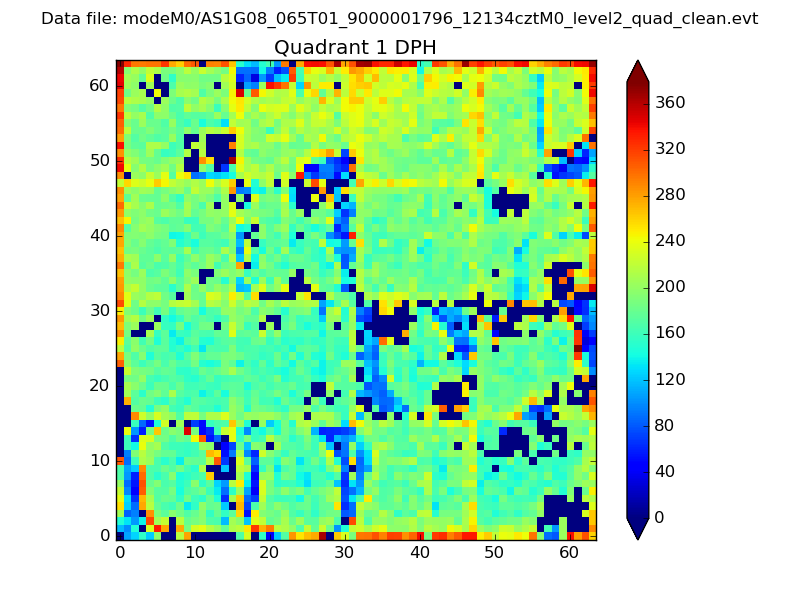 |
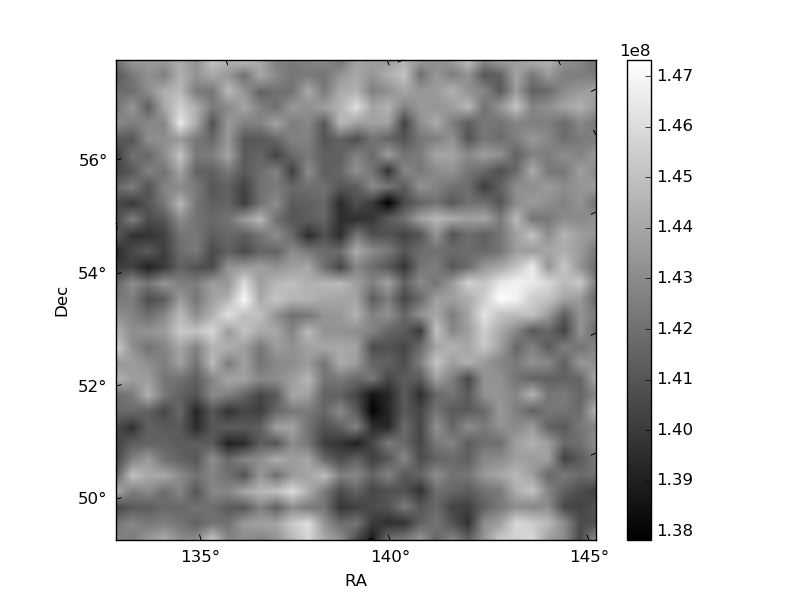
Quadrant B |
|---|---|---|---|
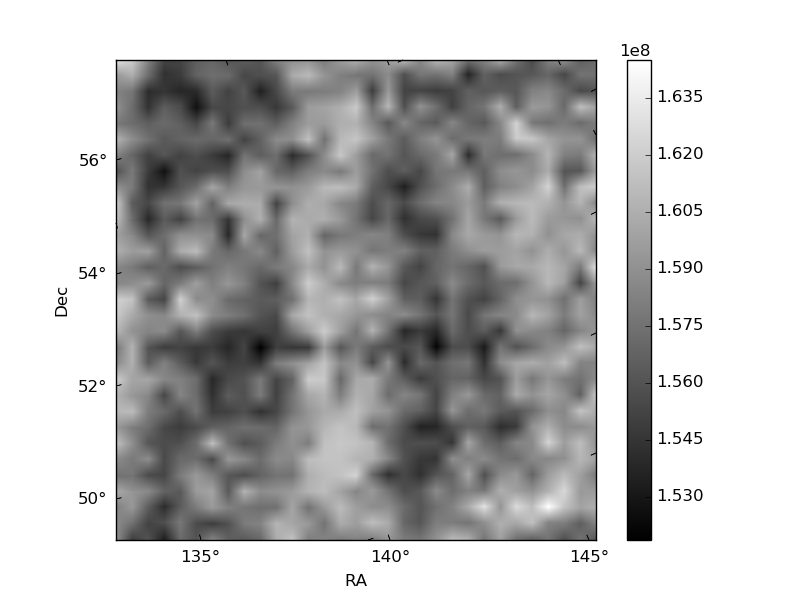
| Quadrant D | 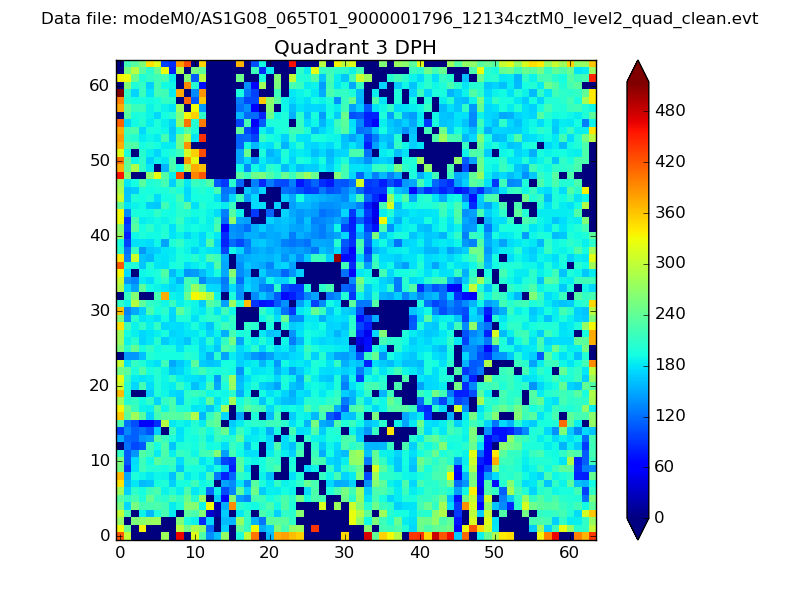 |
 |
Quadrant C |
| Plot type | Count rate plots | Images |
|---|---|---|
| Comparison with Poisson distribution Blue bars denote a histogram of data divided into 1 sec bins. Red curve is a Poisson curve with rate = median count rate of data. |
 |
 |
| Quadrant-wise count rates Data is divided into 100 sec bins |
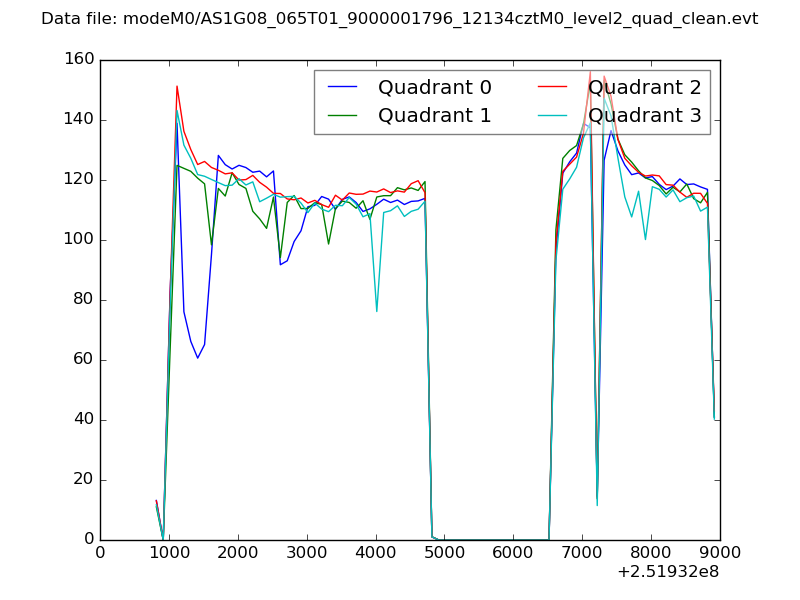 |
|
| Module-wise count rates for Quadrant A Data is divided into 100 sec bins |
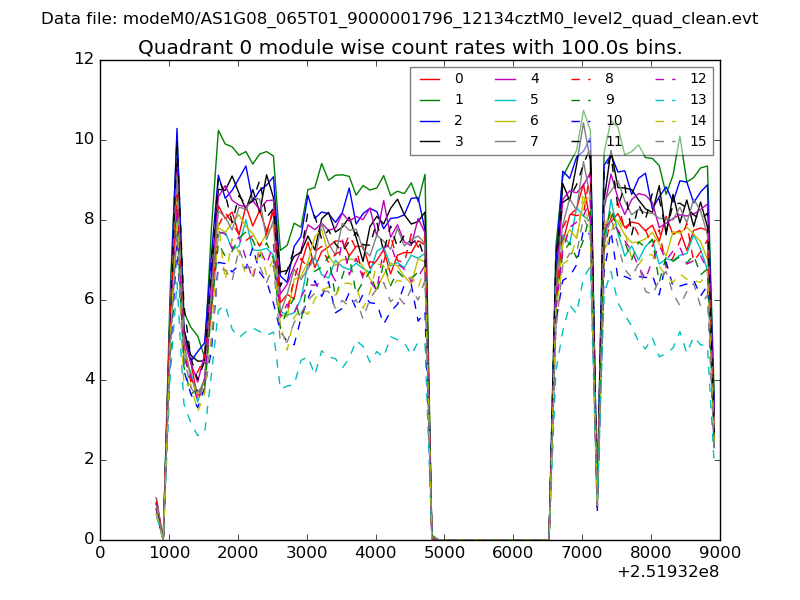 |
 |
| Module-wise count rates for Quadrant B Data is divided into 100 sec bins |
 |
 |
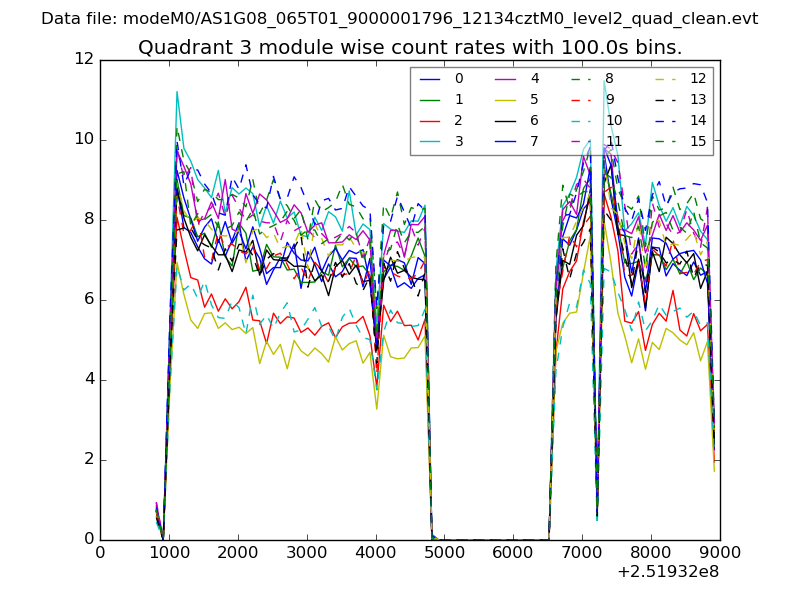
| Module-wise count rates for Quadrant C Data is divided into 100 sec bins |
 |
 |
| Module-wise count rates for Quadrant D Data is divided into 100 sec bins |
 |
 |
| Parameter | Plot |
|---|---|
| CZT HV Monitor |  |
| D_VDD | 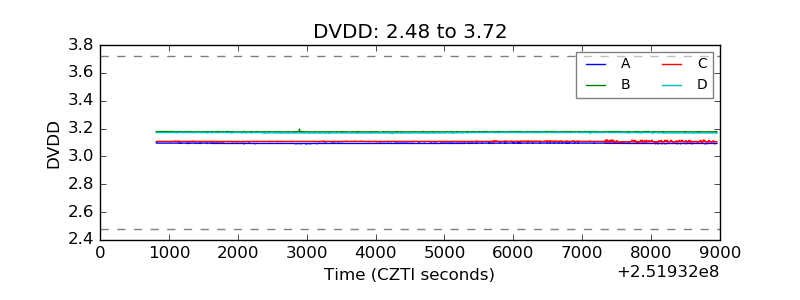 |
| Temperature 1 |  |
| Veto HV Monitor | 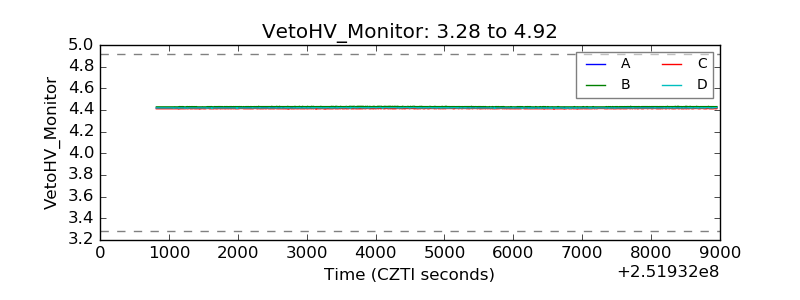 |
| Veto LLD | 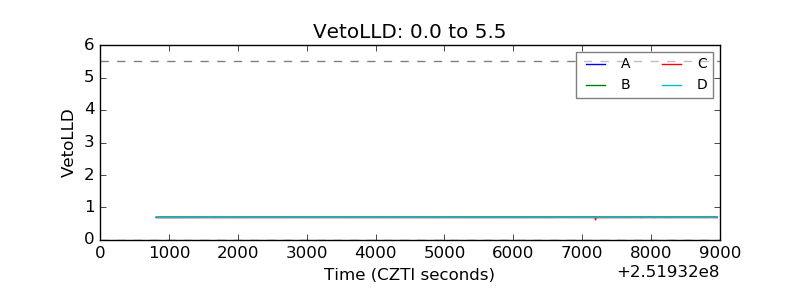 |
| Alpha Counter | 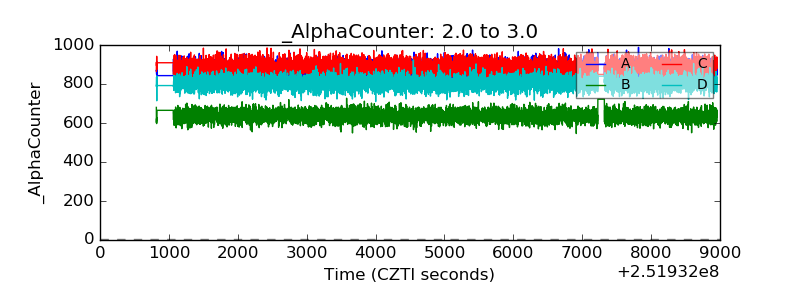 |
| _CPM_Rate | 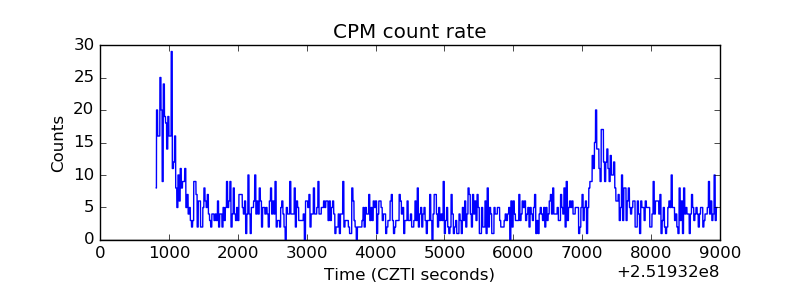 |
| CZT Counter | 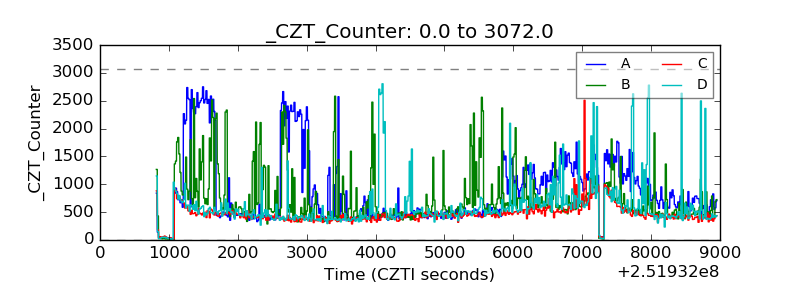 |
| +2.5 Volts monitor |  |
| +5 Volts monitor |  |
| _ROLL_ROT | 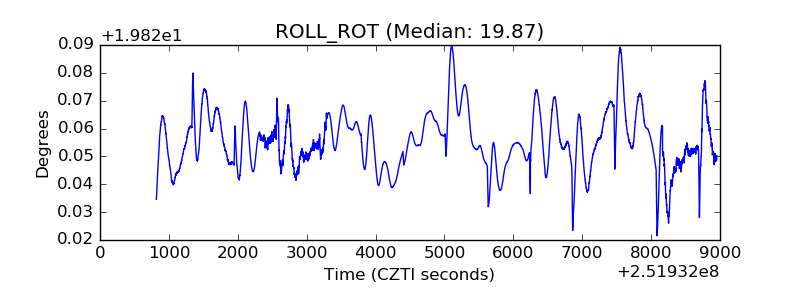 |
| _Roll_DEC | 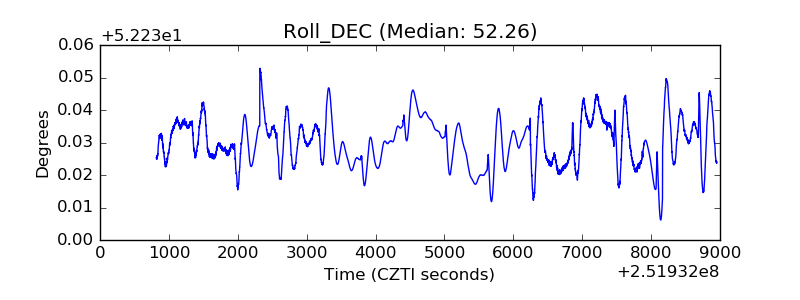 |
| _Roll_RA | 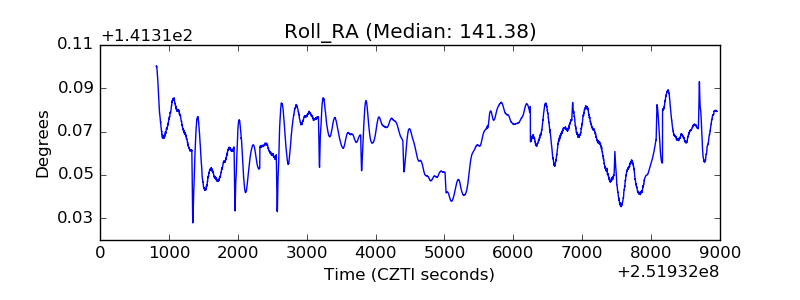 |
| Veto Counter | 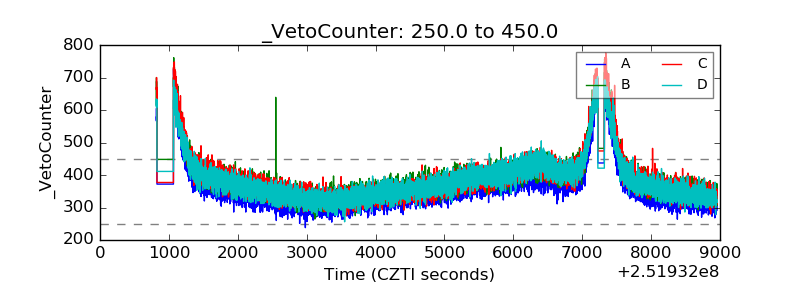 |