| Param | Original file | Final file |
|---|---|---|
| Filename | modeM0/AS1G08_065T01_9000001796_12135cztM0_level2.evt | modeM0/AS1G08_065T01_9000001796_12135cztM0_level2_quad_clean.evt |
| Size (bytes) | 776,931,840 | 117,020,160 |
| Size | 740.9 MB | 111.6 MB |
| Events in quadrant A | 8,234,719 | 727,072 |
| Events in quadrant B | 6,403,305 | 744,632 |
| Events in quadrant C | 3,886,920 | 767,948 |
| Events in quadrant D | 4,456,158 | 739,579 |
| Mode M0 | |||
|---|---|---|---|
| Quadrant | BADHDUFLAG | Total packets | Discarded packets |
| A | 0 | 30252 | 3 |
| B | 0 | 24590 | 2 |
| C | 0 | 17275 | 2 |
| D | 0 | 18982 | 2 |
| Mode M9 | |||
|---|---|---|---|
| Quadrant | BADHDUFLAG | Total packets | Discarded packets |
| A | 0 | 5 | 0 |
| B | 0 | 5 | 0 |
| C | 0 | 5 | 0 |
| D | 0 | 5 | 0 |
| Mode SS | |||
|---|---|---|---|
| Quadrant | BADHDUFLAG | Total packets | Discarded packets |
| A | 0 | 164 | 0 |
| B | 0 | 164 | 0 |
| C | 0 | 164 | 0 |
| D | 0 | 164 | 0 |
| Quadrant | Total seconds | Saturated seconds | Saturation percentage |
|---|---|---|---|
| A | 8125 | 1002 | 12.332308% |
| B | 8125 | 775 | 9.538462% |
| C | 8125 | 83 | 1.021538% |
| D | 8125 | 174 | 2.141538% |
Noise dominated data is calculated using 1-second bins in cleaned event files. If a bin has >2000 counts, and if more than 50% of those come from <1% of pixels, then it is considered to be noise-dominated and hence unusable.
| Quadrant | # 1 sec bins | Bins with >0 counts | Bins with >2000 counts | High rate bins dominated by noise | Noise dominated (total time) | Noise dominated (detector-on time) | Marked lightcurve |
|---|---|---|---|---|---|---|---|
| A | 8561 | 8128 | 616 | 616 | 7.20% | 7.58% | 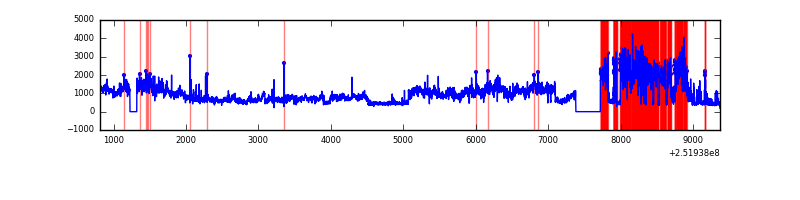 |
| B | 8561 | 8128 | 378 | 378 | 4.42% | 4.65% | 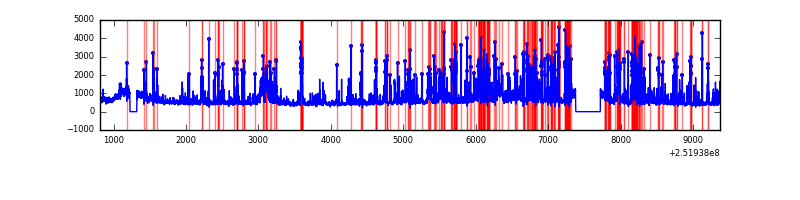 |
| C | 8561 | 8128 | 4 | 4 | 0.05% | 0.05% | 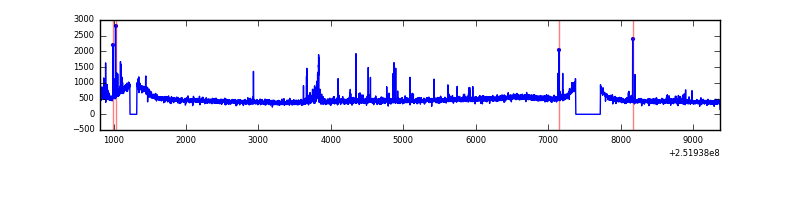 |
| D | 8561 | 8128 | 99 | 99 | 1.16% | 1.22% | 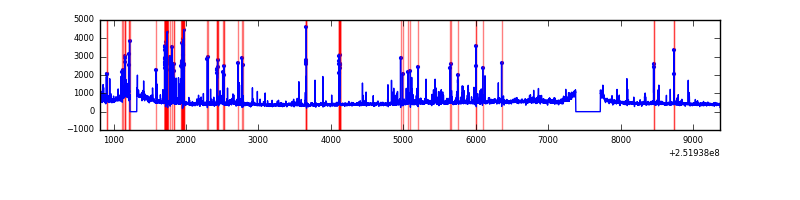 |
Top three noisy pixels from each quadrant. If the there are fewer than three noisy pixels in the level2.evt file, extra rows are filled as -1
| Pixel properties | Quadrant properties | ||||||
|---|---|---|---|---|---|---|---|
| Quadrant | DetID | PixID | Counts | Sigma | Mean | Median | Sigma |
| A | 14 | 63 | 4344189 | 22757.68 | 939 | 919 | 190.8 |
| A | 1 | 162 | 91852 | 476.47 | 939 | 919 | 190.8 |
| A | 2 | 79 | 45904 | 235.71 | 939 | 919 | 190.8 |
| B | 4 | 239 | 933992 | 5119.07 | 945 | 922 | 182.3 |
| B | 10 | 16 | 823693 | 4513.94 | 945 | 922 | 182.3 |
| B | 3 | 64 | 521903 | 2858.24 | 945 | 922 | 182.3 |
| C | 15 | 208 | 154701 | 691.55 | 949 | 951 | 222.3 |
| C | 14 | 234 | 10721 | 43.94 | 949 | 951 | 222.3 |
| C | 8 | 128 | 9743 | 39.55 | 949 | 951 | 222.3 |
| D | 1 | 52 | 621095 | 2723.72 | 936 | 909 | 227.7 |
| D | 8 | 195 | 133544 | 582.5 | 936 | 909 | 227.7 |
| D | 10 | 50 | 45794 | 197.13 | 936 | 909 | 227.7 |
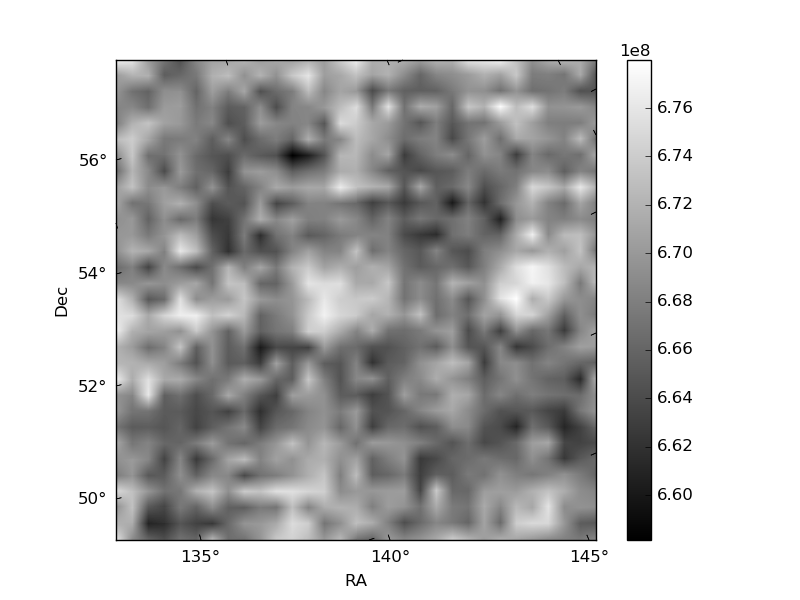
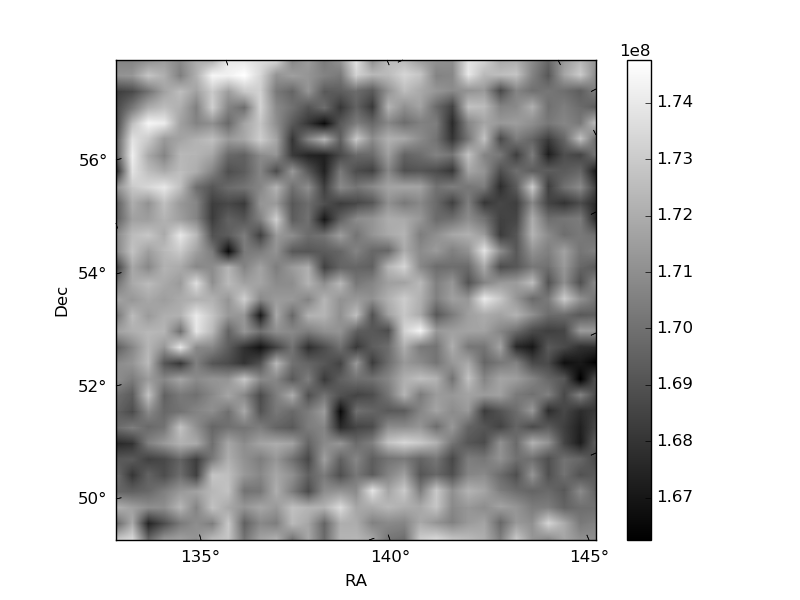
Histogram calculated using DETX and DETY for each event in the final _common_clean file
| Quadrant A | 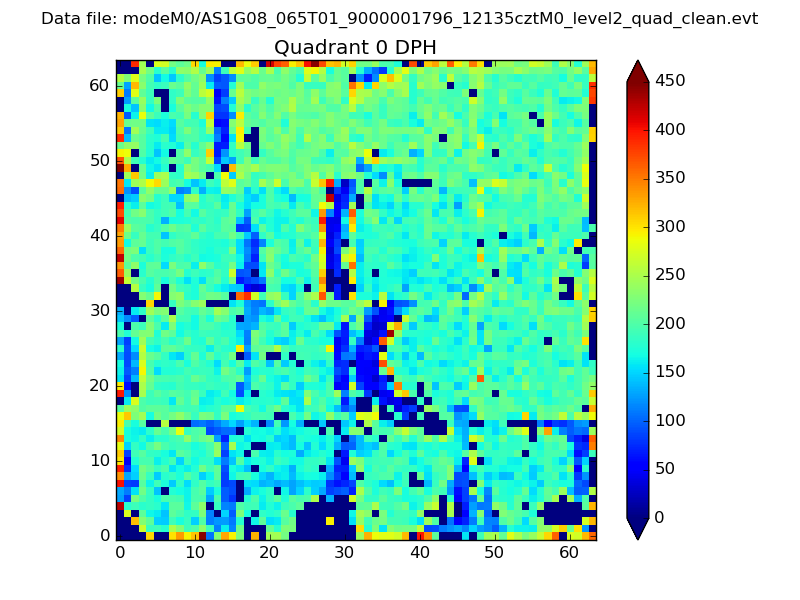 |
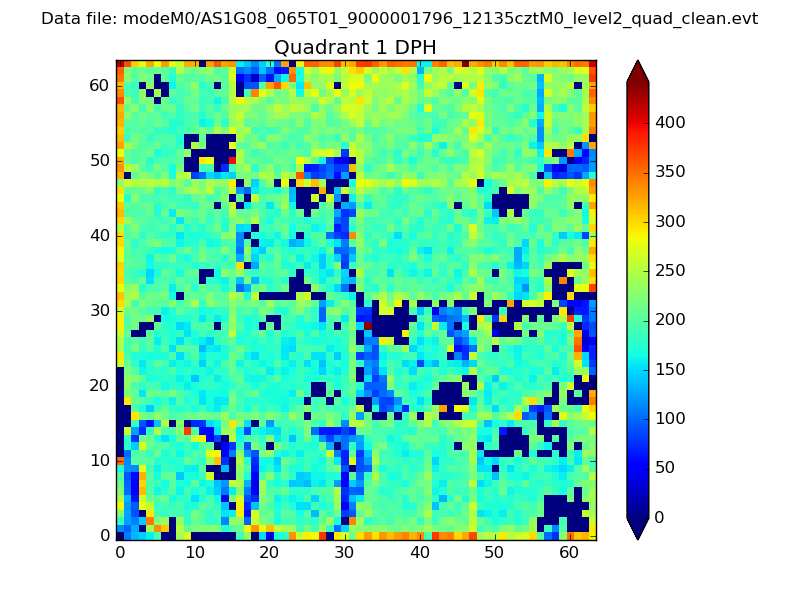 |
Quadrant B |
|---|---|---|---|
| Quadrant D | 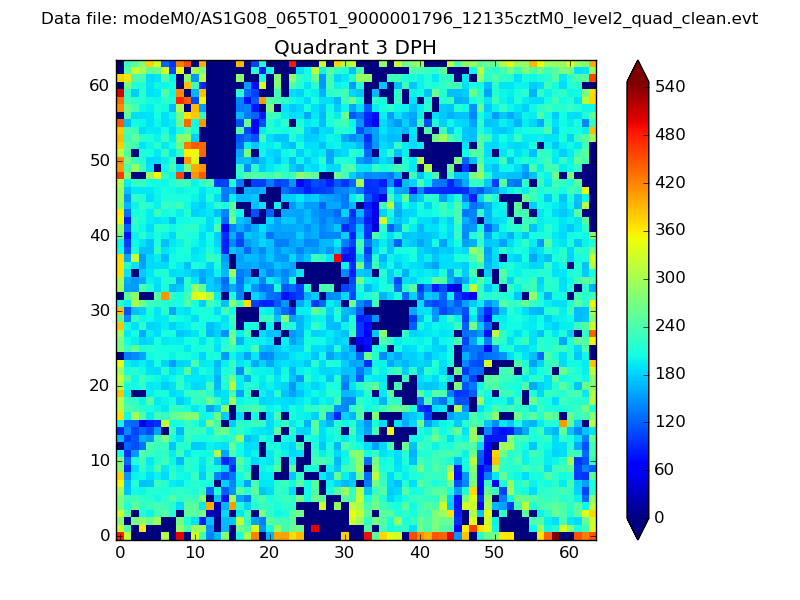 |
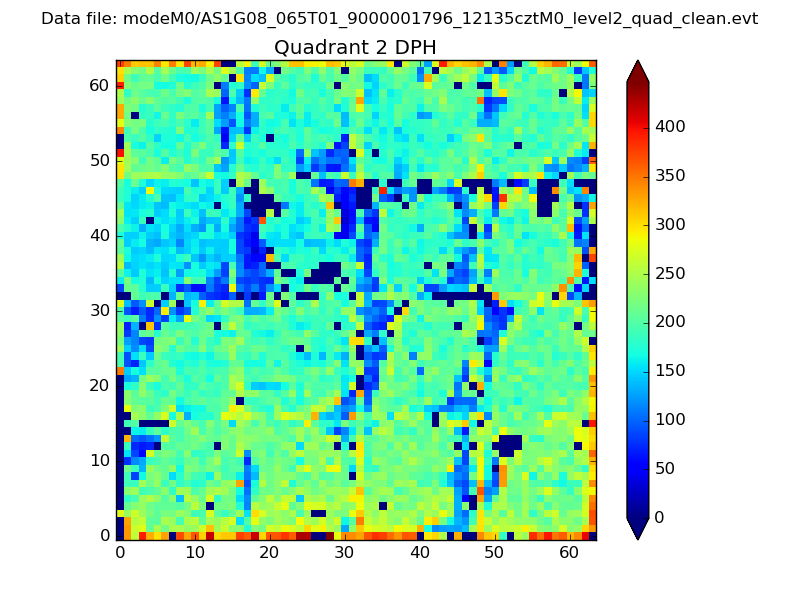 |
Quadrant C |
| Plot type | Count rate plots | Images |
|---|---|---|
| Comparison with Poisson distribution Blue bars denote a histogram of data divided into 1 sec bins. Red curve is a Poisson curve with rate = median count rate of data. |
 |
 |
| Quadrant-wise count rates Data is divided into 100 sec bins |
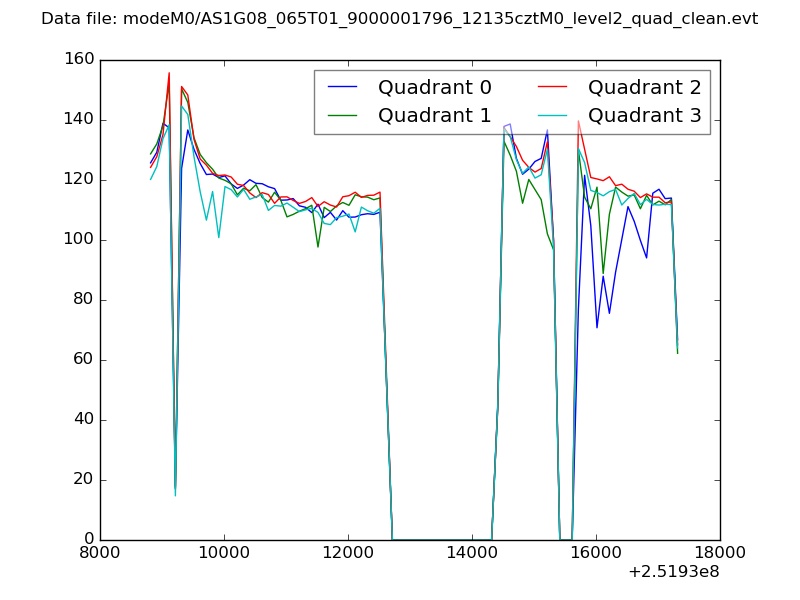 |
|
| Module-wise count rates for Quadrant A Data is divided into 100 sec bins |
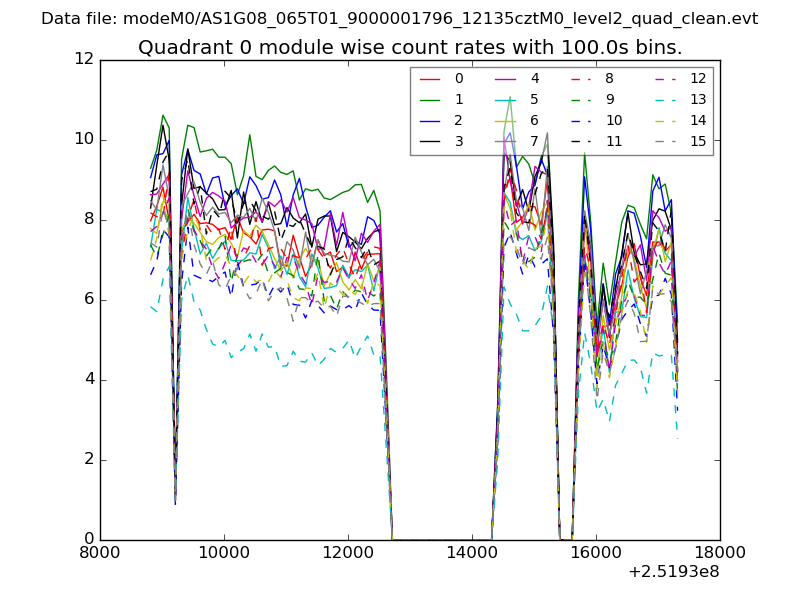 |
 |
| Module-wise count rates for Quadrant B Data is divided into 100 sec bins |
 |
 |
| Module-wise count rates for Quadrant C Data is divided into 100 sec bins |
 |
 |
| Module-wise count rates for Quadrant D Data is divided into 100 sec bins |
 |
 |
| Parameter | Plot |
|---|---|
| CZT HV Monitor |  |
| D_VDD | 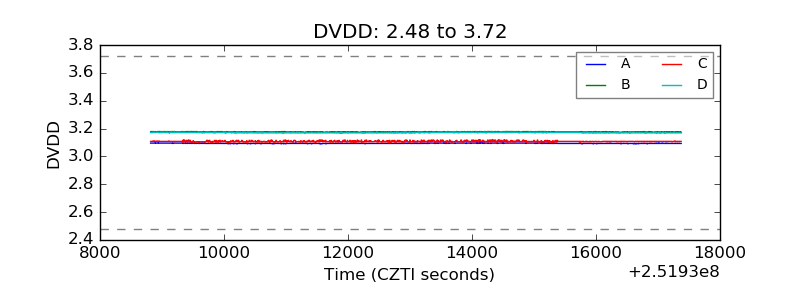 |
| Temperature 1 | 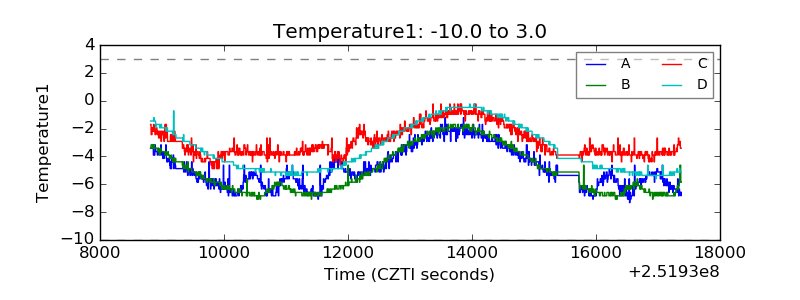 |
| Veto HV Monitor | 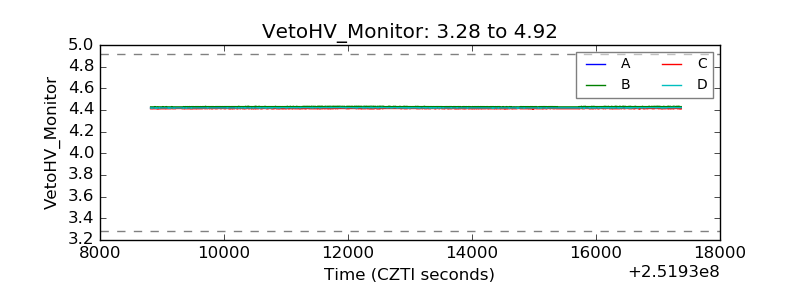 |
| Veto LLD | 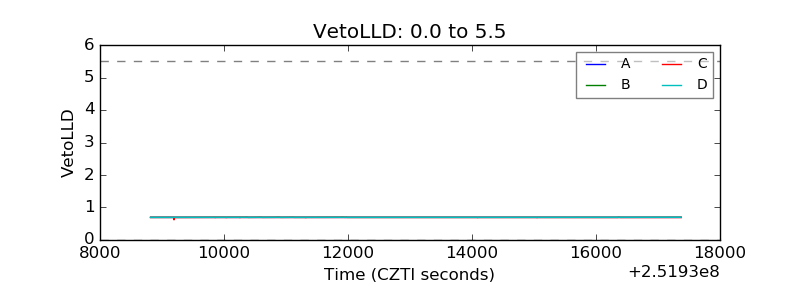 |
| Alpha Counter | 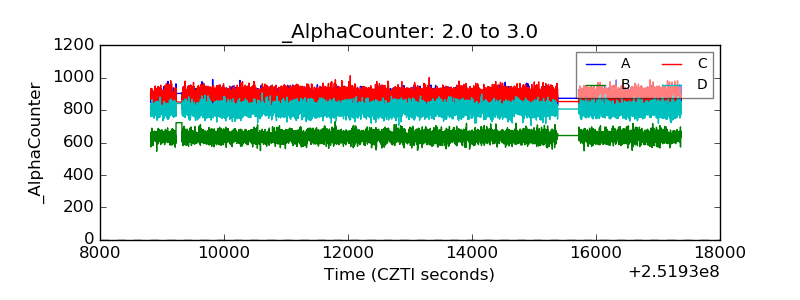 |
| _CPM_Rate | 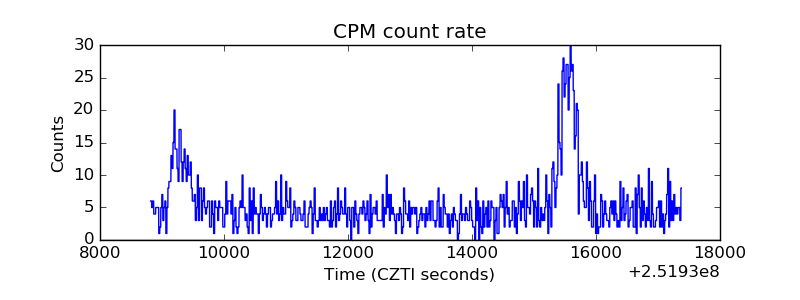 |
| CZT Counter | 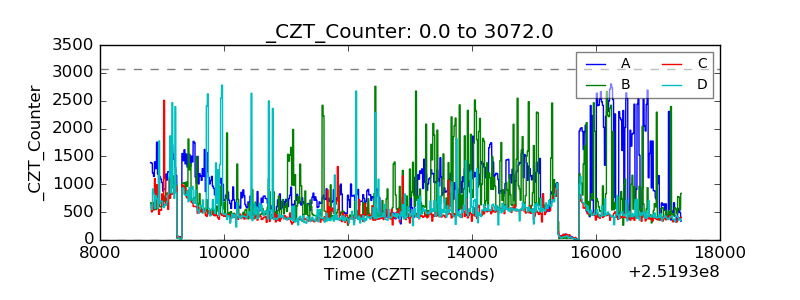 |
| +2.5 Volts monitor |  |
| +5 Volts monitor |  |
| _ROLL_ROT |  |
| _Roll_DEC | 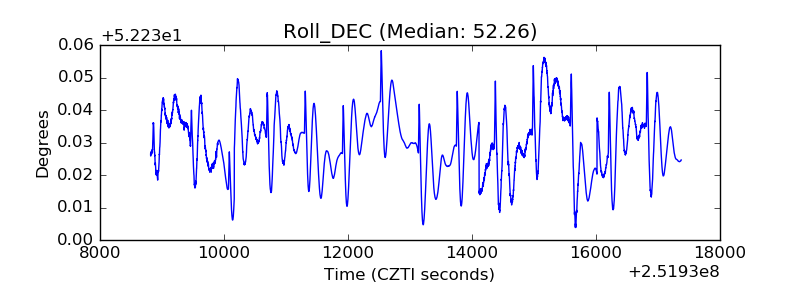 |
| _Roll_RA | 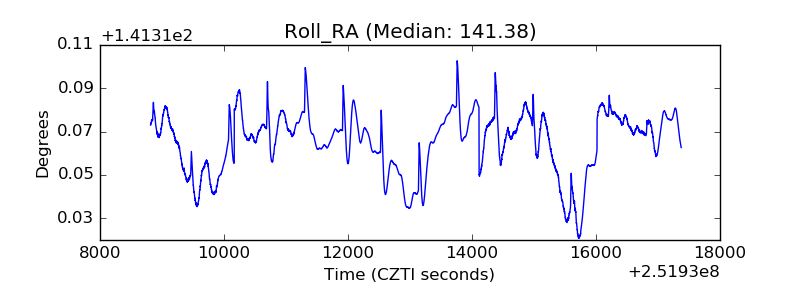 |
| Veto Counter |  |