| Param | Original file | Final file |
|---|---|---|
| Filename | modeM0/AS1G08_065T01_9000001796_12137cztM0_level2.evt | modeM0/AS1G08_065T01_9000001796_12137cztM0_level2_quad_clean.evt |
| Size (bytes) | 1,276,531,200 | 184,006,080 |
| Size | 1.2 GB | 175.5 MB |
| Events in quadrant A | 13,087,176 | 1,129,600 |
| Events in quadrant B | 11,430,222 | 1,145,688 |
| Events in quadrant C | 6,101,318 | 1,201,876 |
| Events in quadrant D | 7,127,199 | 1,159,109 |
| Mode M0 | |||
|---|---|---|---|
| Quadrant | BADHDUFLAG | Total packets | Discarded packets |
| A | 0 | 48107 | 4 |
| B | 0 | 43108 | 3 |
| C | 0 | 27827 | 3 |
| D | 0 | 30570 | 3 |
| Mode M9 | |||
|---|---|---|---|
| Quadrant | BADHDUFLAG | Total packets | Discarded packets |
| A | 0 | 16 | 0 |
| B | 0 | 16 | 0 |
| C | 0 | 16 | 0 |
| D | 0 | 16 | 0 |
| Mode SS | |||
|---|---|---|---|
| Quadrant | BADHDUFLAG | Total packets | Discarded packets |
| A | 0 | 278 | 0 |
| B | 0 | 278 | 0 |
| C | 0 | 278 | 0 |
| D | 0 | 278 | 0 |
| Quadrant | Total seconds | Saturated seconds | Saturation percentage |
|---|---|---|---|
| A | 13541 | 2633 | 19.444650% |
| B | 13541 | 1429 | 10.553135% |
| C | 13541 | 60 | 0.443099% |
| D | 13541 | 191 | 1.410531% |
Noise dominated data is calculated using 1-second bins in cleaned event files. If a bin has >2000 counts, and if more than 50% of those come from <1% of pixels, then it is considered to be noise-dominated and hence unusable.
| Quadrant | # 1 sec bins | Bins with >0 counts | Bins with >2000 counts | High rate bins dominated by noise | Noise dominated (total time) | Noise dominated (detector-on time) | Marked lightcurve |
|---|---|---|---|---|---|---|---|
| A | 15132 | 13545 | 2214 | 2214 | 14.63% | 16.35% | 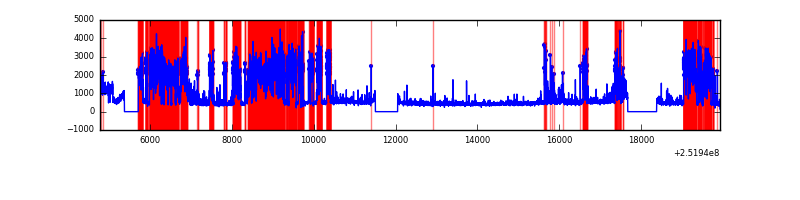 |
| B | 15132 | 13544 | 912 | 912 | 6.03% | 6.73% | 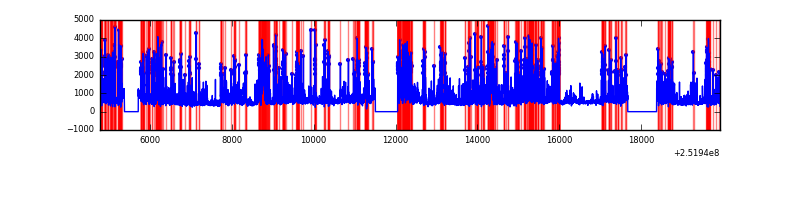 |
| C | 15132 | 13545 | 7 | 7 | 0.05% | 0.05% | 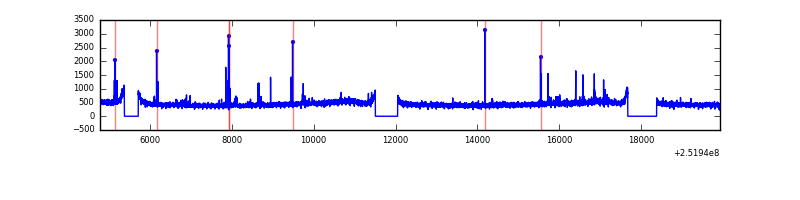 |
| D | 15132 | 13545 | 137 | 137 | 0.91% | 1.01% | 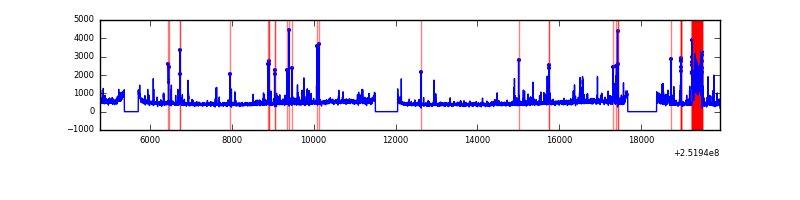 |
Top three noisy pixels from each quadrant. If the there are fewer than three noisy pixels in the level2.evt file, extra rows are filled as -1
| Pixel properties | Quadrant properties | ||||||
|---|---|---|---|---|---|---|---|
| Quadrant | DetID | PixID | Counts | Sigma | Mean | Median | Sigma |
| A | 14 | 63 | 6781726 | 22704.88 | 1482 | 1450 | 298.6 |
| A | 1 | 162 | 186964 | 621.22 | 1482 | 1450 | 298.6 |
| A | 13 | 248 | 158237 | 525.03 | 1482 | 1450 | 298.6 |
| B | 10 | 16 | 2168138 | 7533.61 | 1512 | 1472 | 287.6 |
| B | 4 | 239 | 1725797 | 5995.57 | 1512 | 1472 | 287.6 |
| B | 3 | 64 | 574685 | 1993.09 | 1512 | 1472 | 287.6 |
| C | 15 | 208 | 88607 | 245.89 | 1531 | 1534 | 354.1 |
| C | 14 | 234 | 18560 | 48.08 | 1531 | 1534 | 354.1 |
| C | 3 | 233 | 14661 | 37.07 | 1531 | 1534 | 354.1 |
| D | 1 | 52 | 776574 | 2120.12 | 1523 | 1483 | 365.6 |
| D | 8 | 195 | 226325 | 615.02 | 1523 | 1483 | 365.6 |
| D | 13 | 104 | 112784 | 304.44 | 1523 | 1483 | 365.6 |
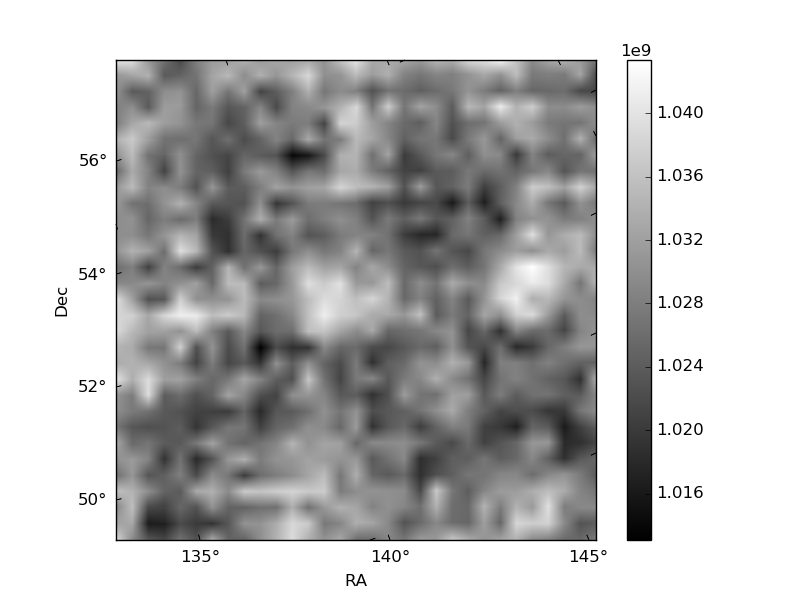
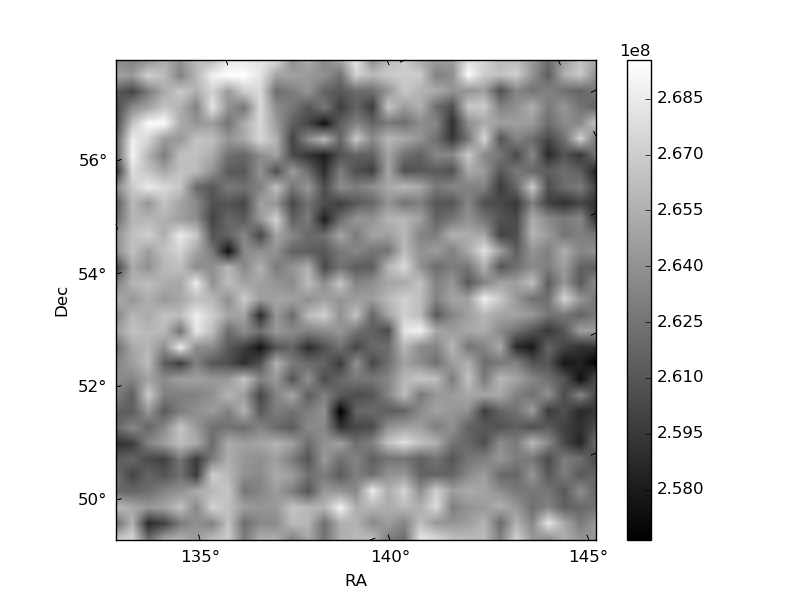
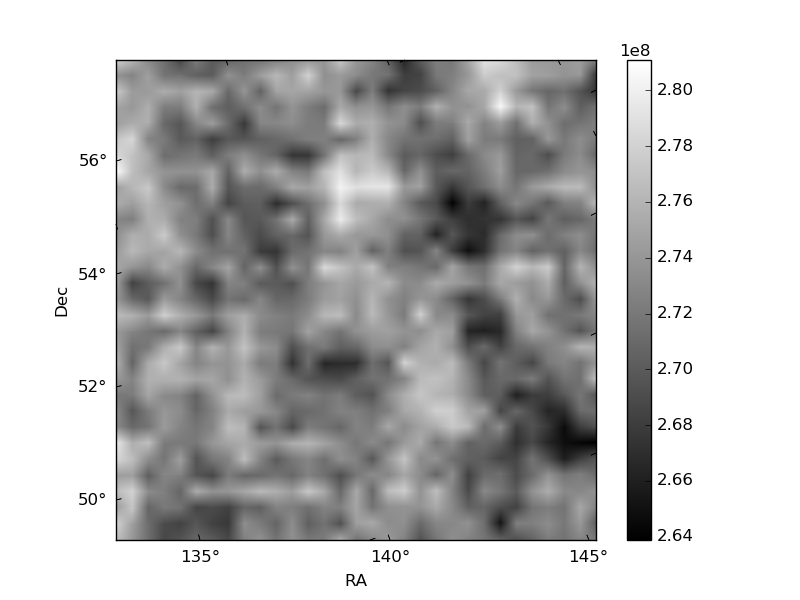
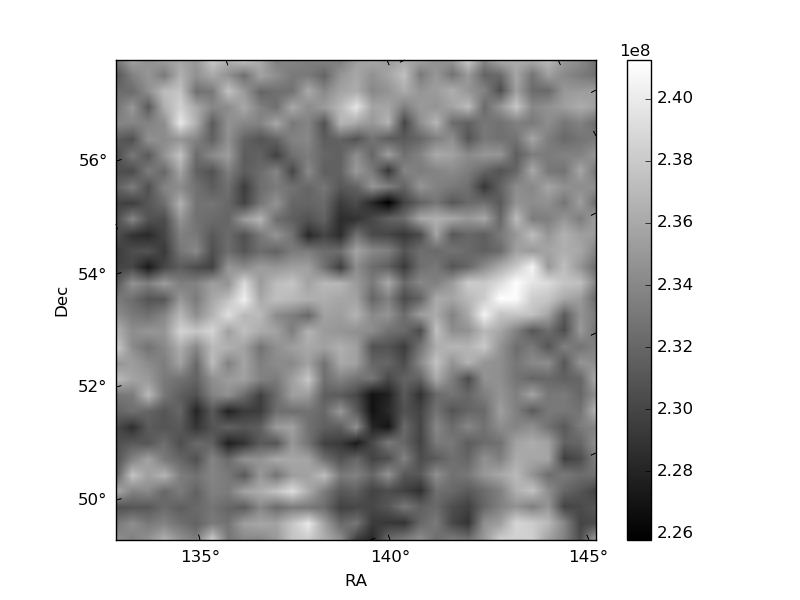
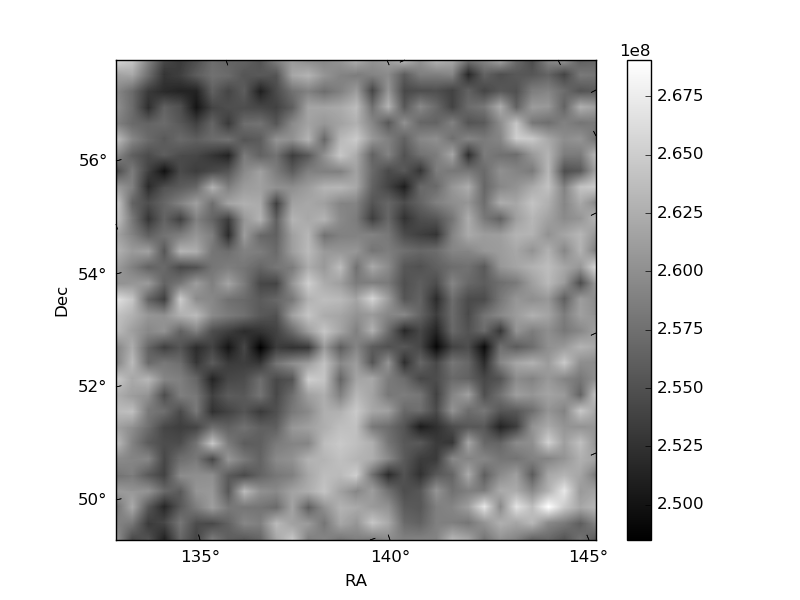
Histogram calculated using DETX and DETY for each event in the final _common_clean file
| Quadrant A | 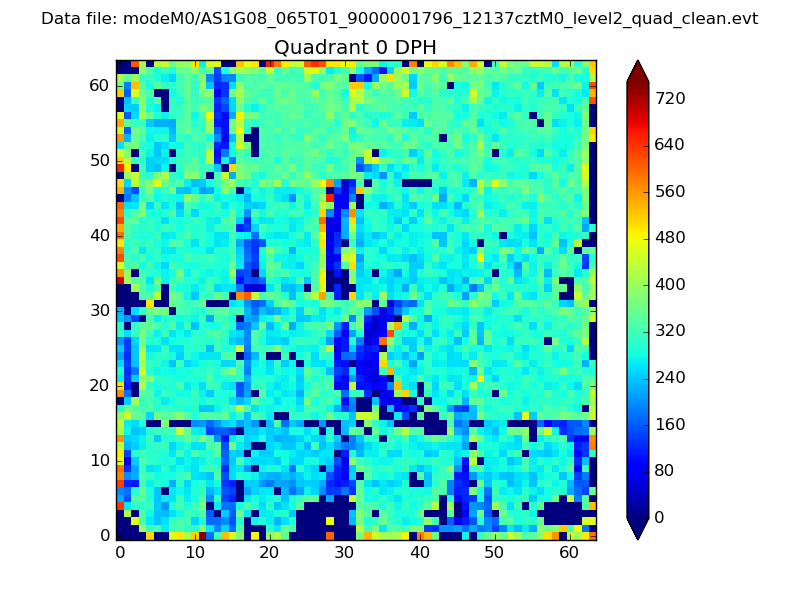 |
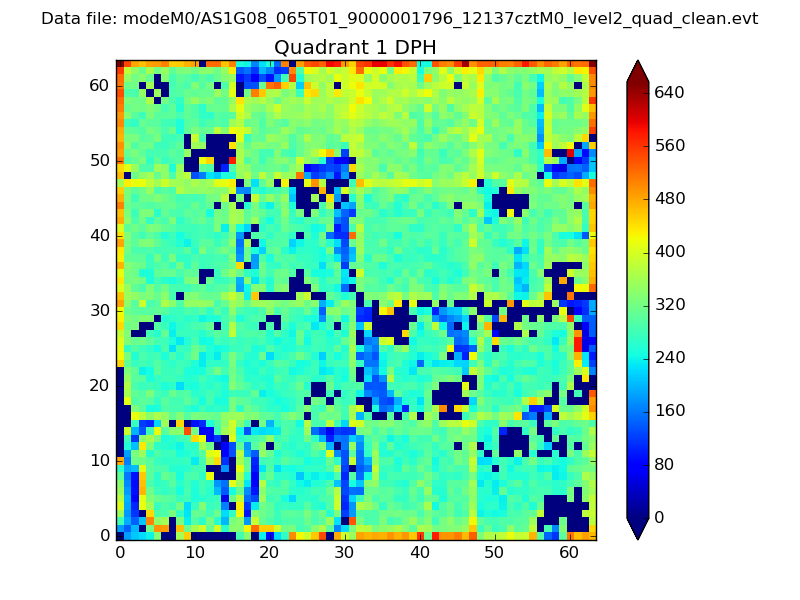 |
Quadrant B |
|---|---|---|---|
| Quadrant D | 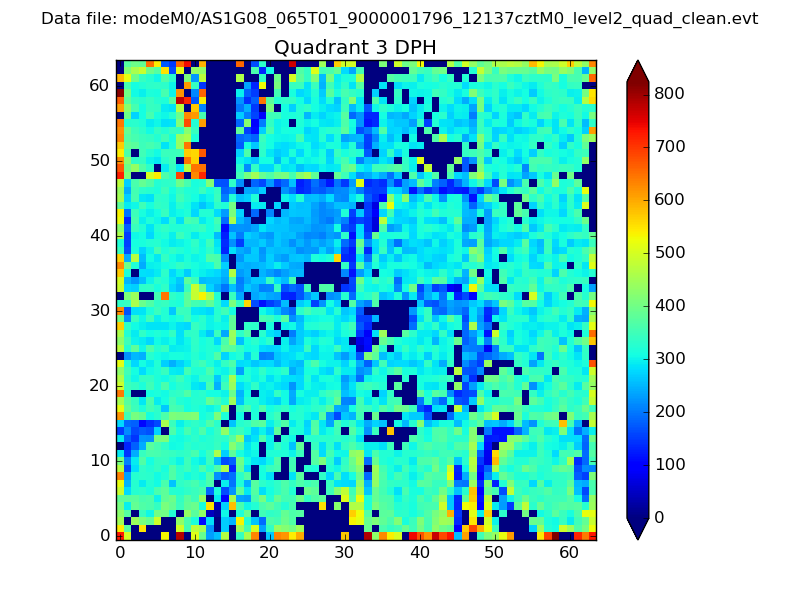 |
 |
Quadrant C |
| Plot type | Count rate plots | Images |
|---|---|---|
| Comparison with Poisson distribution Blue bars denote a histogram of data divided into 1 sec bins. Red curve is a Poisson curve with rate = median count rate of data. |
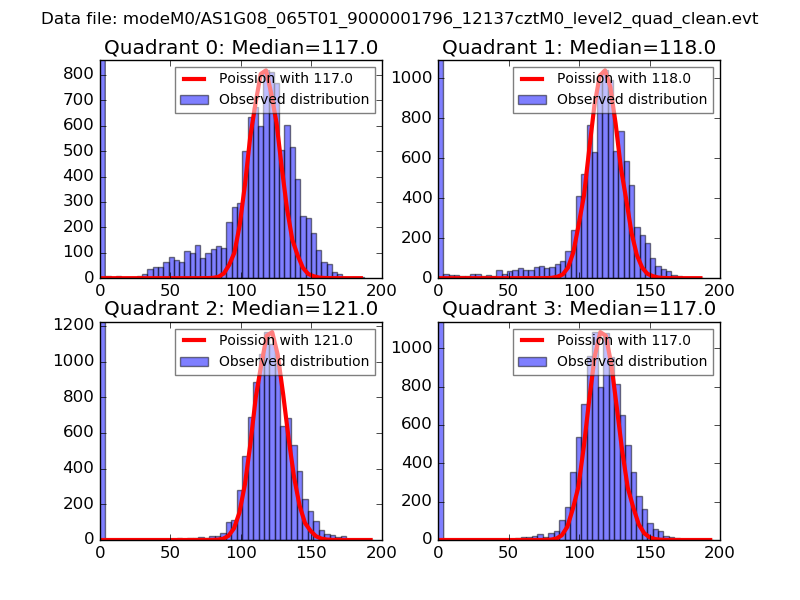 |
 |
| Quadrant-wise count rates Data is divided into 100 sec bins |
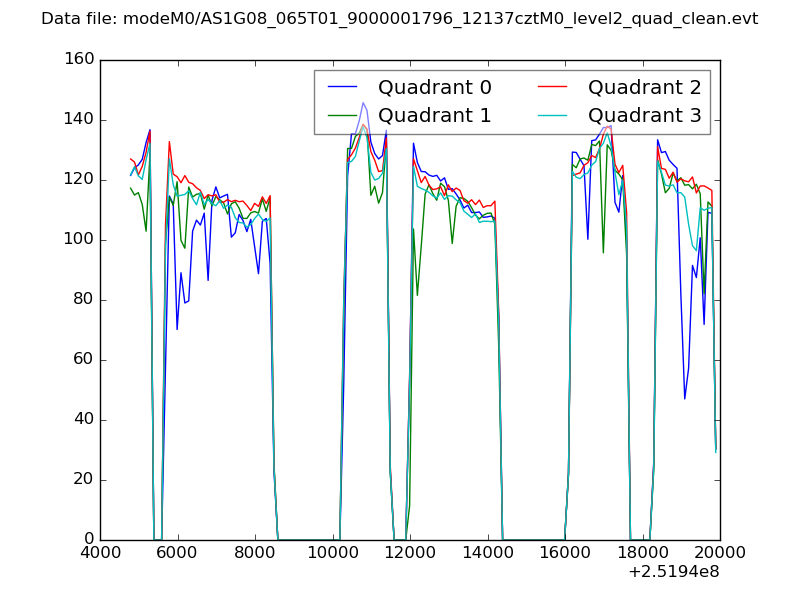 |
|
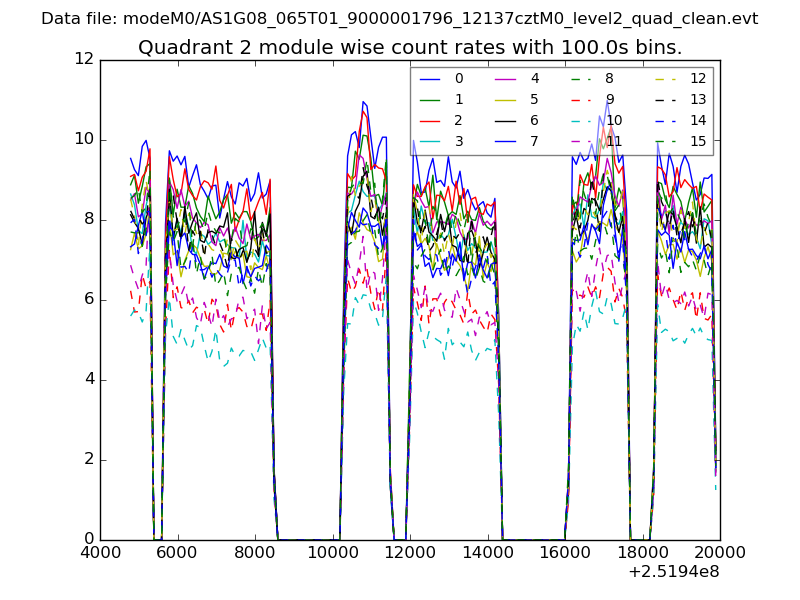
| Module-wise count rates for Quadrant A Data is divided into 100 sec bins |
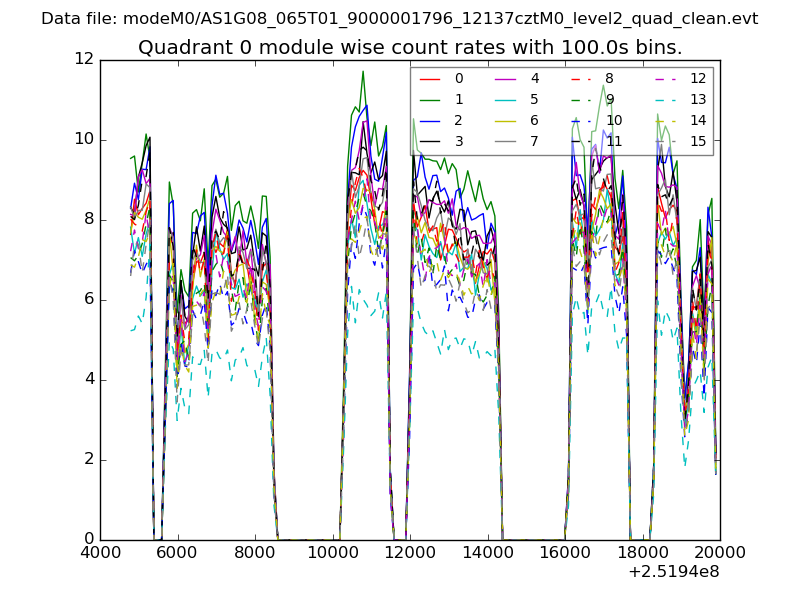 |
 |
| Module-wise count rates for Quadrant B Data is divided into 100 sec bins |
 |
 |
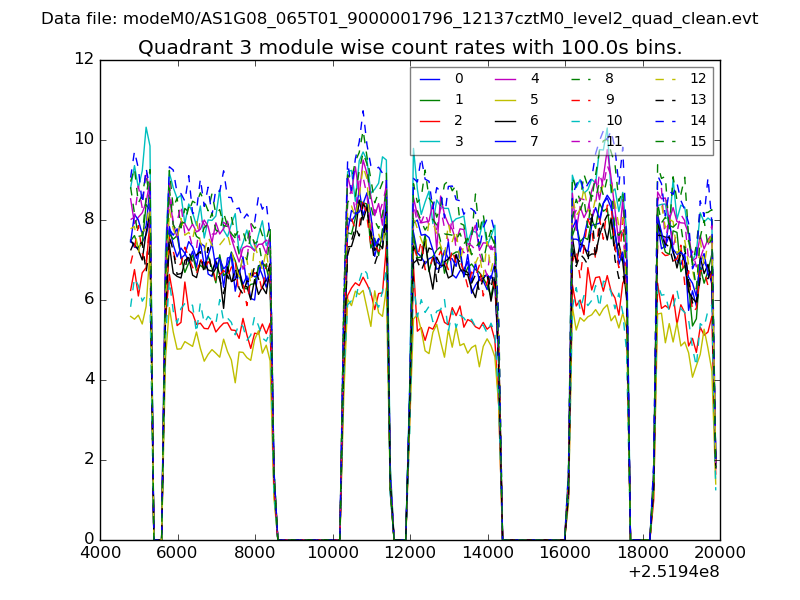
| Module-wise count rates for Quadrant C Data is divided into 100 sec bins |
 |
 |
| Module-wise count rates for Quadrant D Data is divided into 100 sec bins |
 |
 |
| Parameter | Plot |
|---|---|
| CZT HV Monitor | 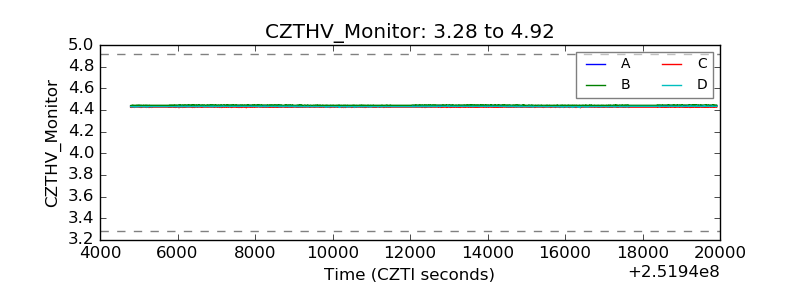 |
| D_VDD | 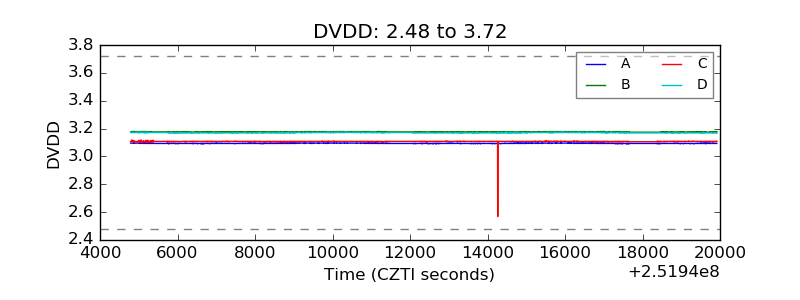 |
| Temperature 1 | 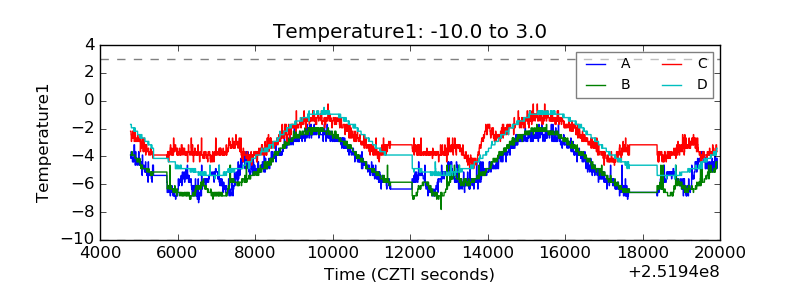 |
| Veto HV Monitor | 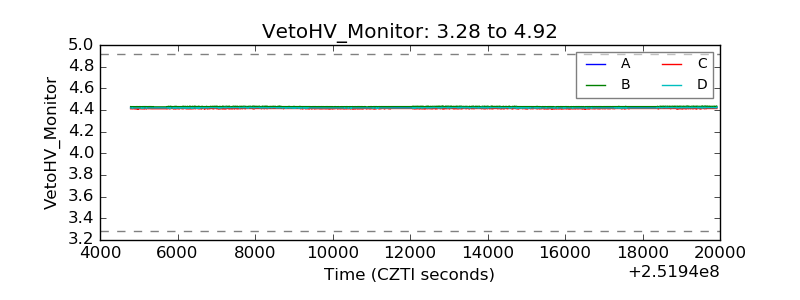 |
| Veto LLD | 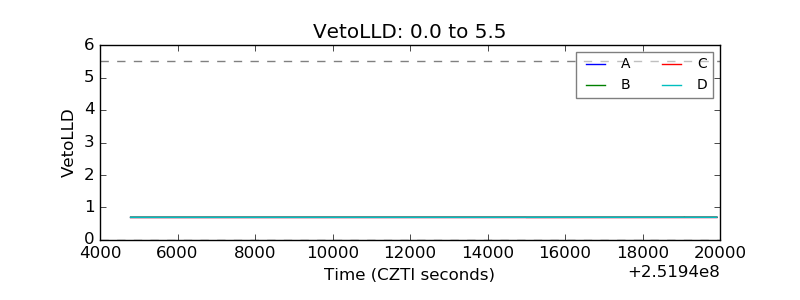 |
| Alpha Counter | 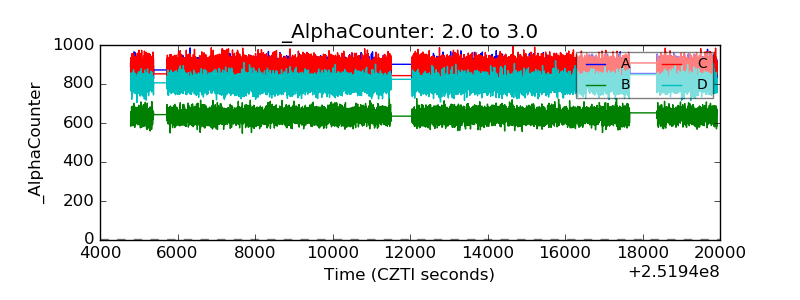 |
| _CPM_Rate | 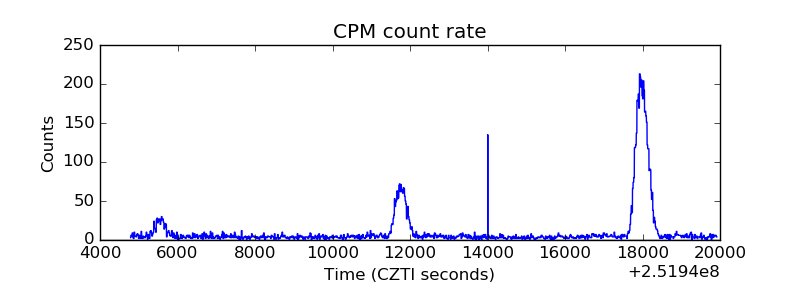 |
| CZT Counter |  |
| +2.5 Volts monitor | 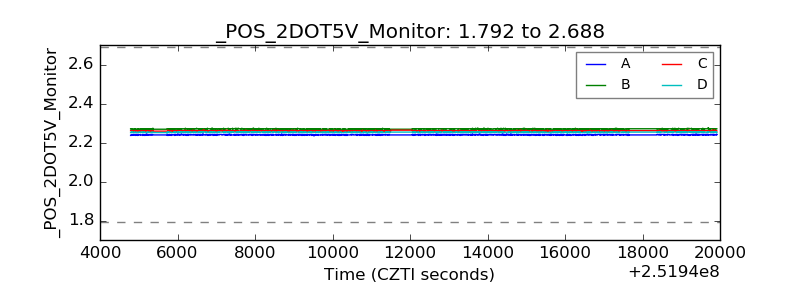 |
| +5 Volts monitor | 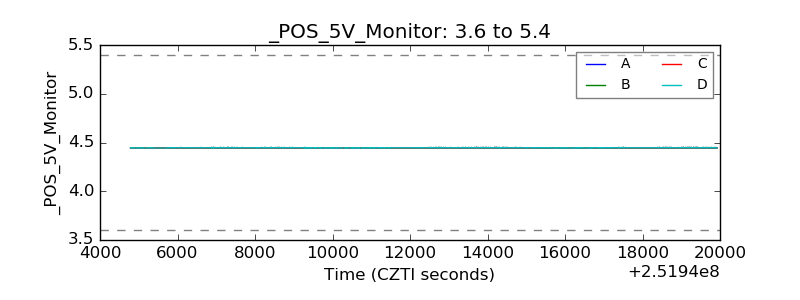 |
| _ROLL_ROT | 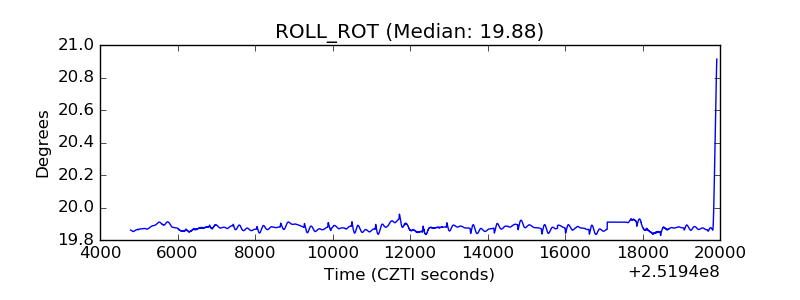 |
| _Roll_DEC | 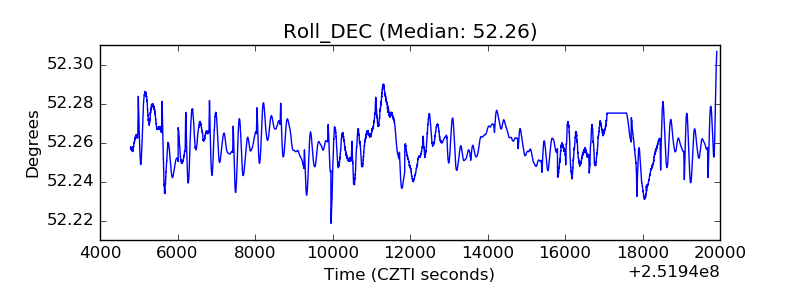 |
| _Roll_RA | 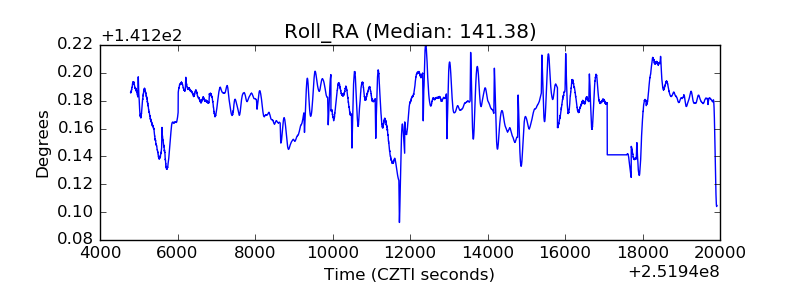 |
| Veto Counter | 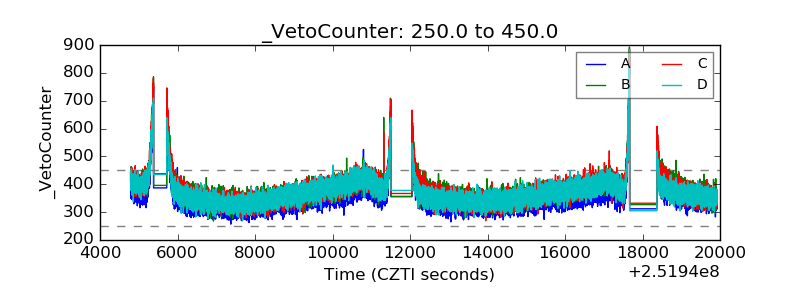 |