| Param | Original file | Final file |
|---|---|---|
| Filename | modeM0/AS1G08_065T01_9000001796_12138cztM0_level2.evt | modeM0/AS1G08_065T01_9000001796_12138cztM0_level2_quad_clean.evt |
| Size (bytes) | 677,442,240 | 85,003,200 |
| Size | 646.1 MB | 81.1 MB |
| Events in quadrant A | 8,676,765 | 468,409 |
| Events in quadrant B | 4,778,639 | 551,754 |
| Events in quadrant C | 2,868,554 | 563,467 |
| Events in quadrant D | 3,757,127 | 541,100 |
| Mode M0 | |||
|---|---|---|---|
| Quadrant | BADHDUFLAG | Total packets | Discarded packets |
| A | 0 | 30031 | 2 |
| B | 0 | 18389 | 1 |
| C | 0 | 13111 | 1 |
| D | 0 | 15514 | 1 |
| Mode M9 | |||
|---|---|---|---|
| Quadrant | BADHDUFLAG | Total packets | Discarded packets |
| A | 0 | 9 | 0 |
| B | 0 | 9 | 0 |
| C | 0 | 9 | 0 |
| D | 0 | 9 | 0 |
| Mode SS | |||
|---|---|---|---|
| Quadrant | BADHDUFLAG | Total packets | Discarded packets |
| A | 0 | 130 | 0 |
| B | 0 | 130 | 0 |
| C | 0 | 130 | 0 |
| D | 0 | 130 | 0 |
| Quadrant | Total seconds | Saturated seconds | Saturation percentage |
|---|---|---|---|
| A | 6428 | 2499 | 38.876789% |
| B | 6428 | 421 | 6.549471% |
| C | 6428 | 37 | 0.575607% |
| D | 6428 | 160 | 2.489110% |
Noise dominated data is calculated using 1-second bins in cleaned event files. If a bin has >2000 counts, and if more than 50% of those come from <1% of pixels, then it is considered to be noise-dominated and hence unusable.
| Quadrant | # 1 sec bins | Bins with >0 counts | Bins with >2000 counts | High rate bins dominated by noise | Noise dominated (total time) | Noise dominated (detector-on time) | Marked lightcurve |
|---|---|---|---|---|---|---|---|
| A | 7314 | 6429 | 2164 | 2164 | 29.59% | 33.66% | 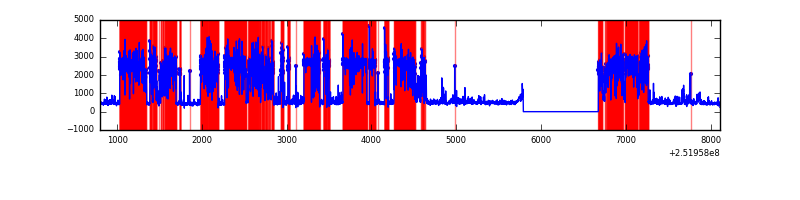 |
| B | 7314 | 6429 | 226 | 226 | 3.09% | 3.52% | 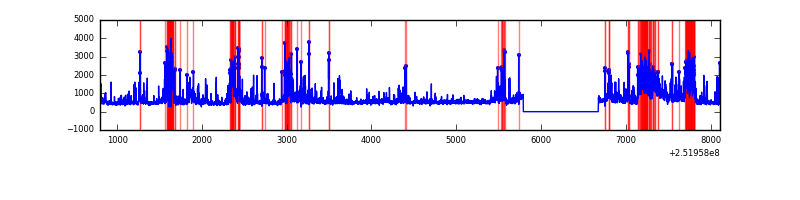 |
| C | 7314 | 6430 | 6 | 6 | 0.08% | 0.09% |  |
| D | 7314 | 6429 | 135 | 135 | 1.85% | 2.10% | 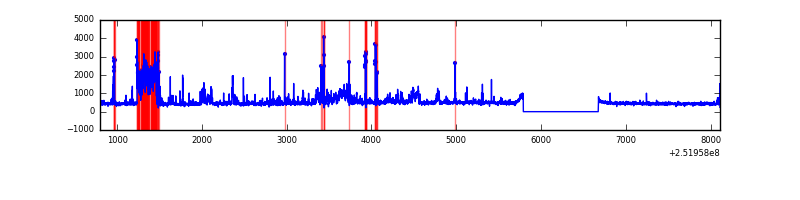 |
Top three noisy pixels from each quadrant. If the there are fewer than three noisy pixels in the level2.evt file, extra rows are filled as -1
| Pixel properties | Quadrant properties | ||||||
|---|---|---|---|---|---|---|---|
| Quadrant | DetID | PixID | Counts | Sigma | Mean | Median | Sigma |
| A | 14 | 63 | 5930415 | 47704.39 | 611 | 599 | 124.3 |
| A | 1 | 162 | 142180 | 1139.0 | 611 | 599 | 124.3 |
| A | 1 | 178 | 58876 | 468.83 | 611 | 599 | 124.3 |
| B | 4 | 239 | 1167735 | 8336.84 | 732 | 715 | 140.0 |
| B | 0 | 85 | 248262 | 1768.4 | 732 | 715 | 140.0 |
| B | 3 | 64 | 213365 | 1519.11 | 732 | 715 | 140.0 |
| C | 15 | 208 | 53611 | 317.78 | 719 | 721 | 166.4 |
| C | 13 | 61 | 5155 | 26.64 | 719 | 721 | 166.4 |
| C | 13 | 250 | 4456 | 22.44 | 719 | 721 | 166.4 |
| D | 1 | 52 | 697532 | 4044.17 | 716 | 696 | 172.3 |
| D | 2 | 33 | 153063 | 884.28 | 716 | 696 | 172.3 |
| D | 8 | 195 | 84453 | 486.09 | 716 | 696 | 172.3 |
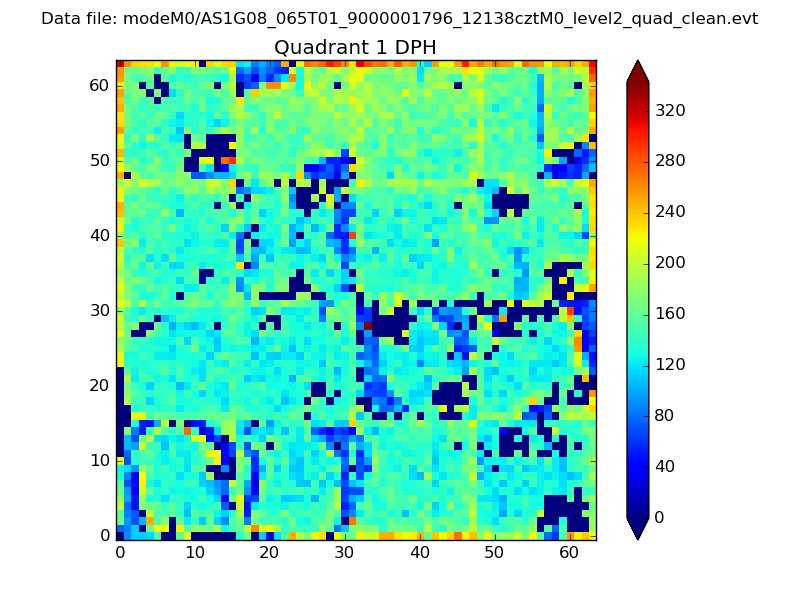
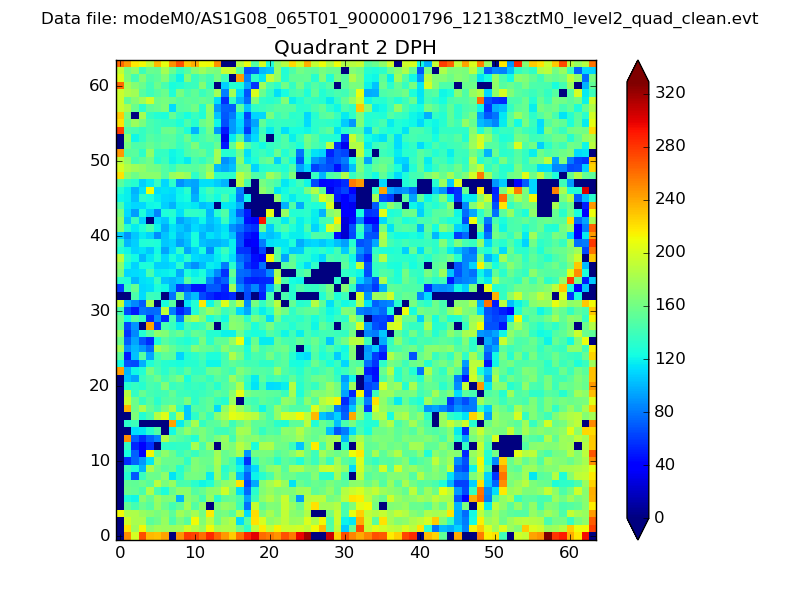
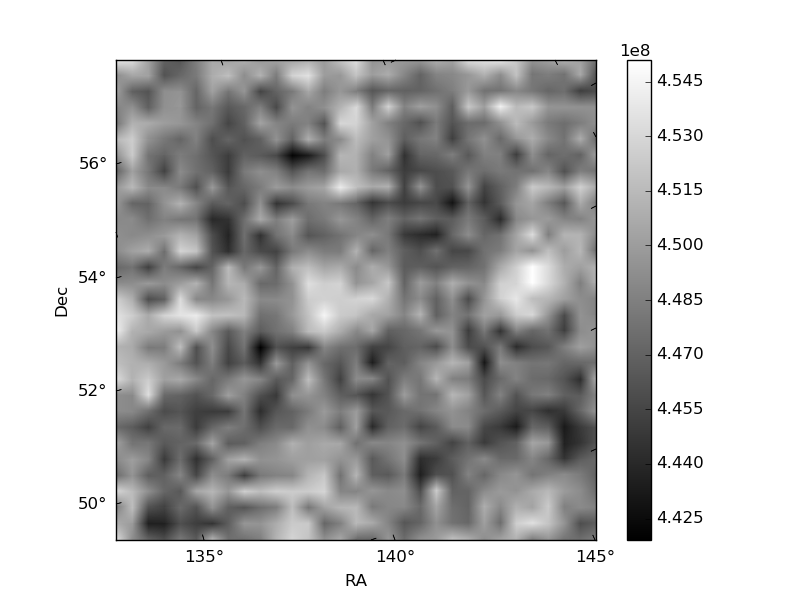
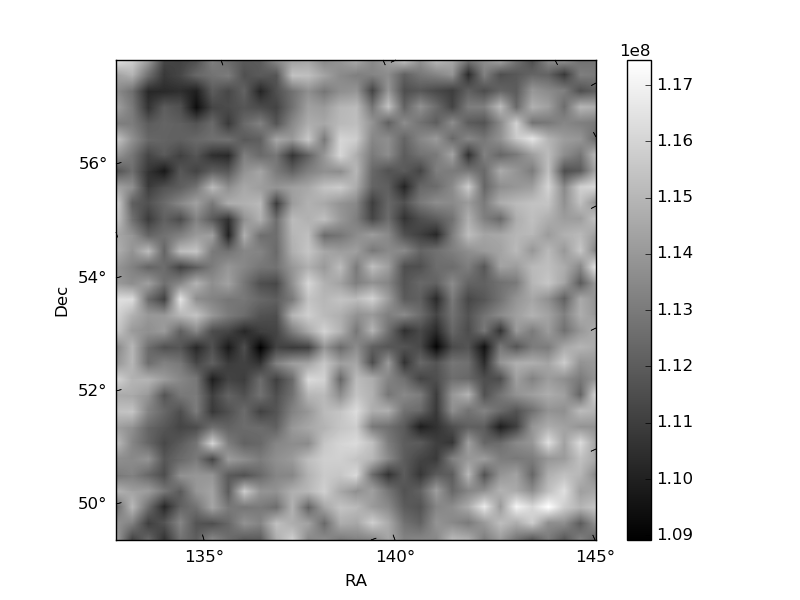
Histogram calculated using DETX and DETY for each event in the final _common_clean file
| Quadrant A | 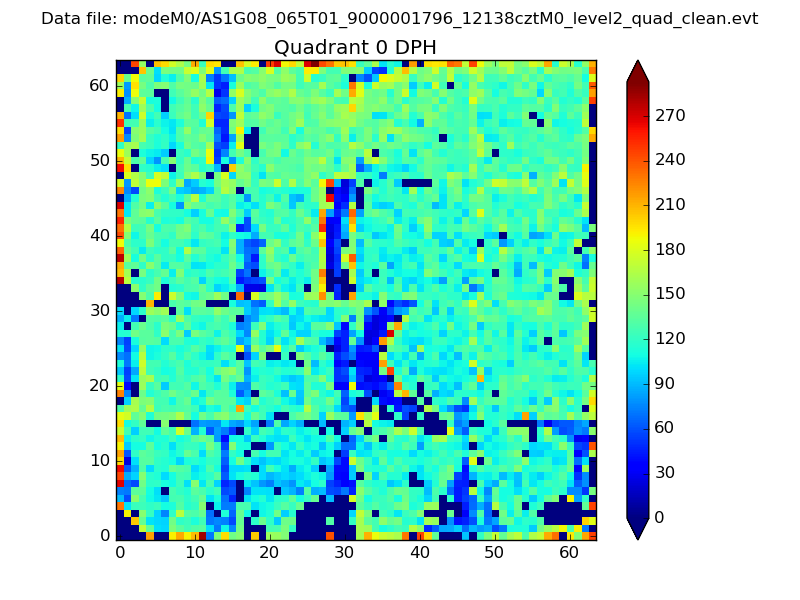 |
 |
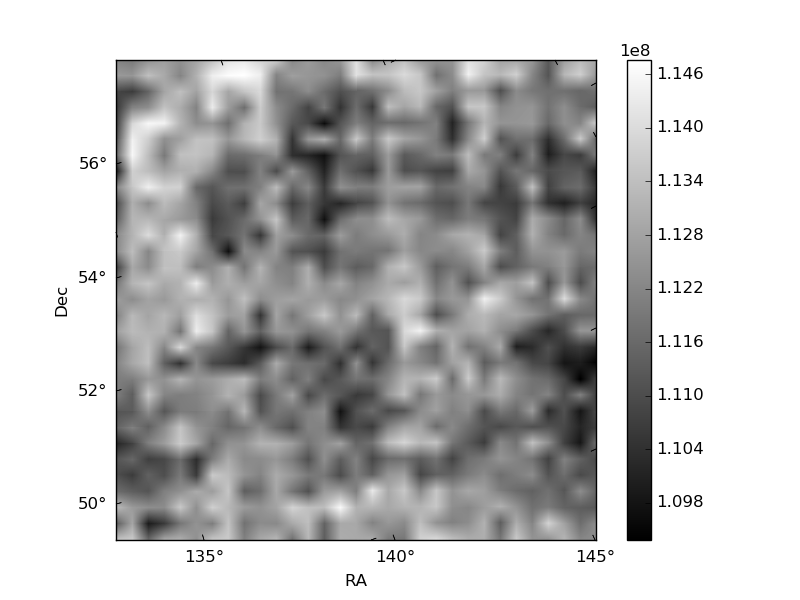
Quadrant B |
|---|---|---|---|
| Quadrant D | 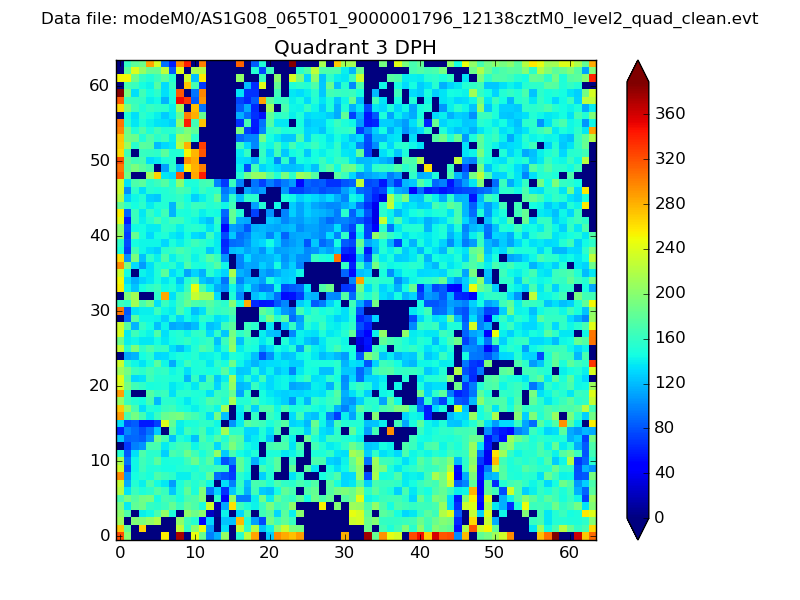 |
 |
Quadrant C |
| Plot type | Count rate plots | Images |
|---|---|---|
| Comparison with Poisson distribution Blue bars denote a histogram of data divided into 1 sec bins. Red curve is a Poisson curve with rate = median count rate of data. |
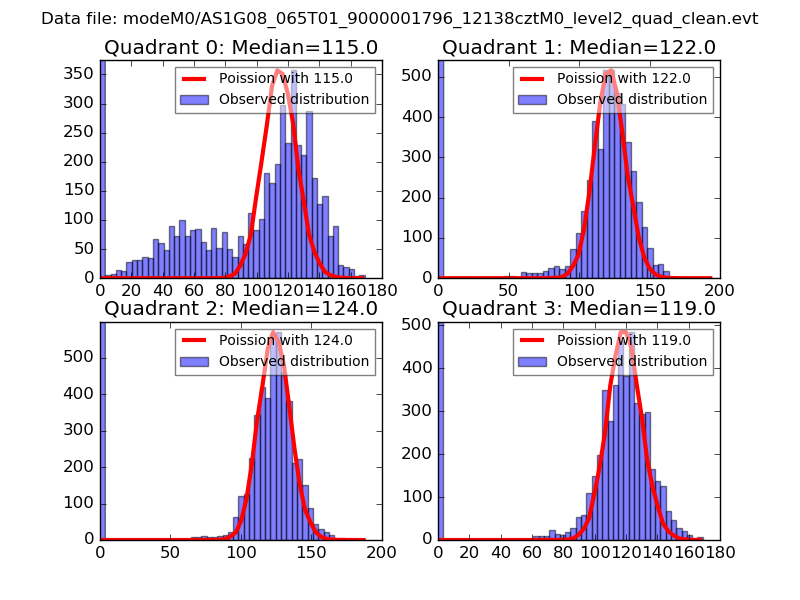 |
 |
| Quadrant-wise count rates Data is divided into 100 sec bins |
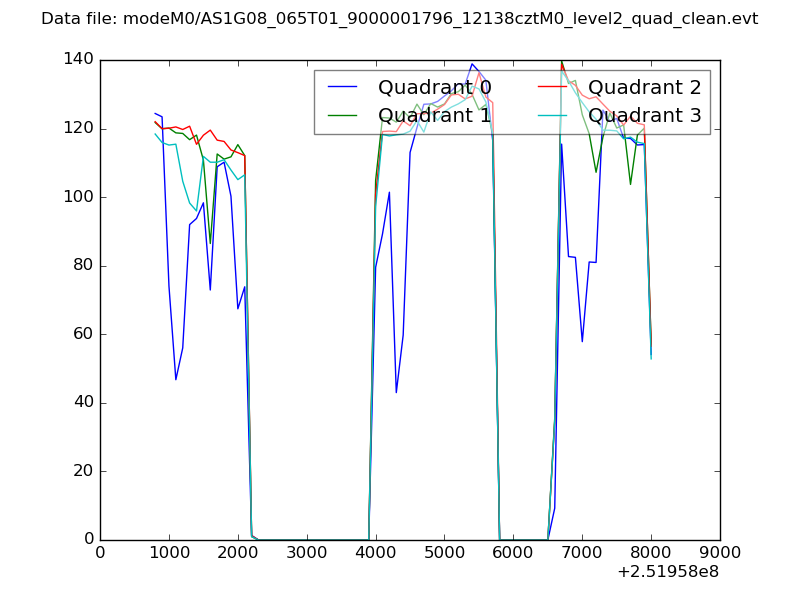 |
|
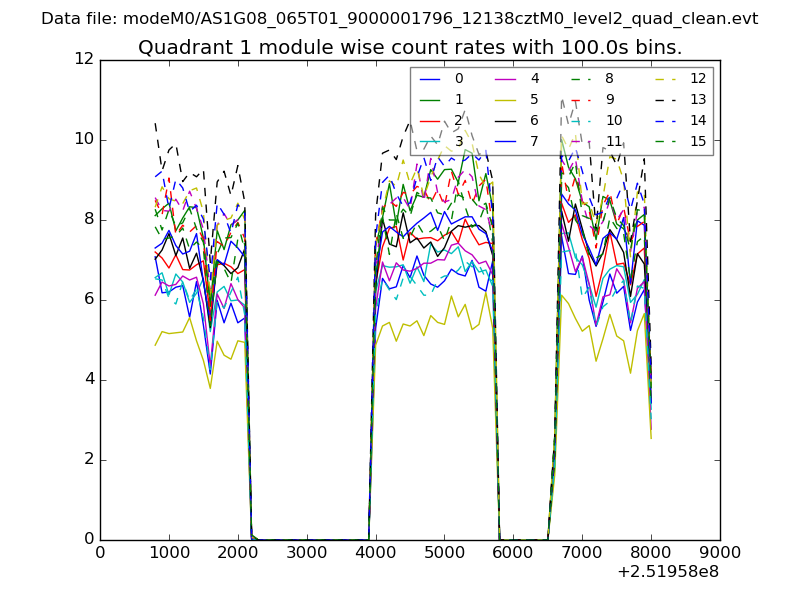
| Module-wise count rates for Quadrant A Data is divided into 100 sec bins |
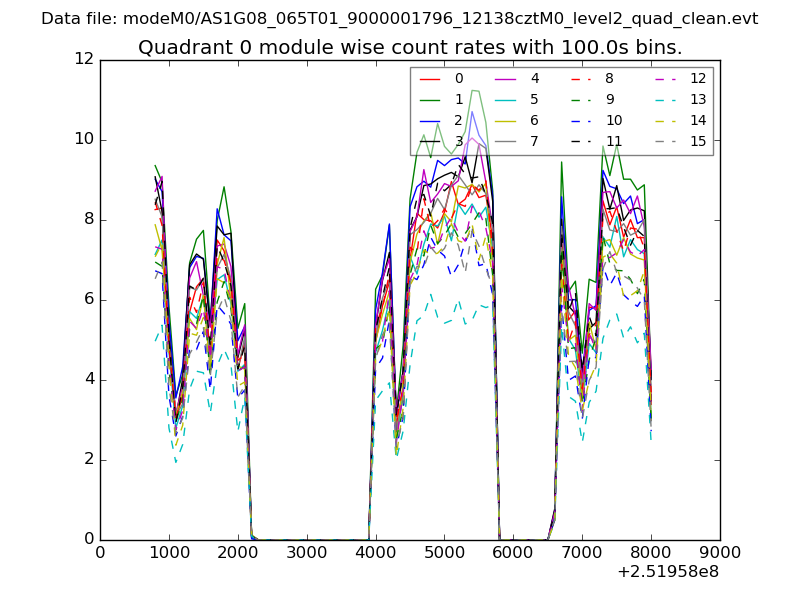 |
 |
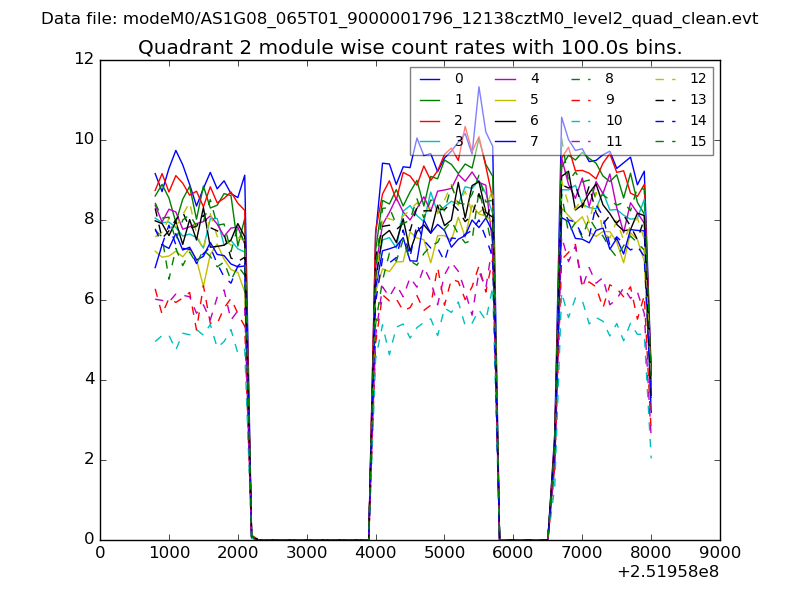
| Module-wise count rates for Quadrant B Data is divided into 100 sec bins |
 |
 |
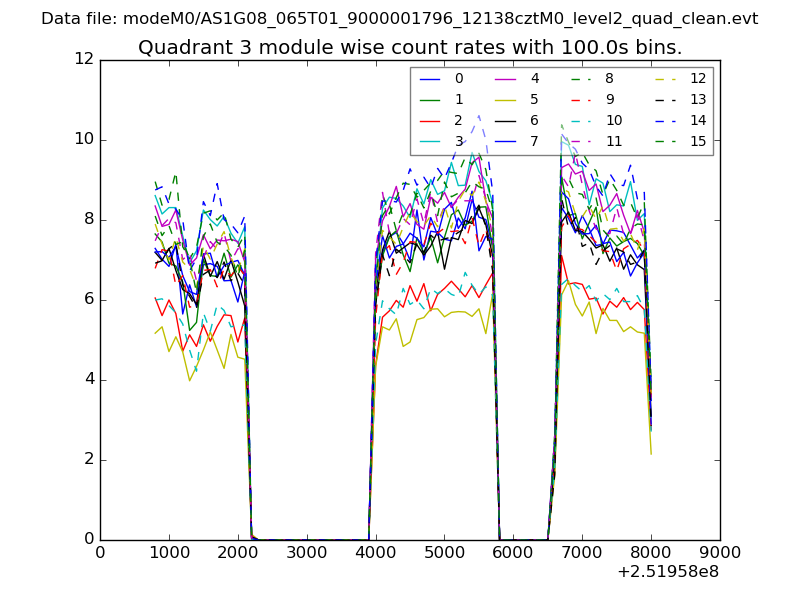
| Module-wise count rates for Quadrant C Data is divided into 100 sec bins |
 |
 |
| Module-wise count rates for Quadrant D Data is divided into 100 sec bins |
 |
 |
| Parameter | Plot |
|---|---|
| CZT HV Monitor | 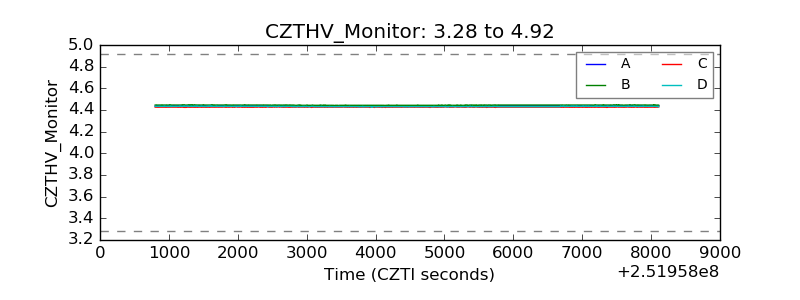 |
| D_VDD | 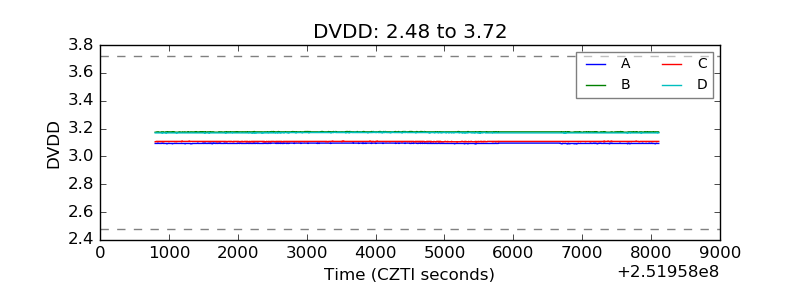 |
| Temperature 1 | 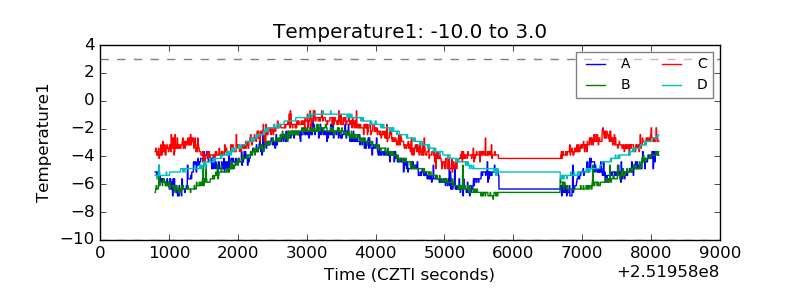 |
| Veto HV Monitor | 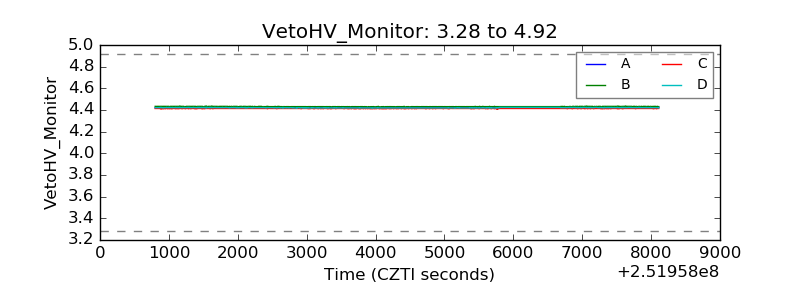 |
| Veto LLD | 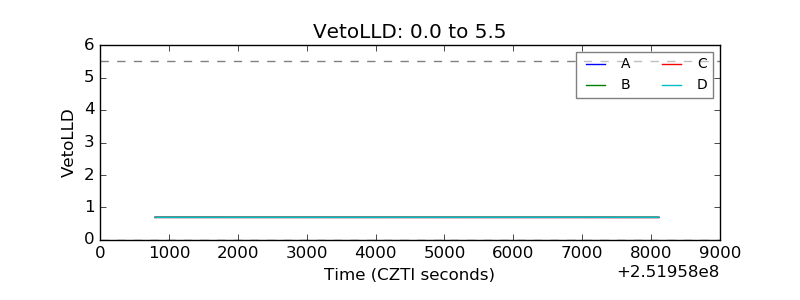 |
| Alpha Counter | 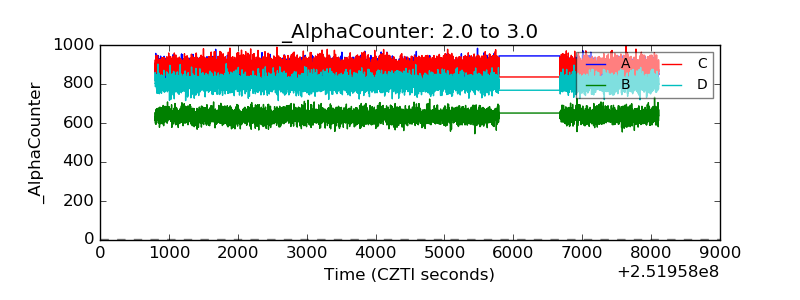 |
| _CPM_Rate | 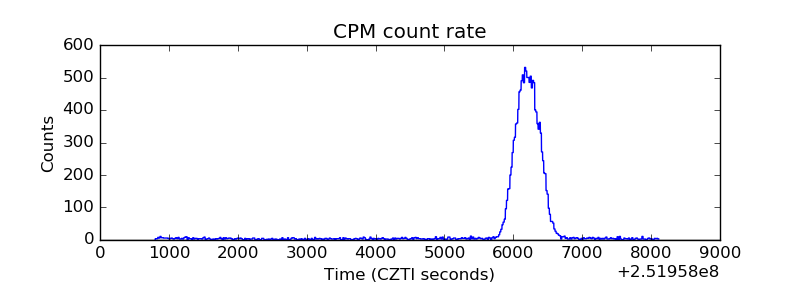 |
| CZT Counter | 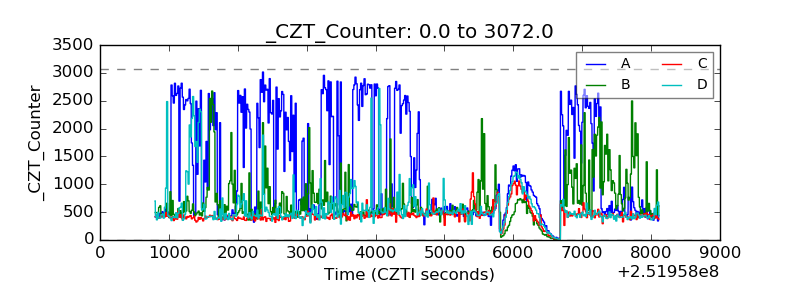 |
| +2.5 Volts monitor | 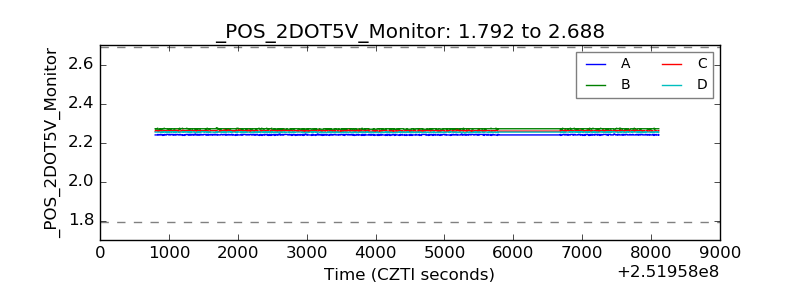 |
| +5 Volts monitor |  |
| _ROLL_ROT | 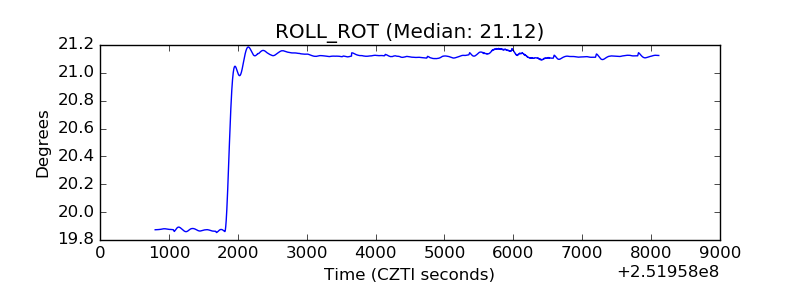 |
| _Roll_DEC | 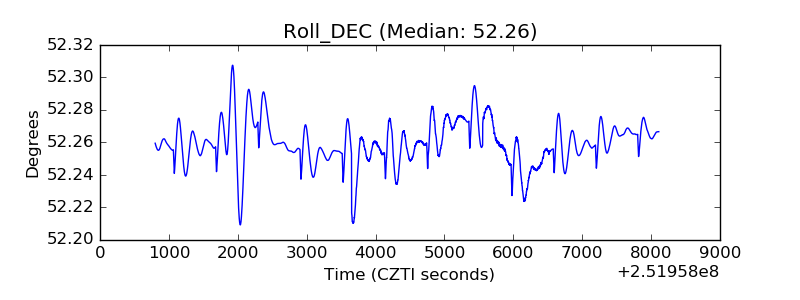 |
| _Roll_RA | 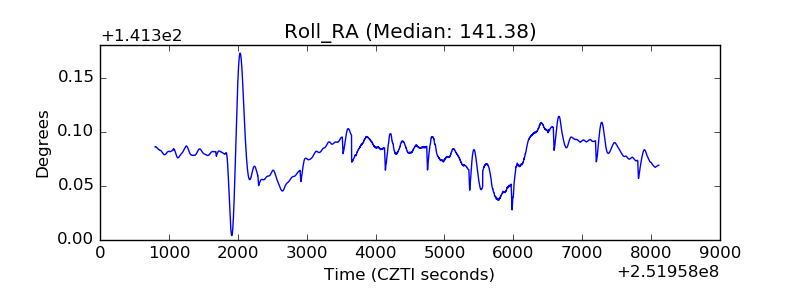 |
| Veto Counter | 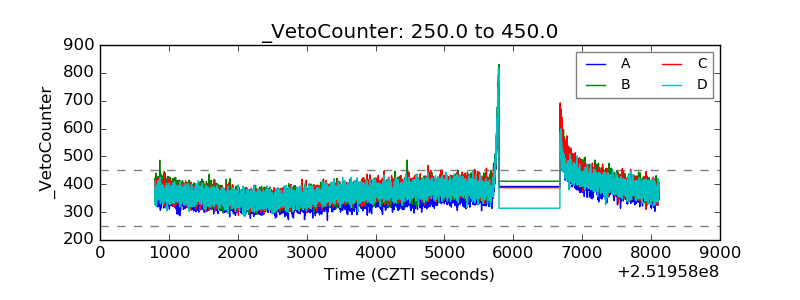 |