| Param | Original file | Final file |
|---|---|---|
| Filename | modeM0/AS1G08_065T01_9000001796_12139cztM0_level2.evt | modeM0/AS1G08_065T01_9000001796_12139cztM0_level2_quad_clean.evt |
| Size (bytes) | 472,844,160 | 75,438,720 |
| Size | 450.9 MB | 71.9 MB |
| Events in quadrant A | 3,804,865 | 457,039 |
| Events in quadrant B | 4,306,876 | 471,274 |
| Events in quadrant C | 2,694,586 | 478,640 |
| Events in quadrant D | 3,111,173 | 462,902 |
| Mode M0 | |||
|---|---|---|---|
| Quadrant | BADHDUFLAG | Total packets | Discarded packets |
| A | 0 | 15165 | 2 |
| B | 0 | 16697 | 1 |
| C | 0 | 12068 | 1 |
| D | 0 | 13215 | 1 |
| Mode M9 | |||
|---|---|---|---|
| Quadrant | BADHDUFLAG | Total packets | Discarded packets |
| A | 0 | 10 | 0 |
| B | 0 | 10 | 0 |
| C | 0 | 10 | 0 |
| D | 0 | 10 | 0 |
| Mode SS | |||
|---|---|---|---|
| Quadrant | BADHDUFLAG | Total packets | Discarded packets |
| A | 0 | 122 | 0 |
| B | 0 | 122 | 0 |
| C | 0 | 122 | 0 |
| D | 0 | 122 | 0 |
| Quadrant | Total seconds | Saturated seconds | Saturation percentage |
|---|---|---|---|
| A | 5922 | 420 | 7.092199% |
| B | 5922 | 321 | 5.420466% |
| C | 5922 | 27 | 0.455927% |
| D | 5922 | 66 | 1.114488% |
Noise dominated data is calculated using 1-second bins in cleaned event files. If a bin has >2000 counts, and if more than 50% of those come from <1% of pixels, then it is considered to be noise-dominated and hence unusable.
| Quadrant | # 1 sec bins | Bins with >0 counts | Bins with >2000 counts | High rate bins dominated by noise | Noise dominated (total time) | Noise dominated (detector-on time) | Marked lightcurve |
|---|---|---|---|---|---|---|---|
| A | 6973 | 5924 | 335 | 335 | 4.80% | 5.65% | 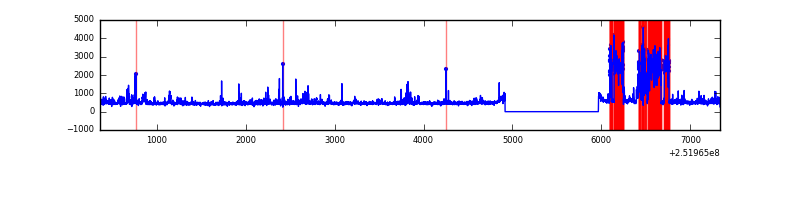 |
| B | 6973 | 5924 | 149 | 149 | 2.14% | 2.52% | 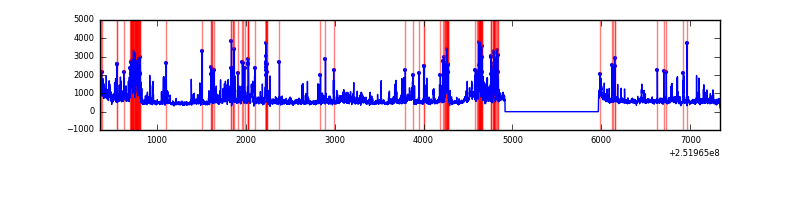 |
| C | 6973 | 5924 | 9 | 9 | 0.13% | 0.15% | 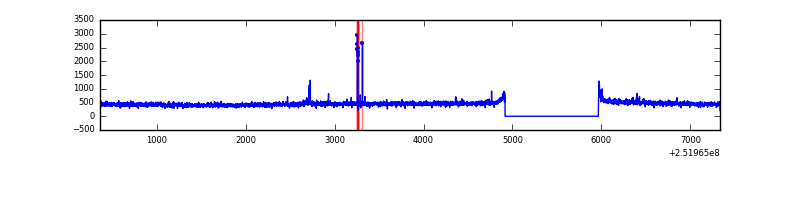 |
| D | 6973 | 5924 | 40 | 40 | 0.57% | 0.68% |  |
Top three noisy pixels from each quadrant. If the there are fewer than three noisy pixels in the level2.evt file, extra rows are filled as -1
| Pixel properties | Quadrant properties | ||||||
|---|---|---|---|---|---|---|---|
| Quadrant | DetID | PixID | Counts | Sigma | Mean | Median | Sigma |
| A | 14 | 63 | 923799 | 6698.89 | 687 | 674 | 137.8 |
| A | 1 | 162 | 58404 | 418.93 | 687 | 674 | 137.8 |
| A | 5 | 16 | 56210 | 403.01 | 687 | 674 | 137.8 |
| B | 4 | 239 | 823556 | 6241.28 | 693 | 675 | 131.8 |
| B | 15 | 201 | 306871 | 2322.4 | 693 | 675 | 131.8 |
| B | 11 | 51 | 124834 | 941.71 | 693 | 675 | 131.8 |
| C | 3 | 233 | 28863 | 179.96 | 678 | 682 | 156.6 |
| C | 15 | 208 | 14872 | 90.61 | 678 | 682 | 156.6 |
| C | 13 | 61 | 4888 | 26.86 | 678 | 682 | 156.6 |
| D | 1 | 52 | 341622 | 2102.0 | 679 | 660 | 162.2 |
| D | 8 | 195 | 75115 | 459.01 | 679 | 660 | 162.2 |
| D | 10 | 50 | 43276 | 262.72 | 679 | 660 | 162.2 |
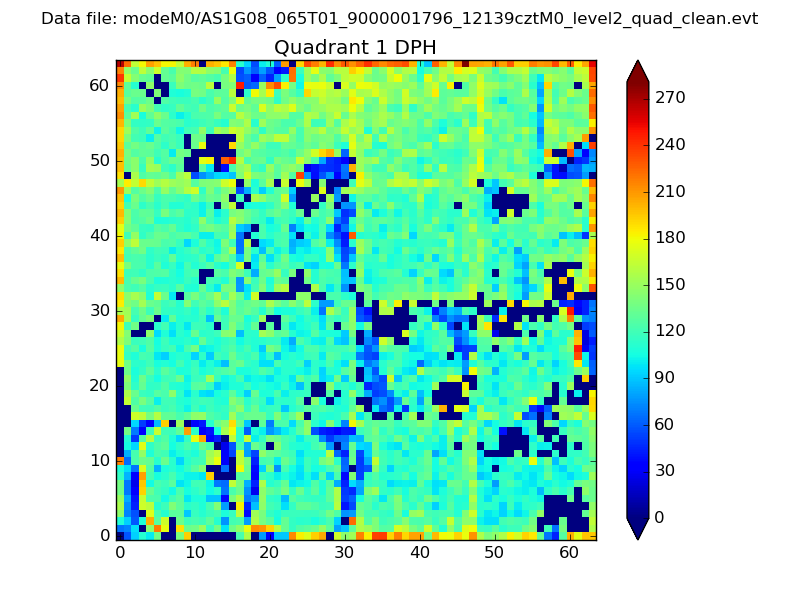
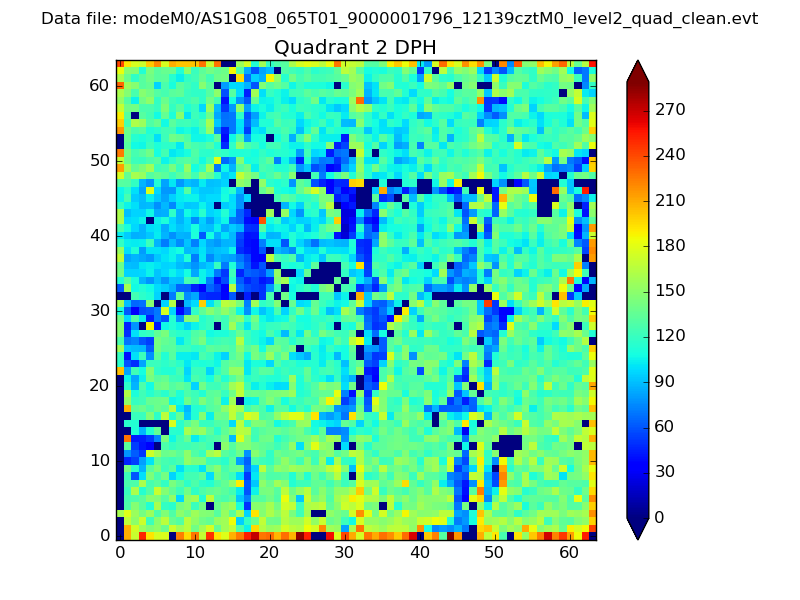
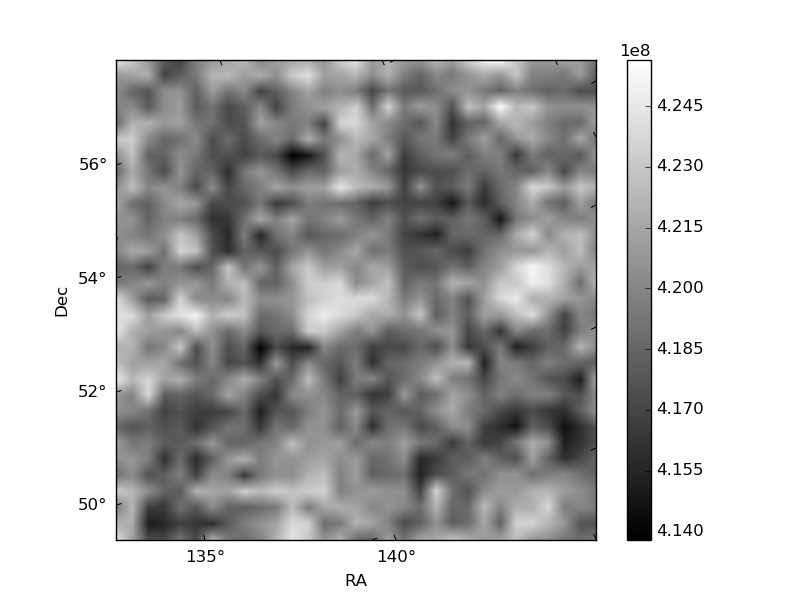
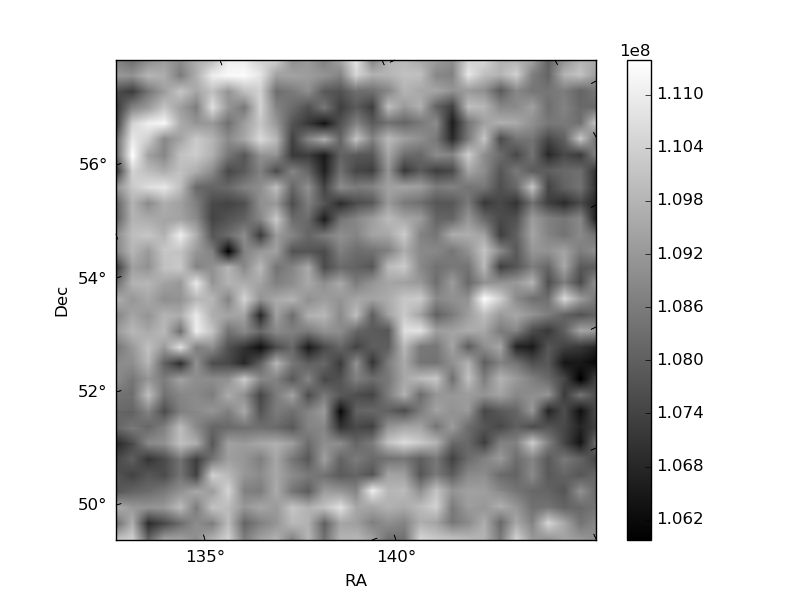
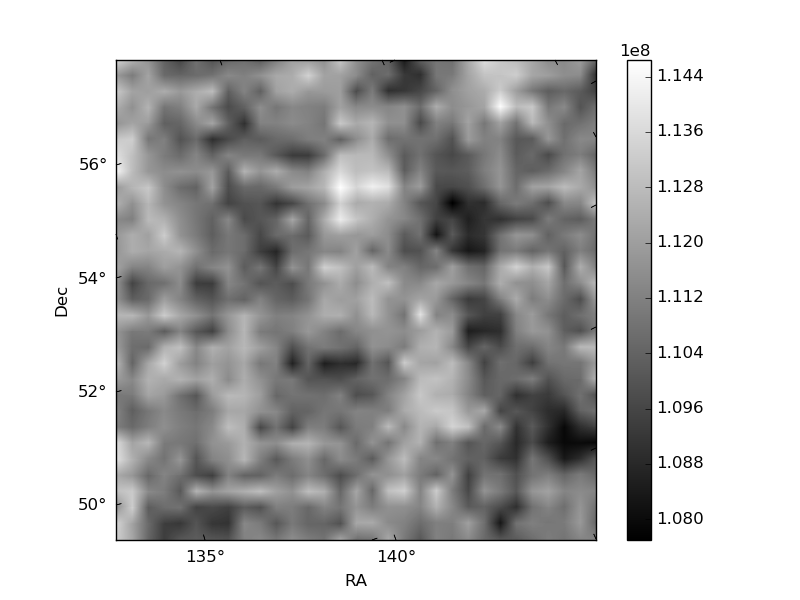
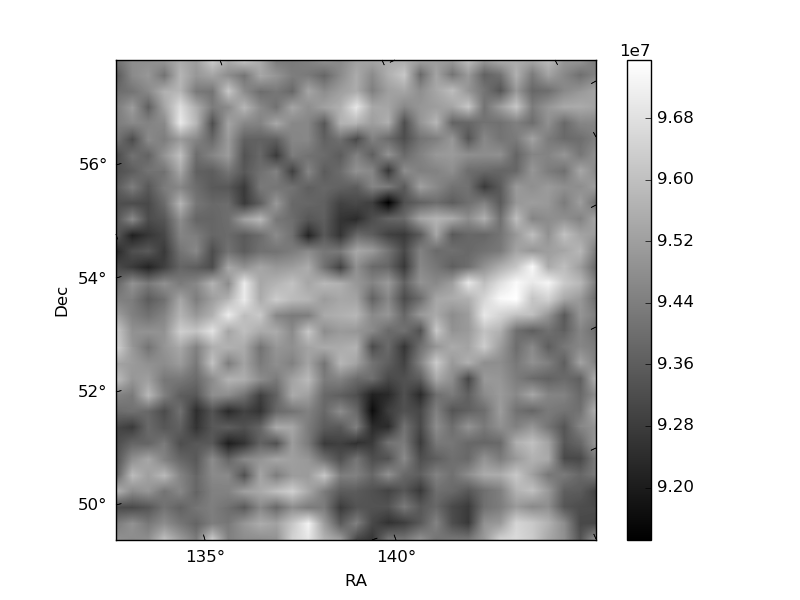
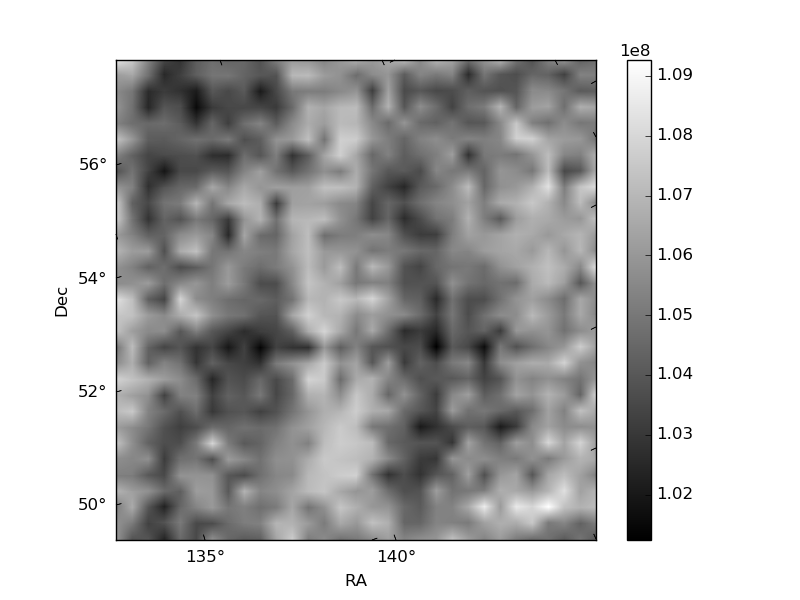
Histogram calculated using DETX and DETY for each event in the final _common_clean file
| Quadrant A | 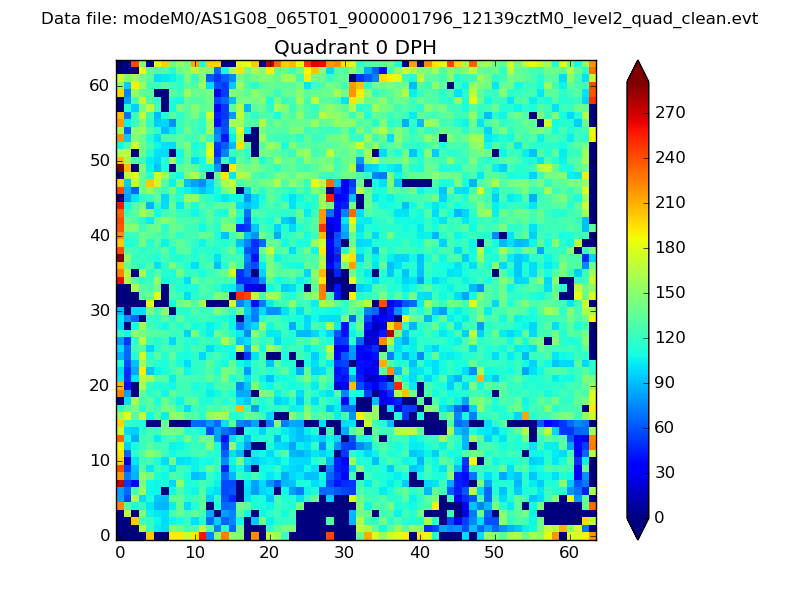 |
 |
Quadrant B |
|---|---|---|---|
| Quadrant D | 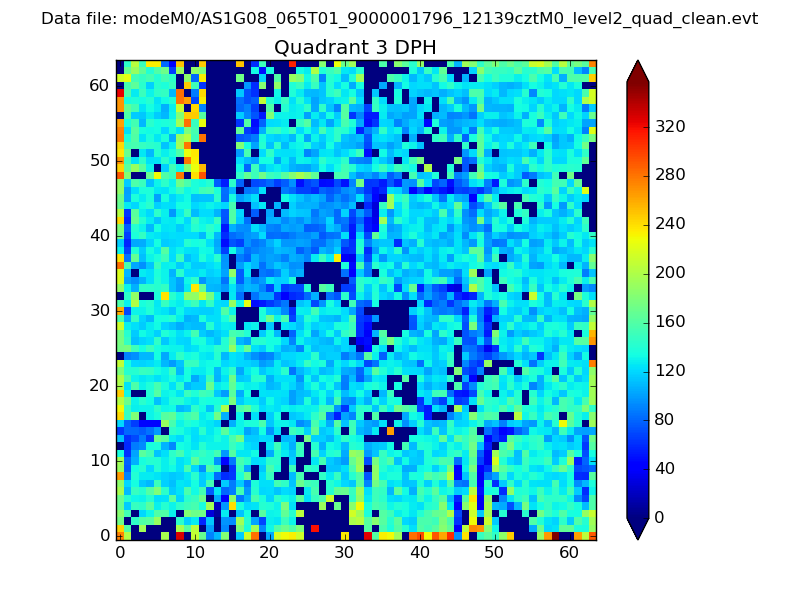 |
 |
Quadrant C |
| Plot type | Count rate plots | Images |
|---|---|---|
| Comparison with Poisson distribution Blue bars denote a histogram of data divided into 1 sec bins. Red curve is a Poisson curve with rate = median count rate of data. |
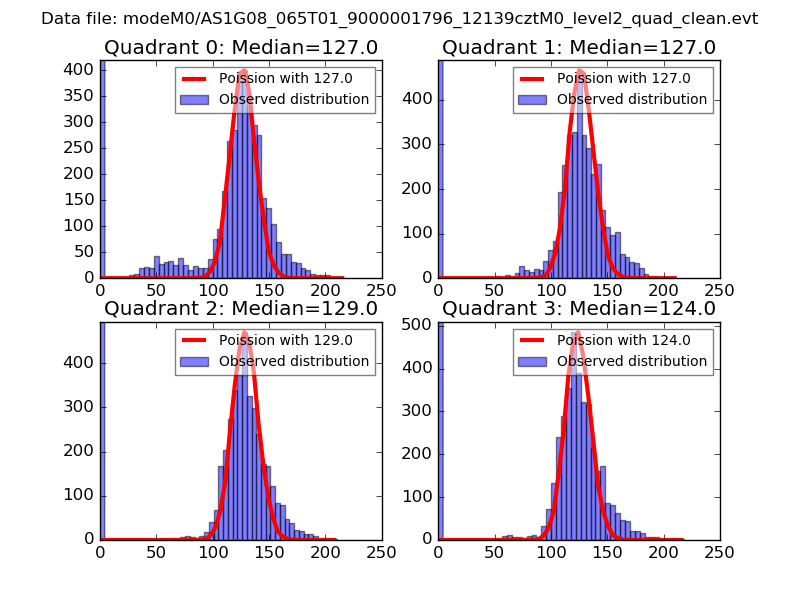 |
 |
| Quadrant-wise count rates Data is divided into 100 sec bins |
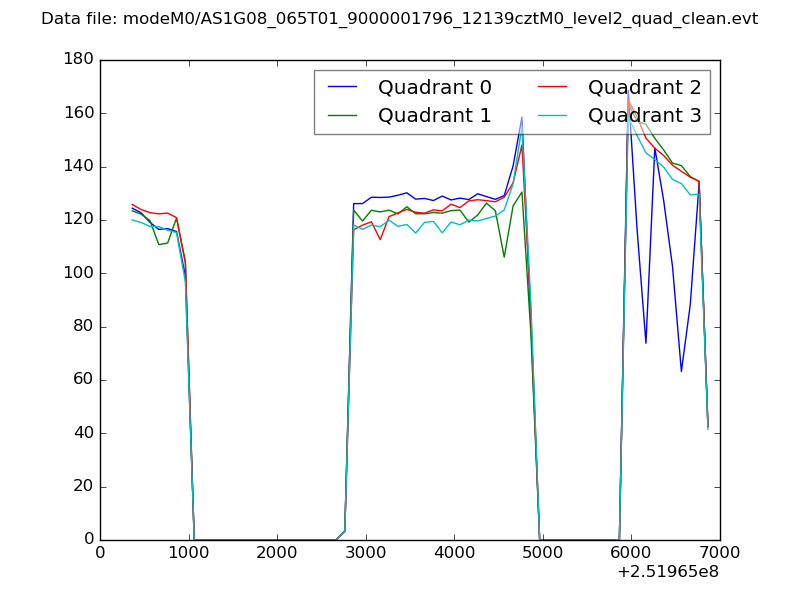 |
|
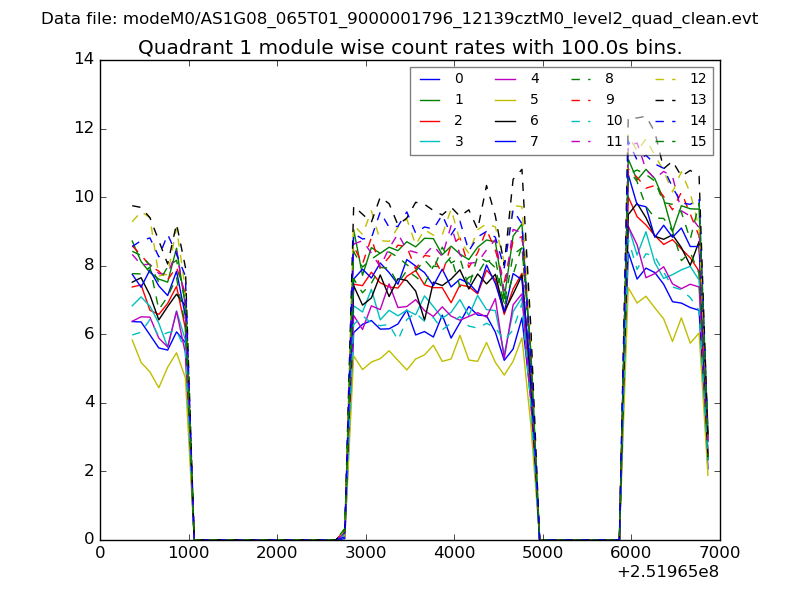
| Module-wise count rates for Quadrant A Data is divided into 100 sec bins |
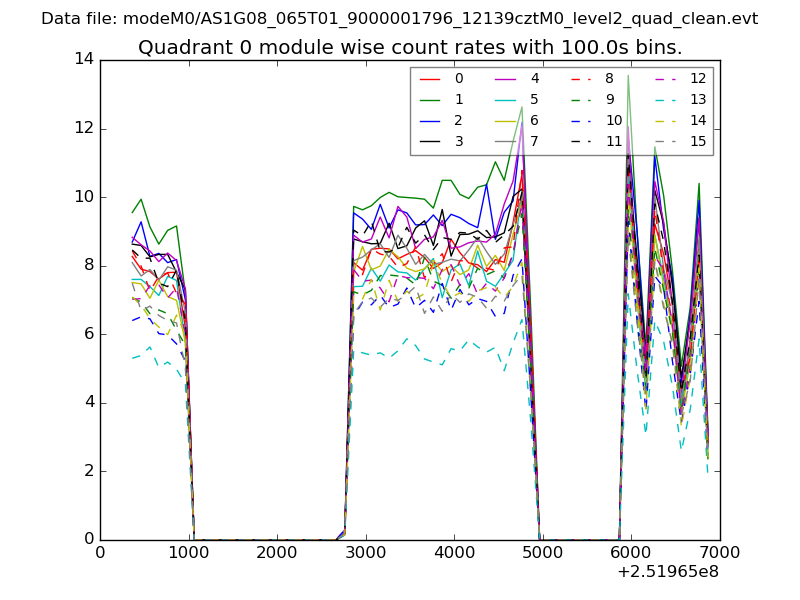 |
 |
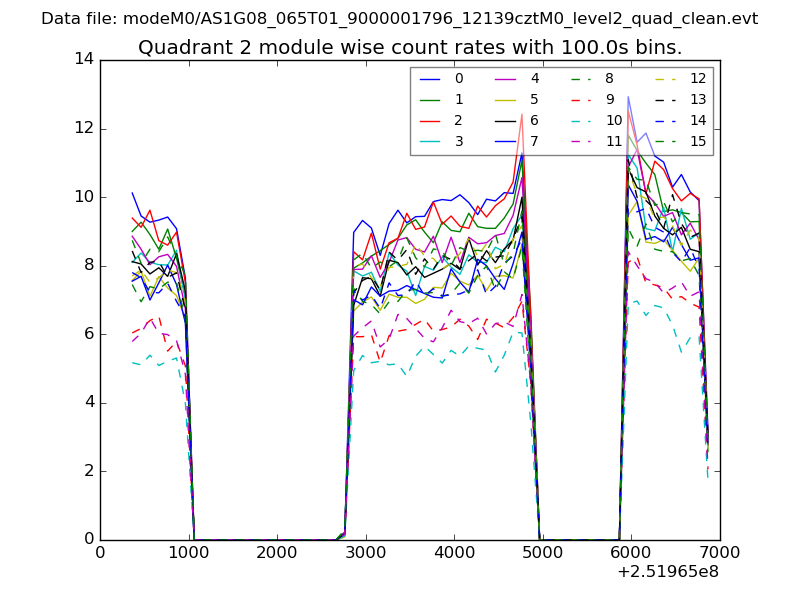
| Module-wise count rates for Quadrant B Data is divided into 100 sec bins |
 |
 |
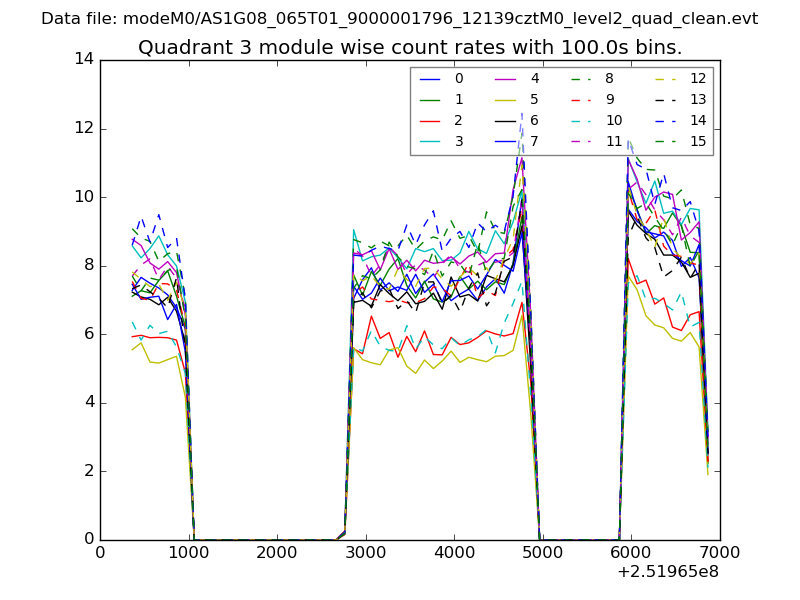
| Module-wise count rates for Quadrant C Data is divided into 100 sec bins |
 |
 |
| Module-wise count rates for Quadrant D Data is divided into 100 sec bins |
 |
 |
| Parameter | Plot |
|---|---|
| CZT HV Monitor | 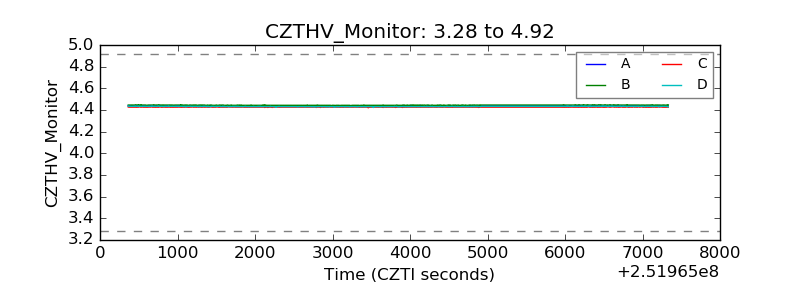 |
| D_VDD | 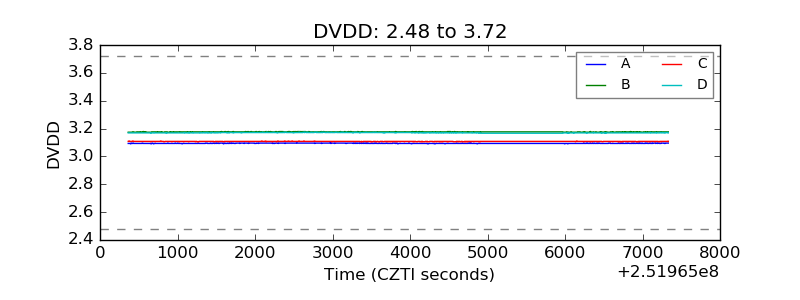 |
| Temperature 1 | 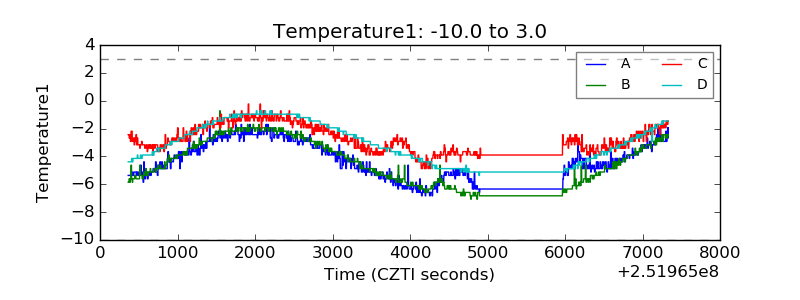 |
| Veto HV Monitor | 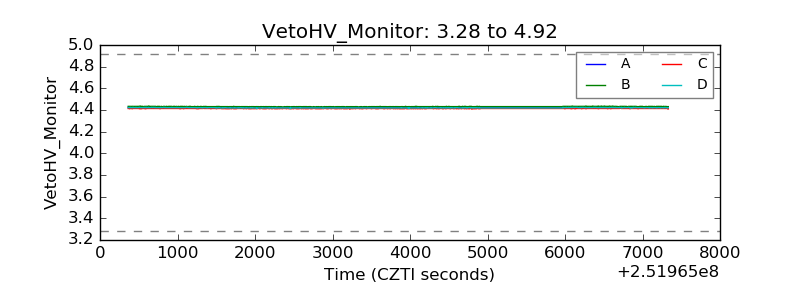 |
| Veto LLD |  |
| Alpha Counter | 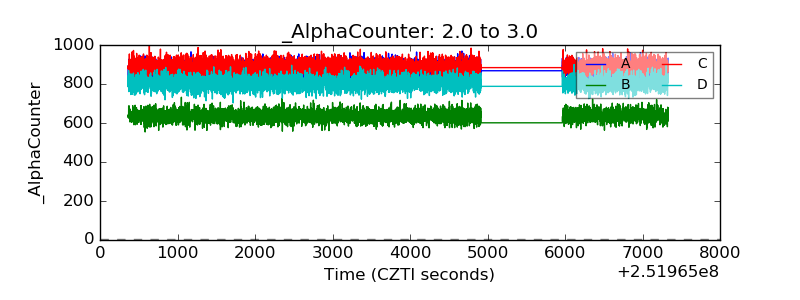 |
| _CPM_Rate | 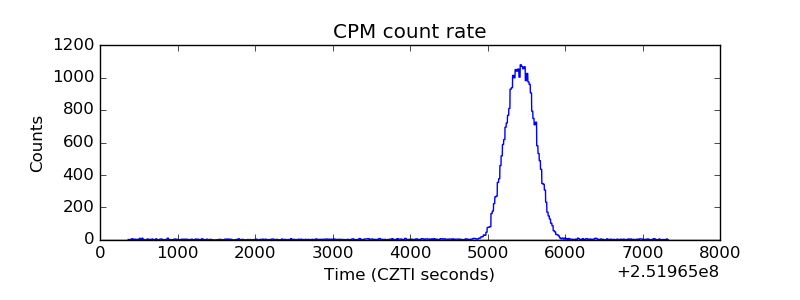 |
| CZT Counter | 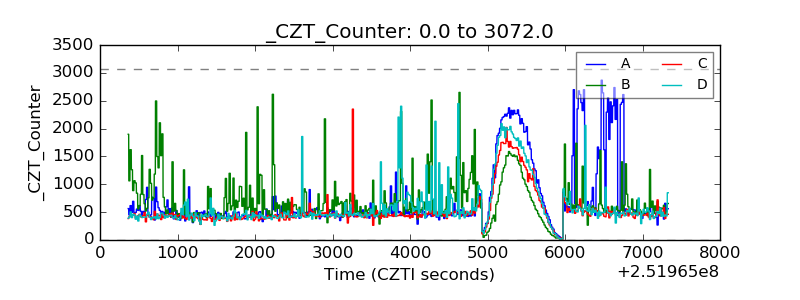 |
| +2.5 Volts monitor |  |
| +5 Volts monitor |  |
| _ROLL_ROT | 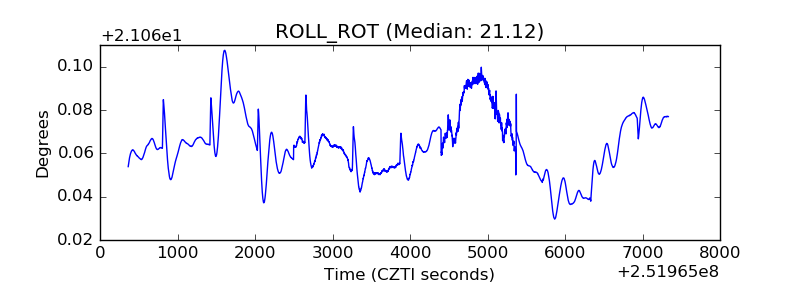 |
| _Roll_DEC | 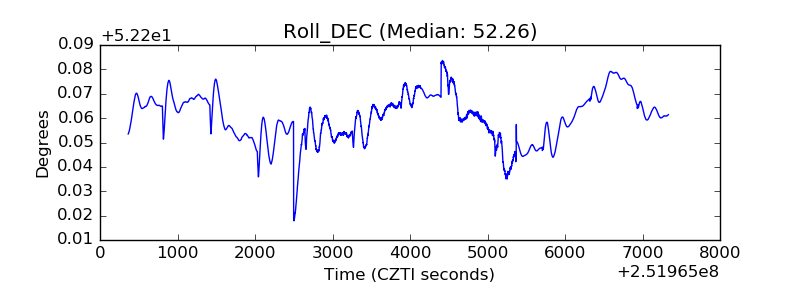 |
| _Roll_RA | 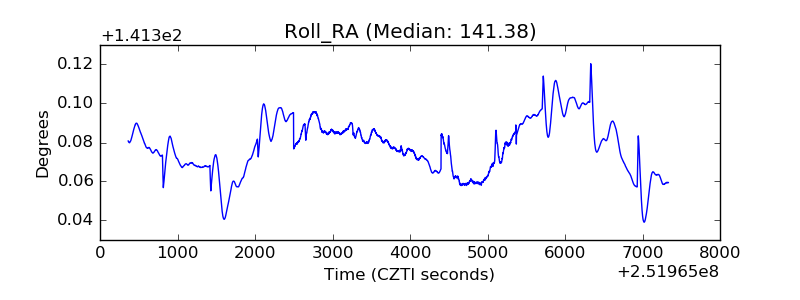 |
| Veto Counter | 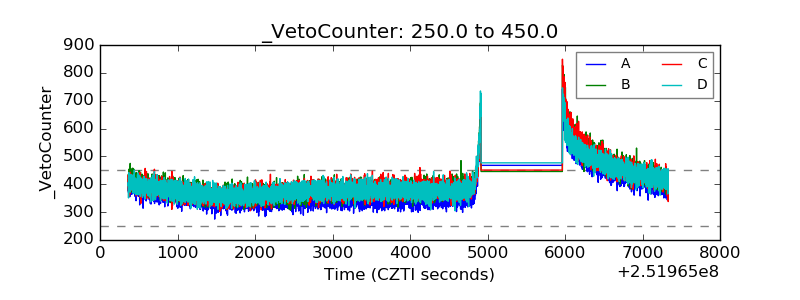 |