| Param | Original file | Final file |
|---|---|---|
| Filename | modeM0/AS1G08_065T01_9000001796_12142cztM0_level2.evt | modeM0/AS1G08_065T01_9000001796_12142cztM0_level2_quad_clean.evt |
| Size (bytes) | 505,944,000 | 74,750,400 |
| Size | 482.5 MB | 71.3 MB |
| Events in quadrant A | 3,452,152 | 467,838 |
| Events in quadrant B | 4,508,669 | 451,735 |
| Events in quadrant C | 3,189,226 | 456,603 |
| Events in quadrant D | 3,738,093 | 440,382 |
| Mode M0 | |||
|---|---|---|---|
| Quadrant | BADHDUFLAG | Total packets | Discarded packets |
| A | 0 | 14298 | 3 |
| B | 0 | 17690 | 2 |
| C | 0 | 13501 | 2 |
| D | 0 | 15288 | 2 |
| Mode M9 | |||
|---|---|---|---|
| Quadrant | BADHDUFLAG | Total packets | Discarded packets |
| A | 0 | 16 | 0 |
| B | 0 | 16 | 0 |
| C | 0 | 16 | 0 |
| D | 0 | 17 | 0 |
| Mode SS | |||
|---|---|---|---|
| Quadrant | BADHDUFLAG | Total packets | Discarded packets |
| A | 0 | 132 | 0 |
| B | 0 | 132 | 0 |
| C | 0 | 132 | 0 |
| D | 0 | 132 | 0 |
| Quadrant | Total seconds | Saturated seconds | Saturation percentage |
|---|---|---|---|
| A | 6396 | 88 | 1.375860% |
| B | 6396 | 365 | 5.706692% |
| C | 6396 | 57 | 0.891182% |
| D | 6396 | 130 | 2.032520% |
Noise dominated data is calculated using 1-second bins in cleaned event files. If a bin has >2000 counts, and if more than 50% of those come from <1% of pixels, then it is considered to be noise-dominated and hence unusable.
| Quadrant | # 1 sec bins | Bins with >0 counts | Bins with >2000 counts | High rate bins dominated by noise | Noise dominated (total time) | Noise dominated (detector-on time) | Marked lightcurve |
|---|---|---|---|---|---|---|---|
| A | 7652 | 6397 | 9 | 9 | 0.12% | 0.14% | 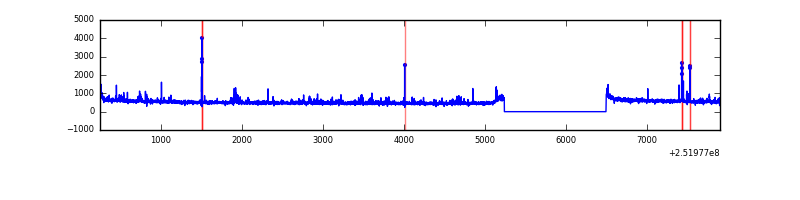 |
| B | 7652 | 6398 | 191 | 191 | 2.50% | 2.99% | 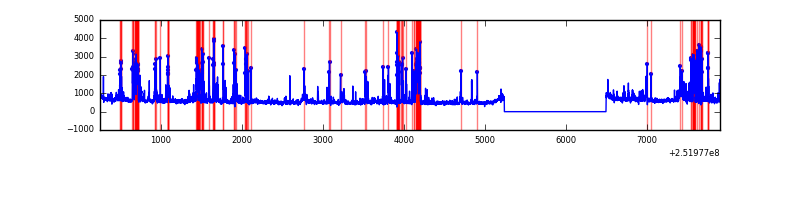 |
| C | 7652 | 6398 | 0 | 0 | 0.00% | 0.00% | 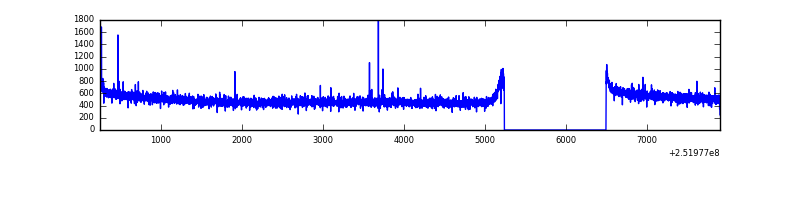 |
| D | 7652 | 6397 | 43 | 43 | 0.56% | 0.67% | 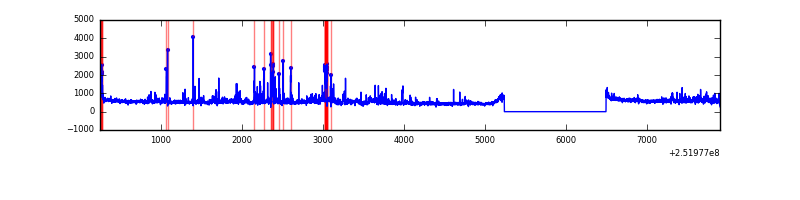 |
Top three noisy pixels from each quadrant. If the there are fewer than three noisy pixels in the level2.evt file, extra rows are filled as -1
| Pixel properties | Quadrant properties | ||||||
|---|---|---|---|---|---|---|---|
| Quadrant | DetID | PixID | Counts | Sigma | Mean | Median | Sigma |
| A | 1 | 162 | 57432 | 335.64 | 846 | 833 | 168.6 |
| A | 9 | 143 | 40760 | 236.78 | 846 | 833 | 168.6 |
| A | 1 | 178 | 26625 | 152.95 | 846 | 833 | 168.6 |
| B | 4 | 239 | 775299 | 5120.99 | 821 | 804 | 151.2 |
| B | 3 | 64 | 184779 | 1216.45 | 821 | 804 | 151.2 |
| B | 15 | 204 | 97096 | 636.69 | 821 | 804 | 151.2 |
| C | 15 | 208 | 14019 | 71.56 | 810 | 817 | 184.5 |
| C | 3 | 233 | 7301 | 35.14 | 810 | 817 | 184.5 |
| C | 13 | 61 | 5996 | 28.07 | 810 | 817 | 184.5 |
| D | 1 | 52 | 375777 | 1965.64 | 811 | 789 | 190.8 |
| D | 8 | 195 | 113052 | 588.47 | 811 | 789 | 190.8 |
| D | 12 | 221 | 47778 | 246.31 | 811 | 789 | 190.8 |
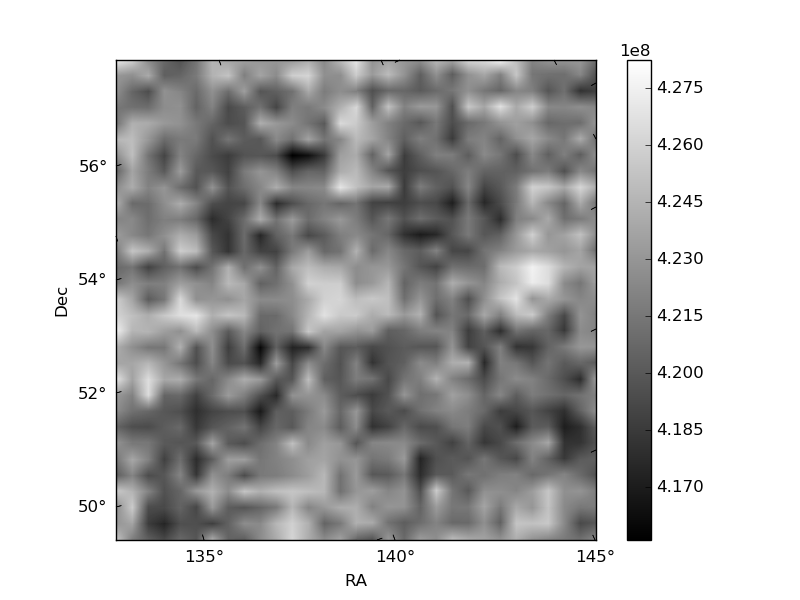
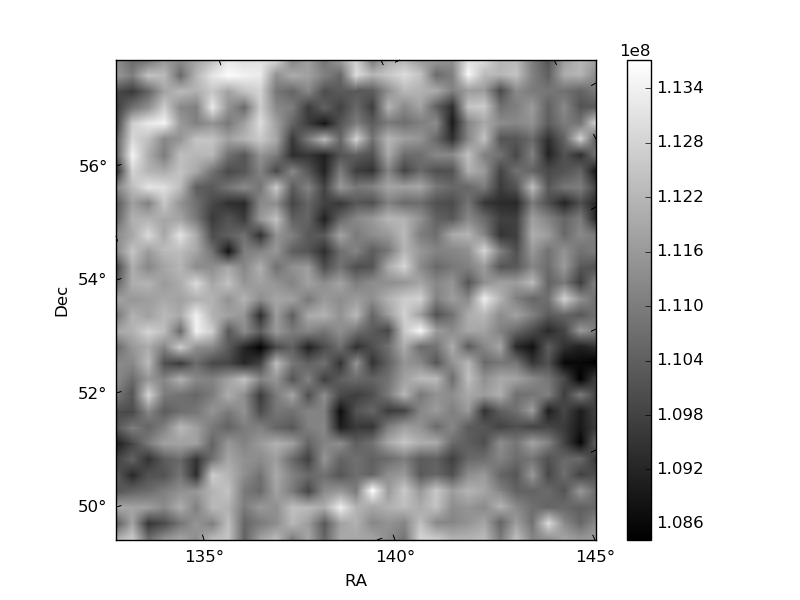
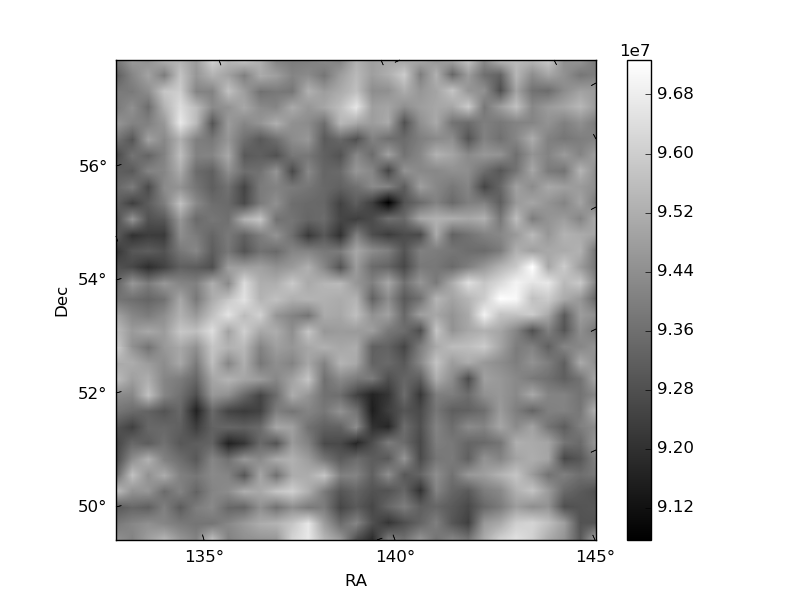
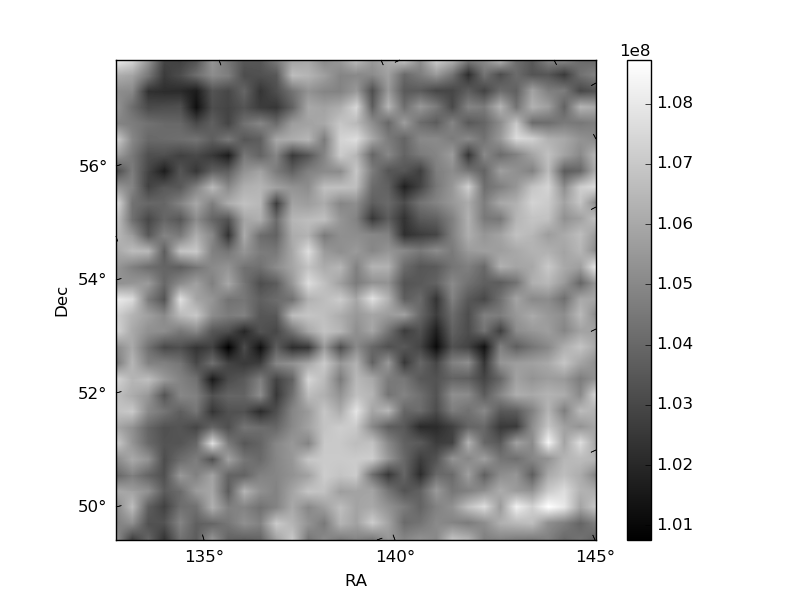
Histogram calculated using DETX and DETY for each event in the final _common_clean file
| Quadrant A |  |
 |
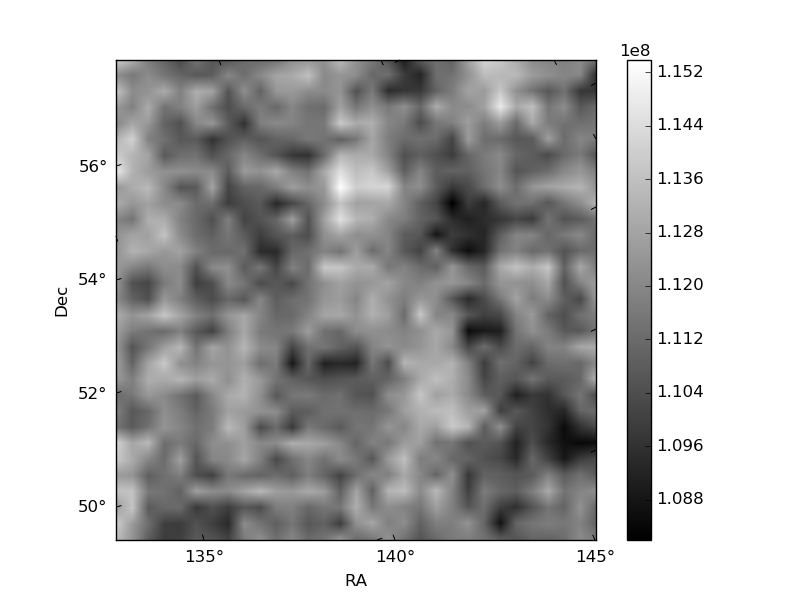
Quadrant B |
|---|---|---|---|
| Quadrant D |  |
 |
Quadrant C |
| Plot type | Count rate plots | Images |
|---|---|---|
| Comparison with Poisson distribution Blue bars denote a histogram of data divided into 1 sec bins. Red curve is a Poisson curve with rate = median count rate of data. |
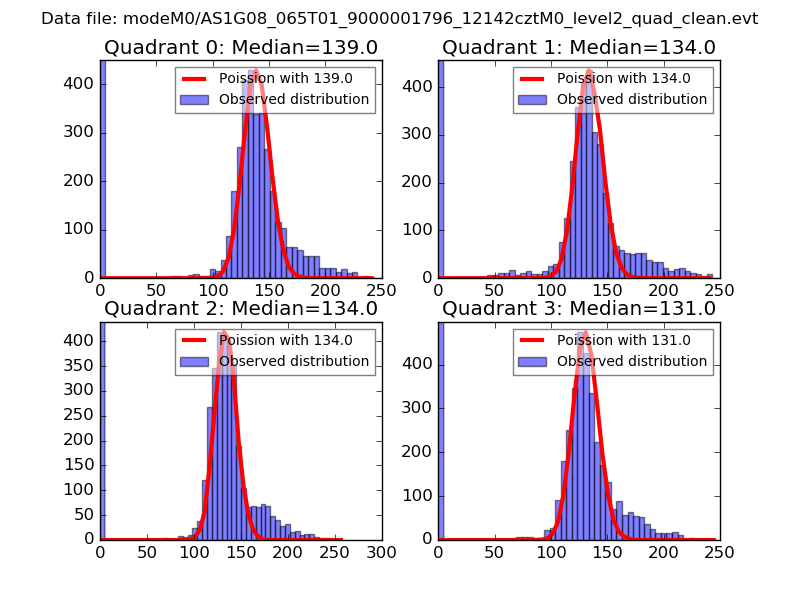 |
 |
| Quadrant-wise count rates Data is divided into 100 sec bins |
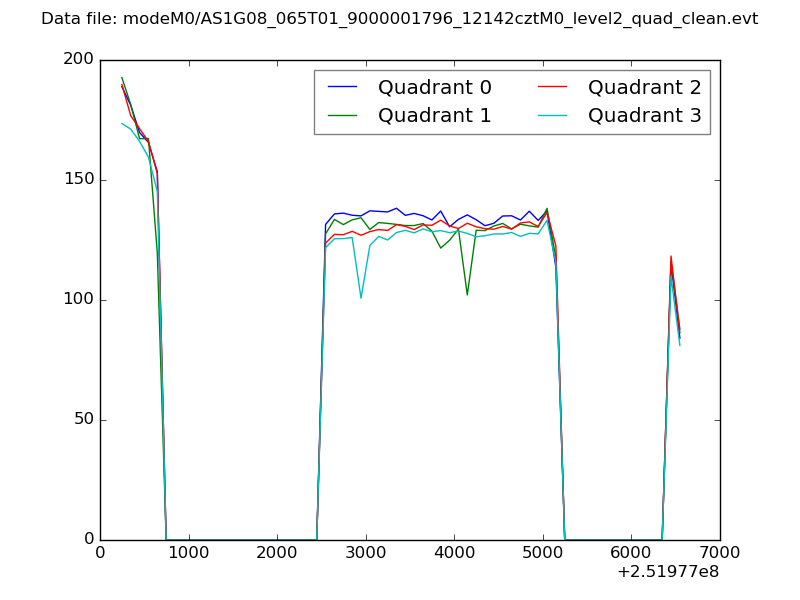 |
|
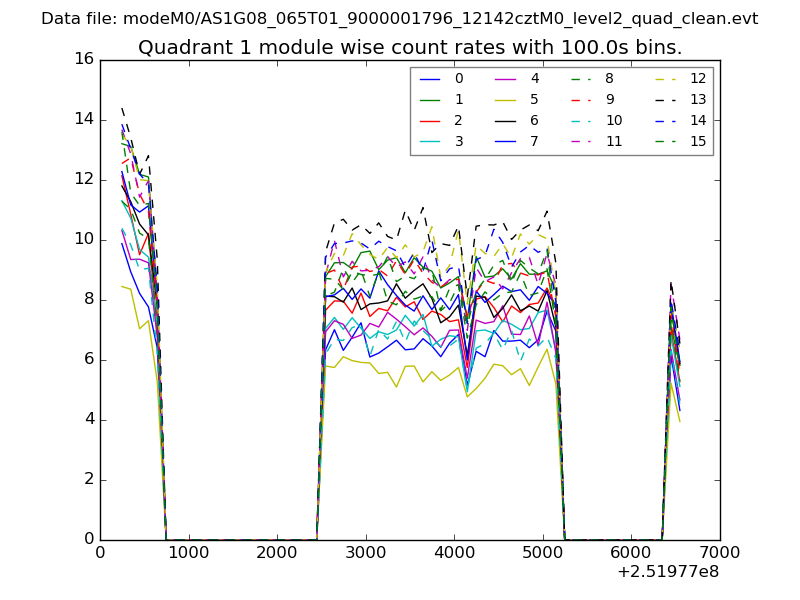
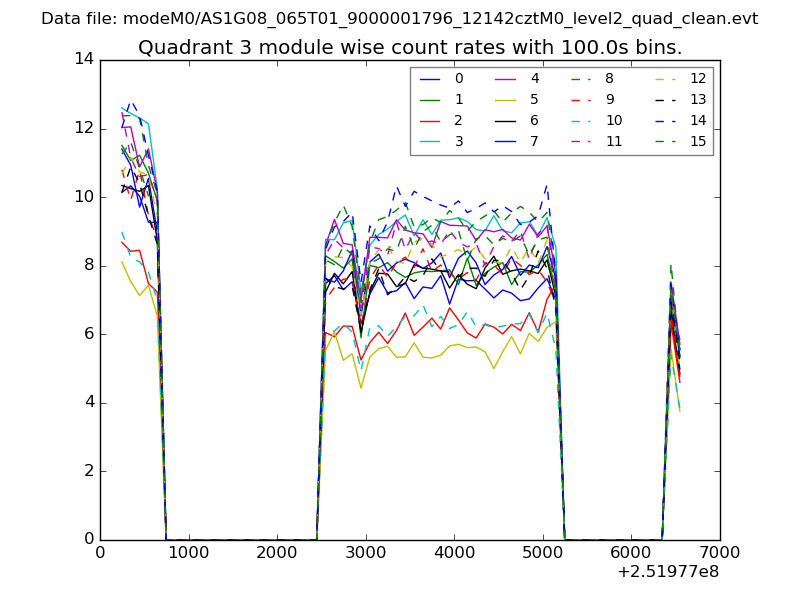
| Module-wise count rates for Quadrant A Data is divided into 100 sec bins |
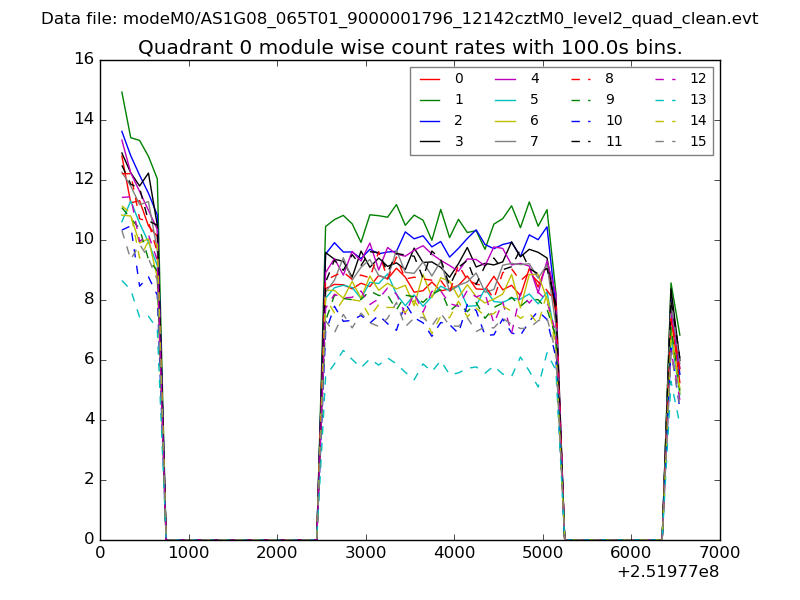 |
 |
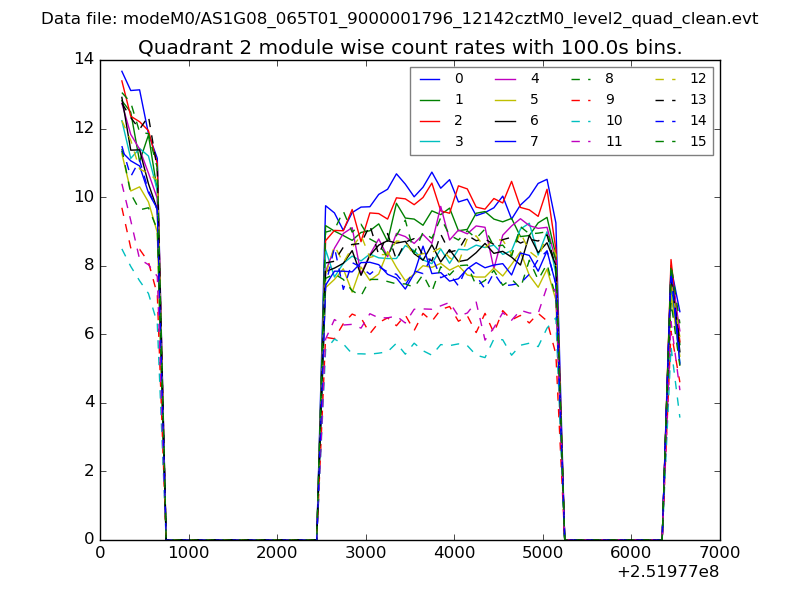
| Module-wise count rates for Quadrant B Data is divided into 100 sec bins |
 |
 |
| Module-wise count rates for Quadrant C Data is divided into 100 sec bins |
 |
 |
| Module-wise count rates for Quadrant D Data is divided into 100 sec bins |
 |
 |
| Parameter | Plot |
|---|---|
| CZT HV Monitor |  |
| D_VDD | 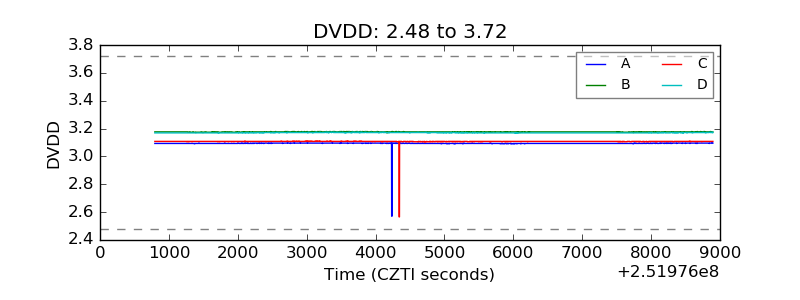 |
| Temperature 1 | 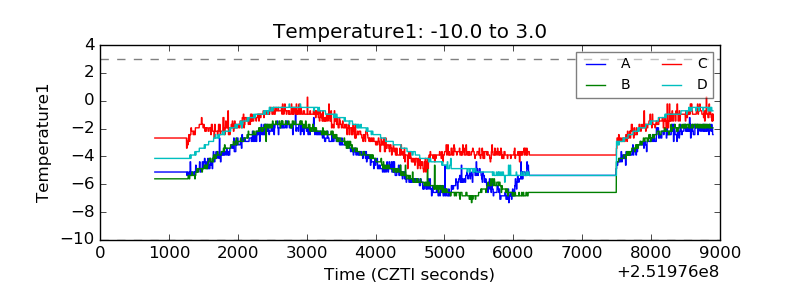 |
| Veto HV Monitor | 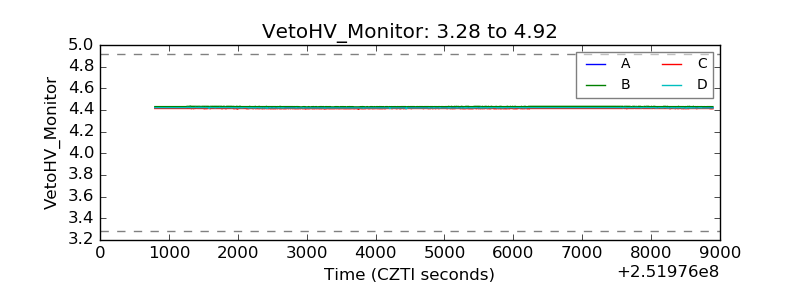 |
| Veto LLD | 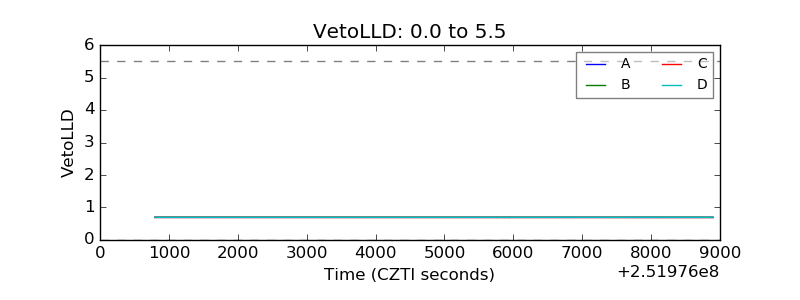 |
| Alpha Counter | 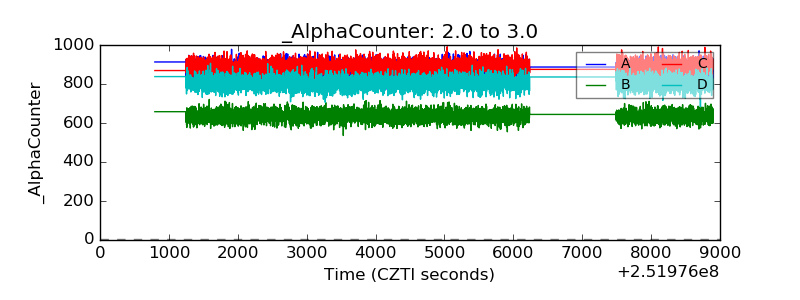 |
| _CPM_Rate | 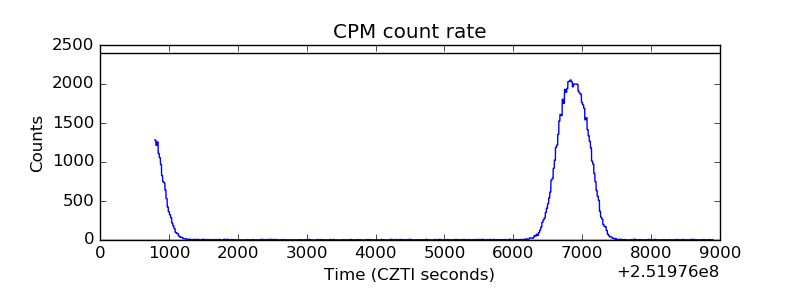 |
| CZT Counter | 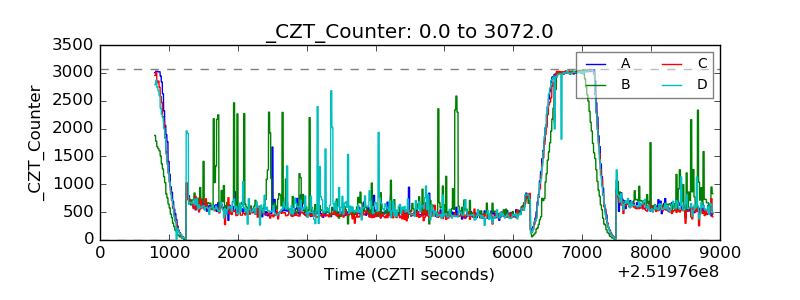 |
| +2.5 Volts monitor |  |
| +5 Volts monitor | 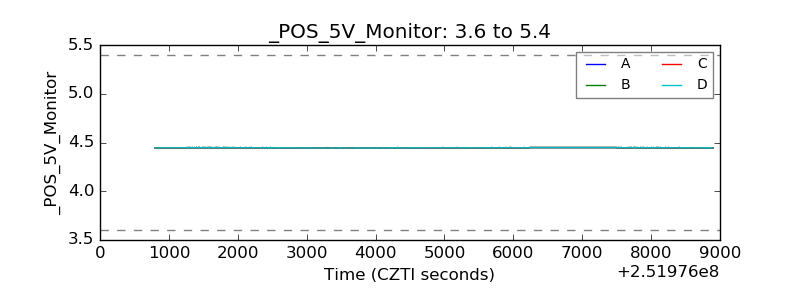 |
| _ROLL_ROT | 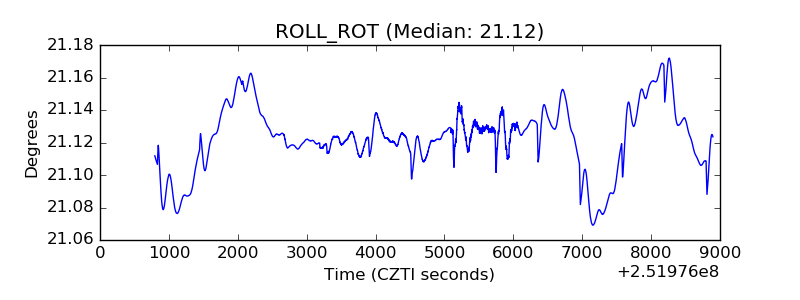 |
| _Roll_DEC | 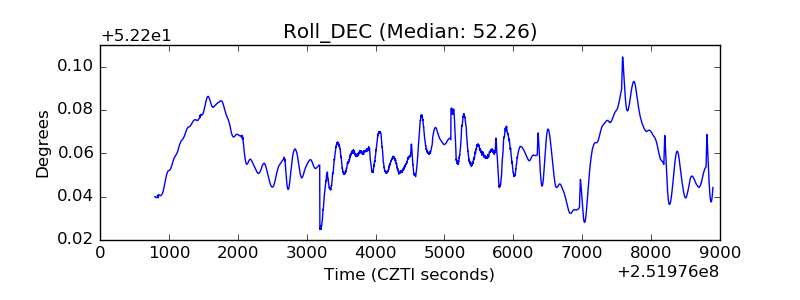 |
| _Roll_RA | 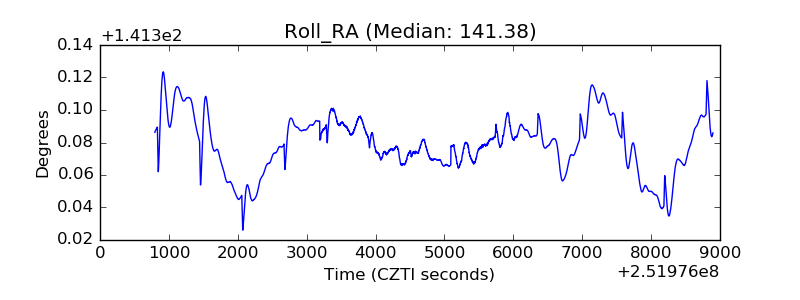 |
| Veto Counter | 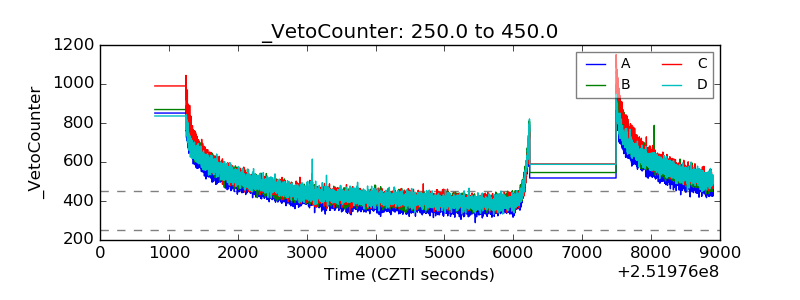 |