| Param | Original file | Final file |
|---|---|---|
| Filename | modeM0/AS1G08_065T01_9000001796_12143cztM0_level2.evt | modeM0/AS1G08_065T01_9000001796_12143cztM0_level2_quad_clean.evt |
| Size (bytes) | 513,483,840 | 71,936,640 |
| Size | 489.7 MB | 68.6 MB |
| Events in quadrant A | 3,552,218 | 442,695 |
| Events in quadrant B | 4,656,173 | 431,979 |
| Events in quadrant C | 3,302,196 | 432,119 |
| Events in quadrant D | 3,604,048 | 422,513 |
| Mode M0 | |||
|---|---|---|---|
| Quadrant | BADHDUFLAG | Total packets | Discarded packets |
| A | 0 | 14689 | 3 |
| B | 0 | 18283 | 2 |
| C | 0 | 13793 | 2 |
| D | 0 | 14914 | 2 |
| Mode M9 | |||
|---|---|---|---|
| Quadrant | BADHDUFLAG | Total packets | Discarded packets |
| A | 0 | 14 | 0 |
| B | 0 | 14 | 0 |
| C | 0 | 14 | 0 |
| D | 0 | 15 | 0 |
| Mode SS | |||
|---|---|---|---|
| Quadrant | BADHDUFLAG | Total packets | Discarded packets |
| A | 0 | 132 | 0 |
| B | 0 | 132 | 0 |
| C | 0 | 132 | 0 |
| D | 0 | 132 | 0 |
| Quadrant | Total seconds | Saturated seconds | Saturation percentage |
|---|---|---|---|
| A | 6428 | 120 | 1.866833% |
| B | 6428 | 388 | 6.036092% |
| C | 6428 | 68 | 1.057872% |
| D | 6428 | 94 | 1.462352% |
Noise dominated data is calculated using 1-second bins in cleaned event files. If a bin has >2000 counts, and if more than 50% of those come from <1% of pixels, then it is considered to be noise-dominated and hence unusable.
| Quadrant | # 1 sec bins | Bins with >0 counts | Bins with >2000 counts | High rate bins dominated by noise | Noise dominated (total time) | Noise dominated (detector-on time) | Marked lightcurve |
|---|---|---|---|---|---|---|---|
| A | 7734 | 6430 | 10 | 10 | 0.13% | 0.16% | 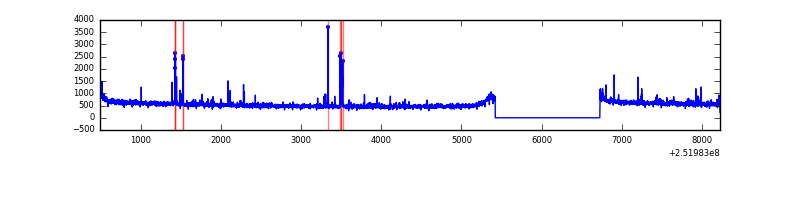 |
| B | 7734 | 6430 | 158 | 158 | 2.04% | 2.46% | 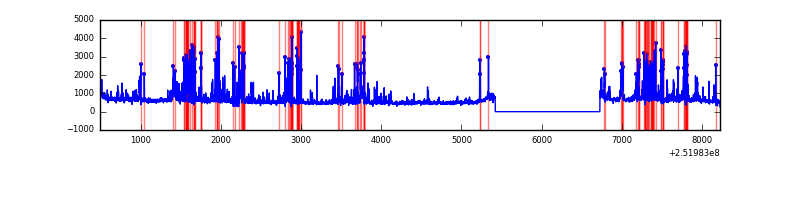 |
| C | 7734 | 6430 | 0 | 0 | 0.00% | 0.00% | 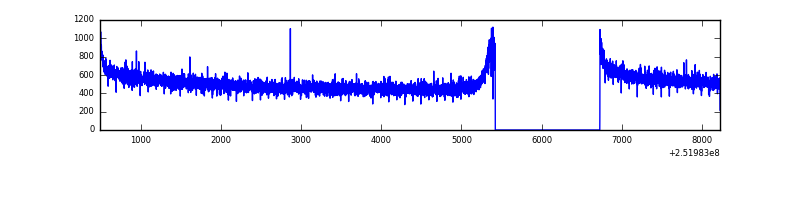 |
| D | 7734 | 6430 | 9 | 9 | 0.12% | 0.14% | 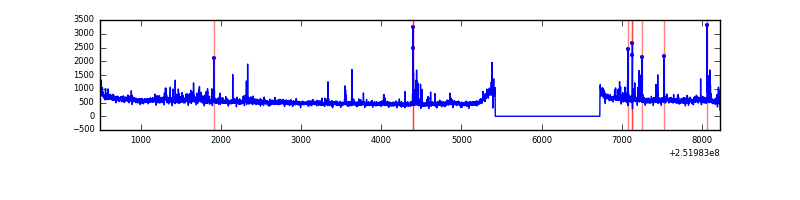 |
Top three noisy pixels from each quadrant. If the there are fewer than three noisy pixels in the level2.evt file, extra rows are filled as -1
| Pixel properties | Quadrant properties | ||||||
|---|---|---|---|---|---|---|---|
| Quadrant | DetID | PixID | Counts | Sigma | Mean | Median | Sigma |
| A | 1 | 162 | 35608 | 200.82 | 877 | 864 | 173.0 |
| A | 15 | 239 | 34710 | 195.63 | 877 | 864 | 173.0 |
| A | 13 | 248 | 30948 | 173.89 | 877 | 864 | 173.0 |
| B | 4 | 239 | 746972 | 4780.05 | 850 | 834 | 156.1 |
| B | 3 | 64 | 243390 | 1553.91 | 850 | 834 | 156.1 |
| B | 11 | 51 | 129158 | 822.09 | 850 | 834 | 156.1 |
| C | 13 | 61 | 6191 | 27.97 | 844 | 851 | 190.9 |
| C | 15 | 208 | 4139 | 17.22 | 844 | 851 | 190.9 |
| C | 4 | 175 | 3577 | 14.28 | 844 | 851 | 190.9 |
| D | 8 | 195 | 131845 | 655.45 | 848 | 825 | 199.9 |
| D | 13 | 104 | 75818 | 375.16 | 848 | 825 | 199.9 |
| D | 1 | 52 | 69477 | 343.44 | 848 | 825 | 199.9 |
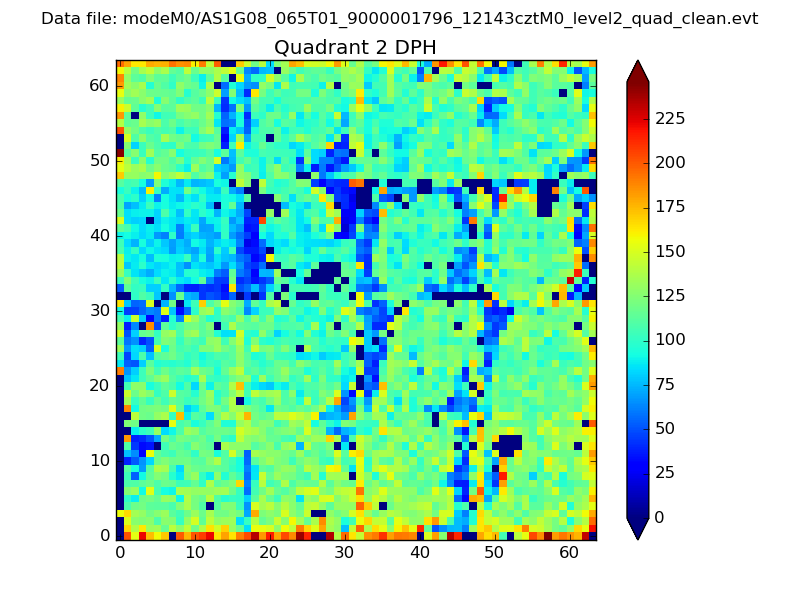
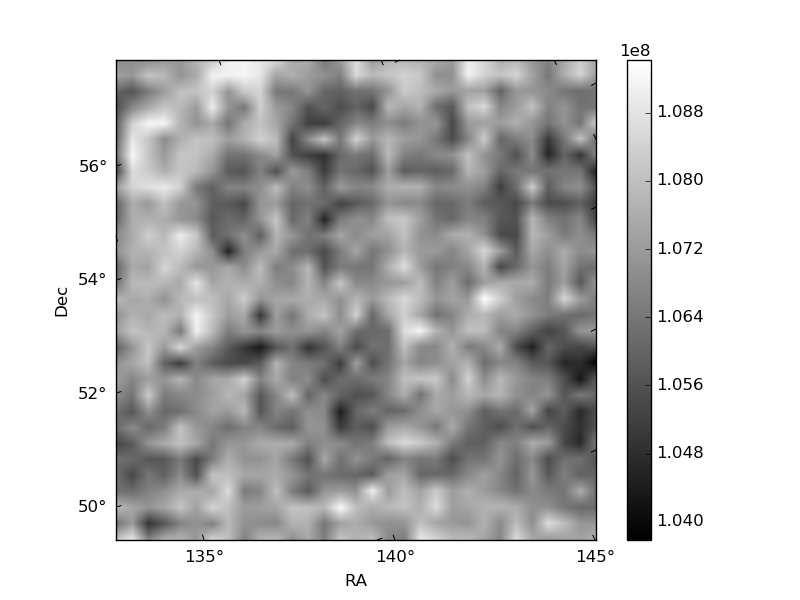
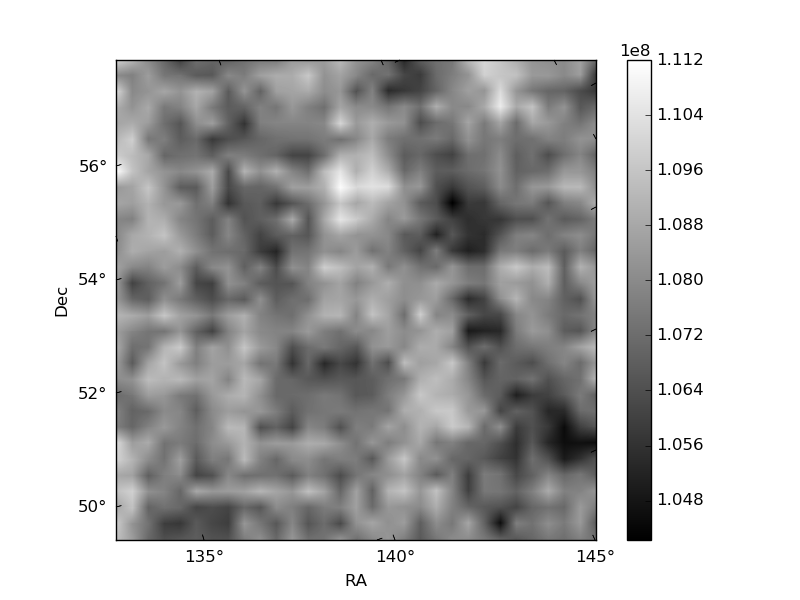
Histogram calculated using DETX and DETY for each event in the final _common_clean file
| Quadrant A | 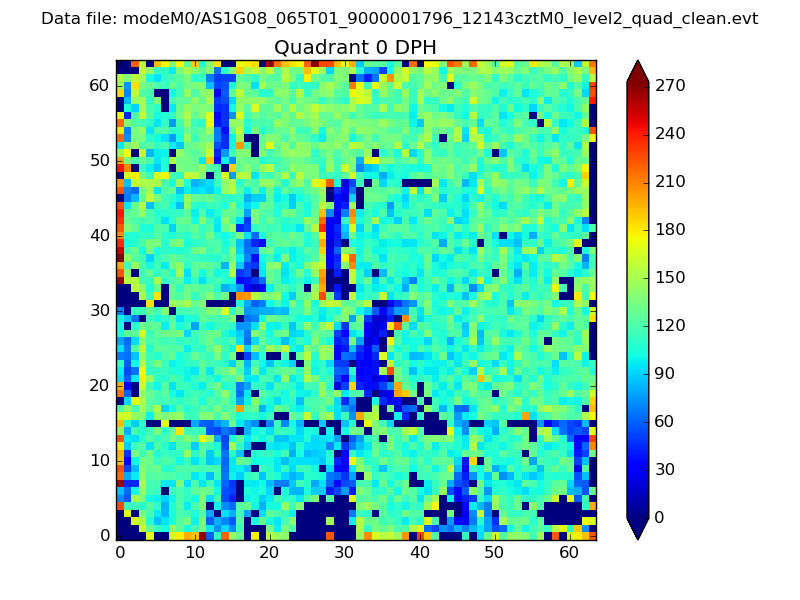 |
 |
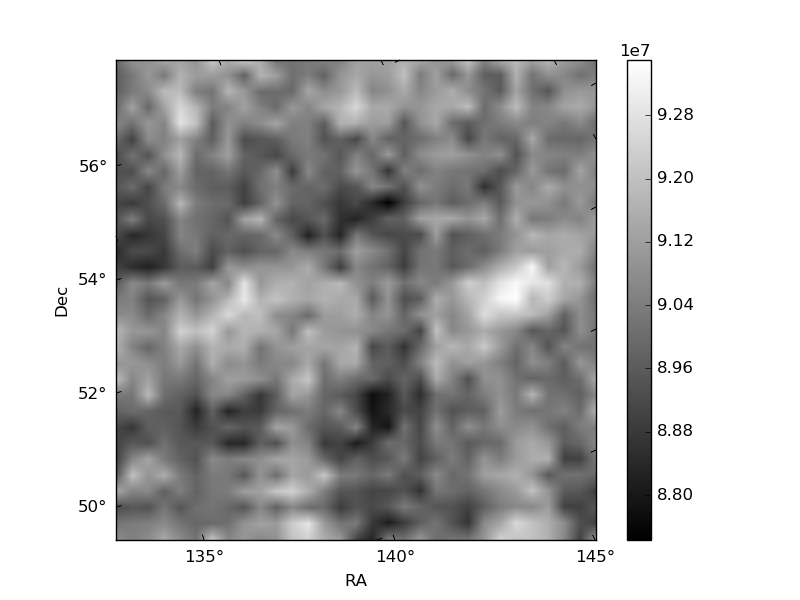
Quadrant B |
|---|---|---|---|
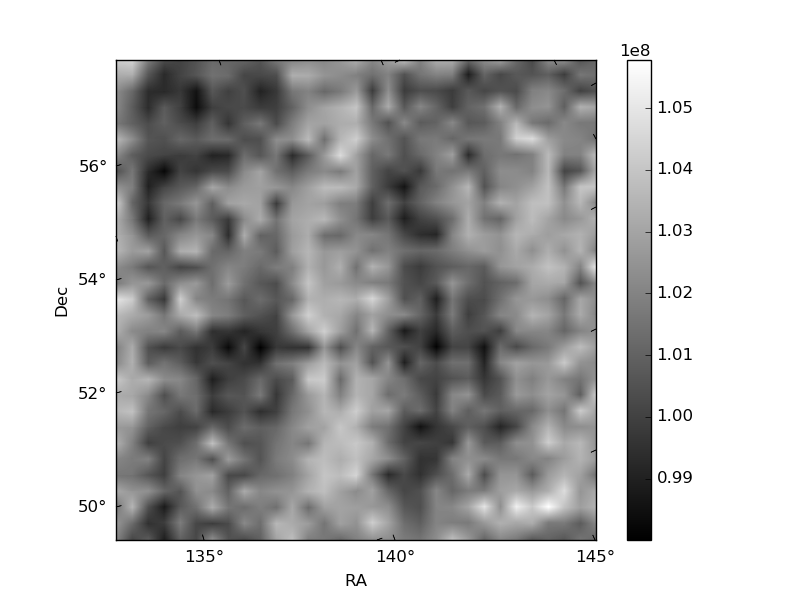
| Quadrant D |  |
 |
Quadrant C |
| Plot type | Count rate plots | Images |
|---|---|---|
| Comparison with Poisson distribution Blue bars denote a histogram of data divided into 1 sec bins. Red curve is a Poisson curve with rate = median count rate of data. |
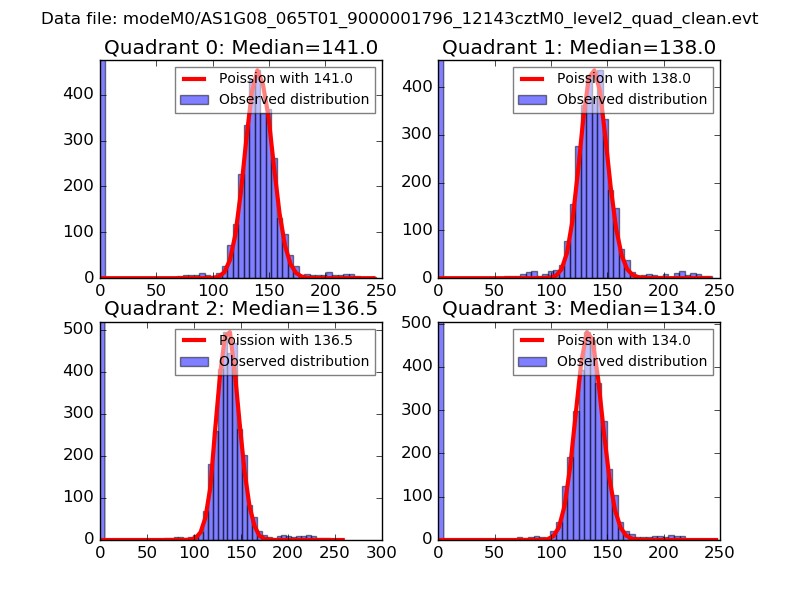 |
 |
| Quadrant-wise count rates Data is divided into 100 sec bins |
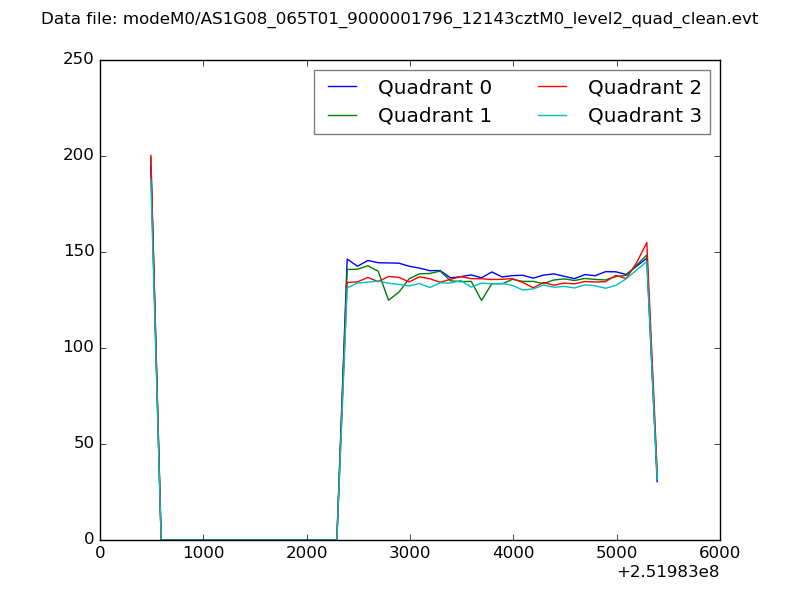 |
|
| Module-wise count rates for Quadrant A Data is divided into 100 sec bins |
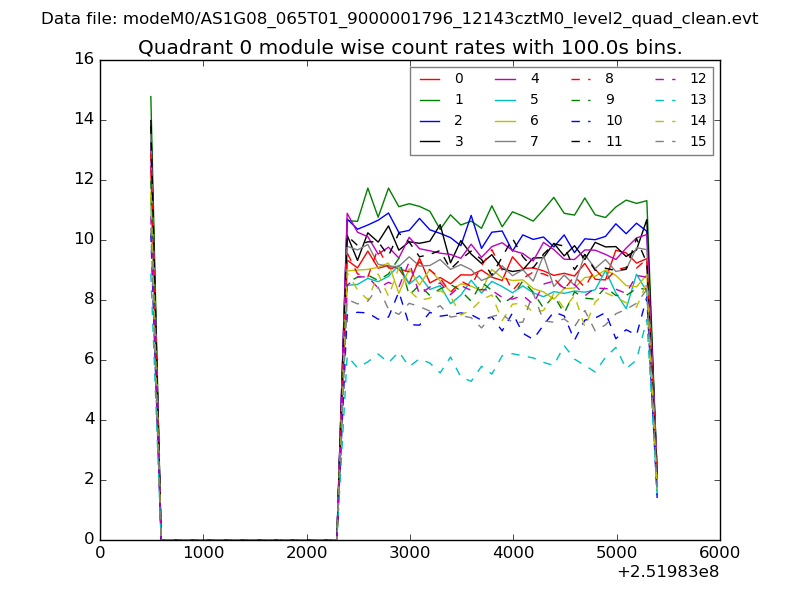 |
 |
| Module-wise count rates for Quadrant B Data is divided into 100 sec bins |
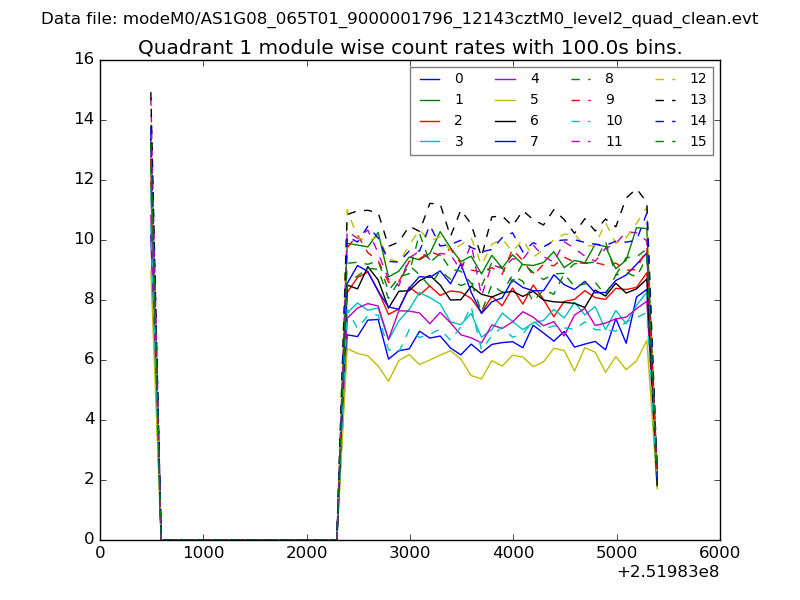 |
 |
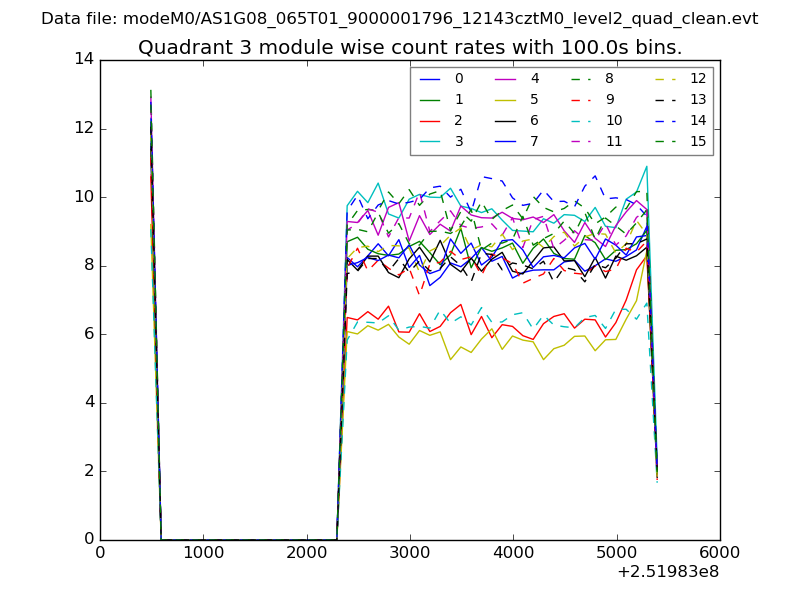
| Module-wise count rates for Quadrant C Data is divided into 100 sec bins |
 |
 |
| Module-wise count rates for Quadrant D Data is divided into 100 sec bins |
 |
 |
| Parameter | Plot |
|---|---|
| CZT HV Monitor | 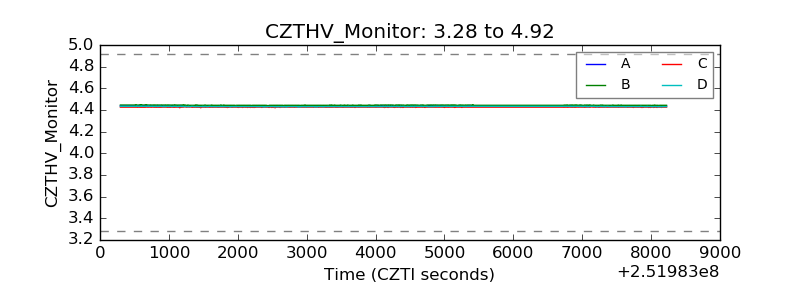 |
| D_VDD | 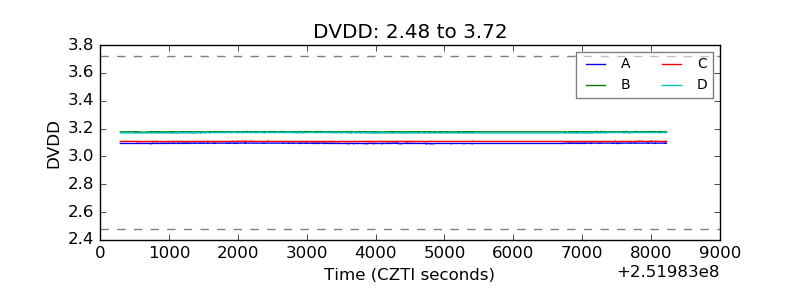 |
| Temperature 1 | 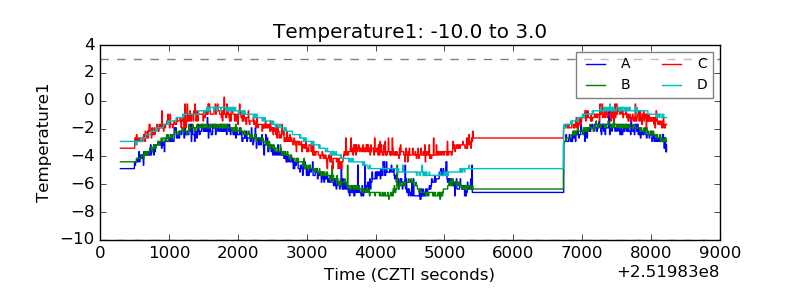 |
| Veto HV Monitor | 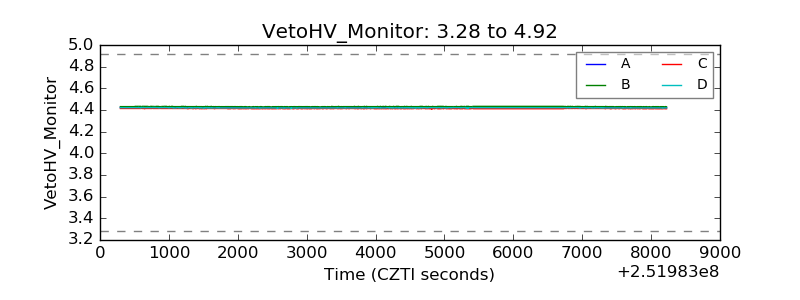 |
| Veto LLD | 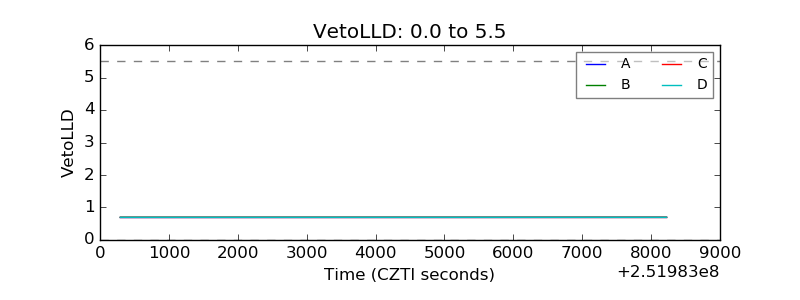 |
| Alpha Counter | 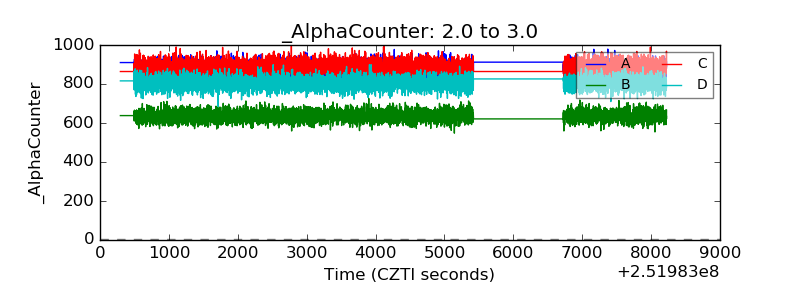 |
| _CPM_Rate | 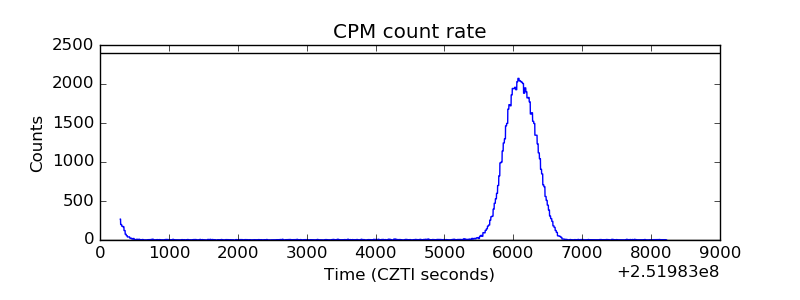 |
| CZT Counter | 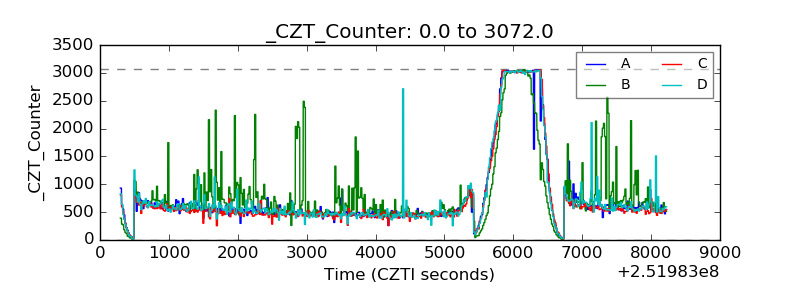 |
| +2.5 Volts monitor |  |
| +5 Volts monitor |  |
| _ROLL_ROT | 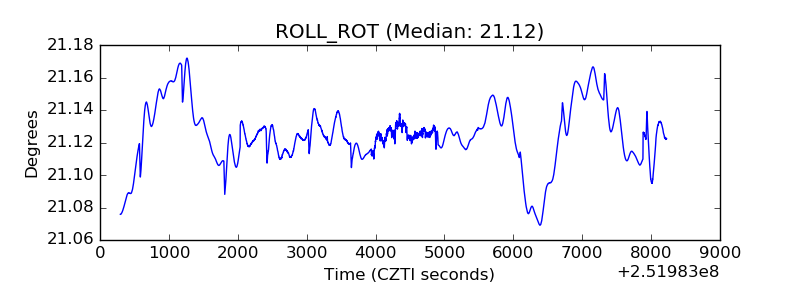 |
| _Roll_DEC | 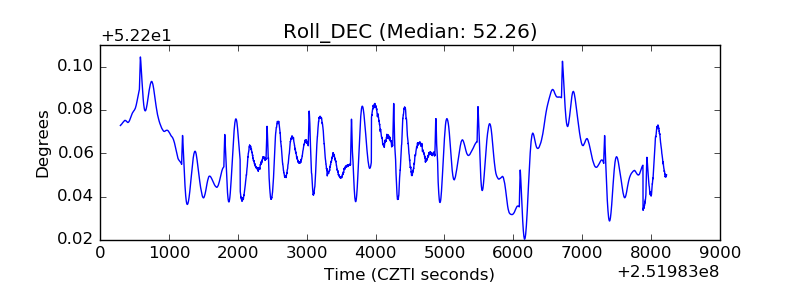 |
| _Roll_RA | 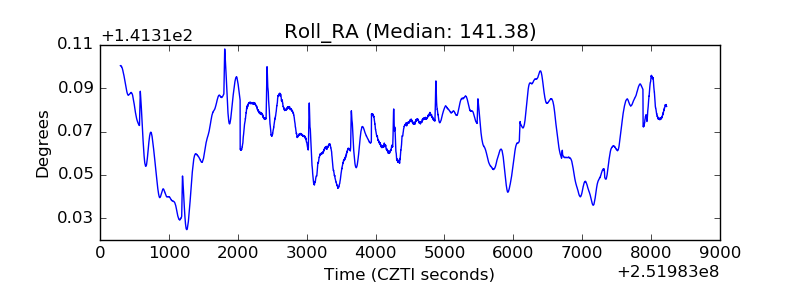 |
| Veto Counter |  |