| Param | Original file | Final file |
|---|---|---|
| Filename | modeM0/AS1G08_065T01_9000001796_12144cztM0_level2.evt | modeM0/AS1G08_065T01_9000001796_12144cztM0_level2_quad_clean.evt |
| Size (bytes) | 496,753,920 | 82,028,160 |
| Size | 473.7 MB | 78.2 MB |
| Events in quadrant A | 3,337,198 | 526,248 |
| Events in quadrant B | 4,408,419 | 515,372 |
| Events in quadrant C | 3,090,418 | 517,992 |
| Events in quadrant D | 3,793,137 | 497,133 |
| Mode M0 | |||
|---|---|---|---|
| Quadrant | BADHDUFLAG | Total packets | Discarded packets |
| A | 0 | 13819 | 2 |
| B | 0 | 17188 | 1 |
| C | 0 | 12884 | 1 |
| D | 0 | 15536 | 1 |
| Mode M9 | |||
|---|---|---|---|
| Quadrant | BADHDUFLAG | Total packets | Discarded packets |
| A | 0 | 13 | 0 |
| B | 0 | 13 | 0 |
| C | 0 | 13 | 0 |
| D | 0 | 13 | 0 |
| Mode SS | |||
|---|---|---|---|
| Quadrant | BADHDUFLAG | Total packets | Discarded packets |
| A | 0 | 124 | 0 |
| B | 0 | 124 | 0 |
| C | 0 | 124 | 0 |
| D | 0 | 124 | 0 |
| Quadrant | Total seconds | Saturated seconds | Saturation percentage |
|---|---|---|---|
| A | 6117 | 115 | 1.880007% |
| B | 6117 | 368 | 6.016021% |
| C | 6117 | 81 | 1.324179% |
| D | 6117 | 213 | 3.482099% |
Noise dominated data is calculated using 1-second bins in cleaned event files. If a bin has >2000 counts, and if more than 50% of those come from <1% of pixels, then it is considered to be noise-dominated and hence unusable.
| Quadrant | # 1 sec bins | Bins with >0 counts | Bins with >2000 counts | High rate bins dominated by noise | Noise dominated (total time) | Noise dominated (detector-on time) | Marked lightcurve |
|---|---|---|---|---|---|---|---|
| A | 7443 | 6118 | 4 | 4 | 0.05% | 0.07% | 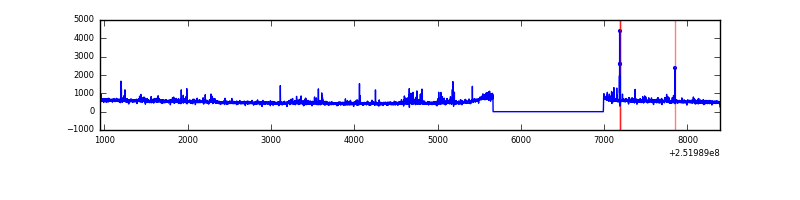 |
| B | 7443 | 6119 | 164 | 164 | 2.20% | 2.68% | 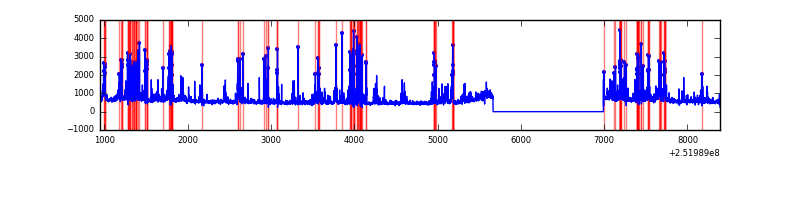 |
| C | 7443 | 6119 | 0 | 0 | 0.00% | 0.00% | 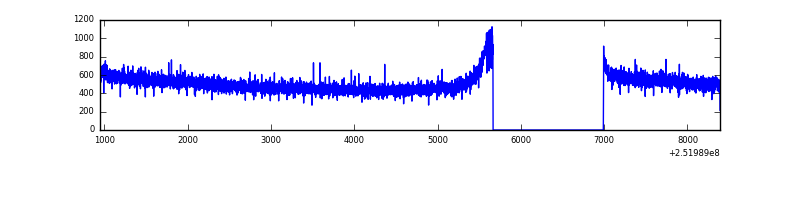 |
| D | 7443 | 6119 | 104 | 104 | 1.40% | 1.70% | 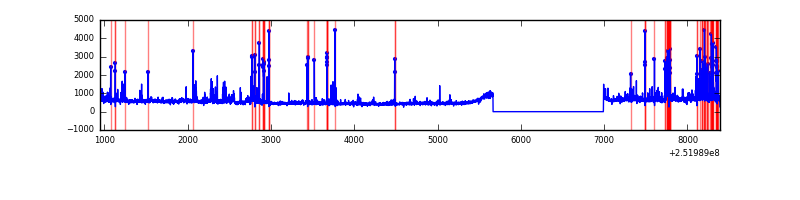 |
Top three noisy pixels from each quadrant. If the there are fewer than three noisy pixels in the level2.evt file, extra rows are filled as -1
| Pixel properties | Quadrant properties | ||||||
|---|---|---|---|---|---|---|---|
| Quadrant | DetID | PixID | Counts | Sigma | Mean | Median | Sigma |
| A | 15 | 239 | 58389 | 359.72 | 810 | 798 | 160.1 |
| A | 1 | 162 | 56584 | 348.44 | 810 | 798 | 160.1 |
| A | 1 | 178 | 25941 | 157.04 | 810 | 798 | 160.1 |
| B | 4 | 239 | 618357 | 4221.27 | 793 | 776 | 146.3 |
| B | 0 | 85 | 225850 | 1538.42 | 793 | 776 | 146.3 |
| B | 3 | 64 | 146914 | 998.88 | 793 | 776 | 146.3 |
| C | 13 | 61 | 5809 | 27.99 | 790 | 794 | 179.2 |
| C | 4 | 175 | 5504 | 26.29 | 790 | 794 | 179.2 |
| C | 15 | 208 | 2706 | 10.67 | 790 | 794 | 179.2 |
| D | 1 | 52 | 337733 | 1807.52 | 783 | 761 | 186.4 |
| D | 5 | 222 | 127915 | 682.05 | 783 | 761 | 186.4 |
| D | 8 | 195 | 96293 | 512.43 | 783 | 761 | 186.4 |
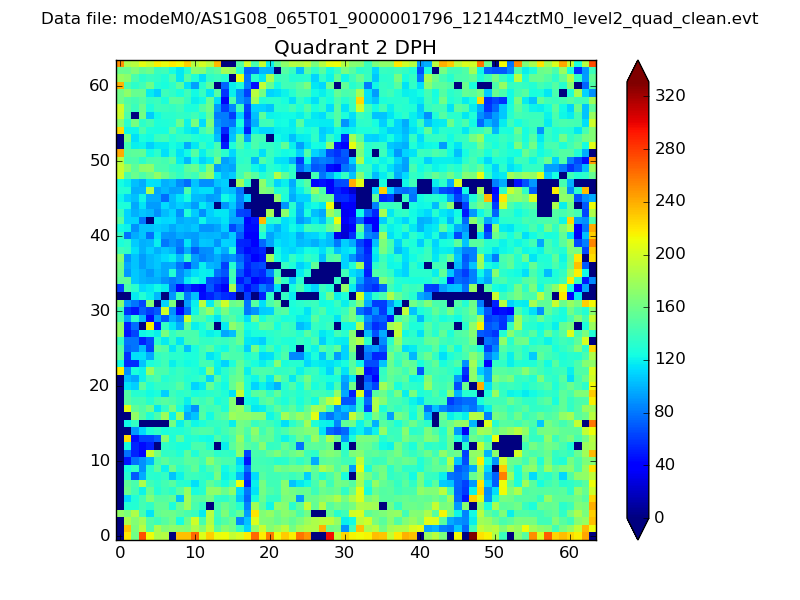
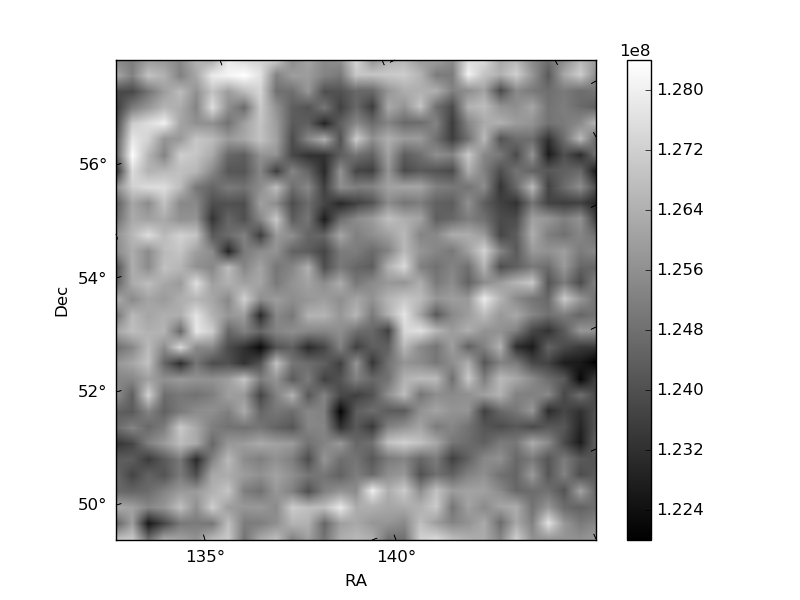
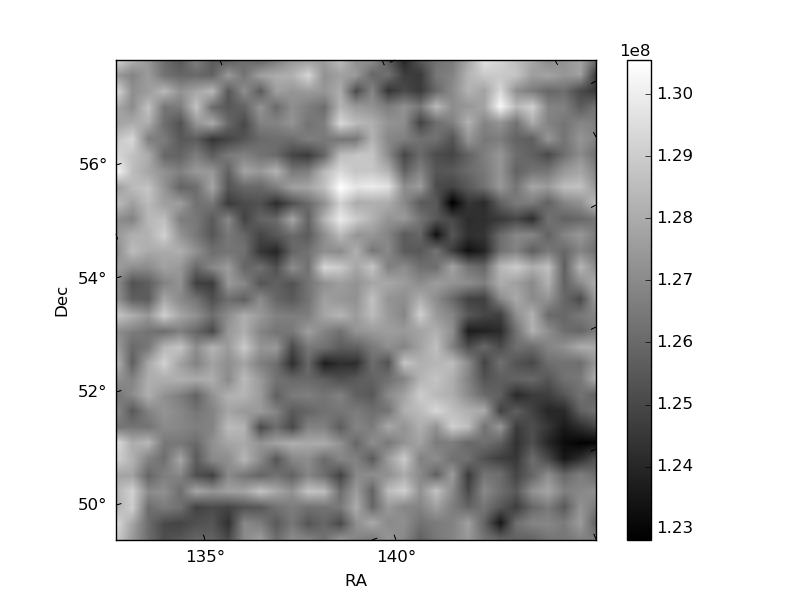
Histogram calculated using DETX and DETY for each event in the final _common_clean file
| Quadrant A | 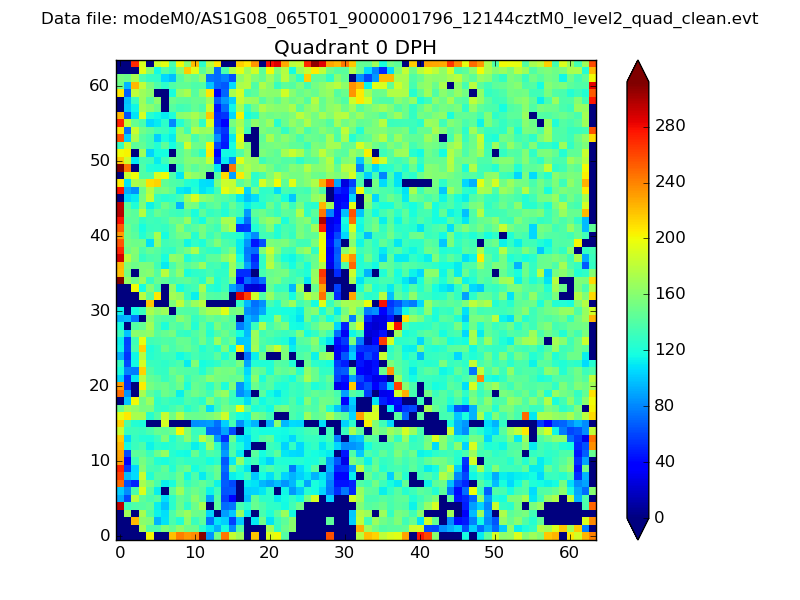 |
 |
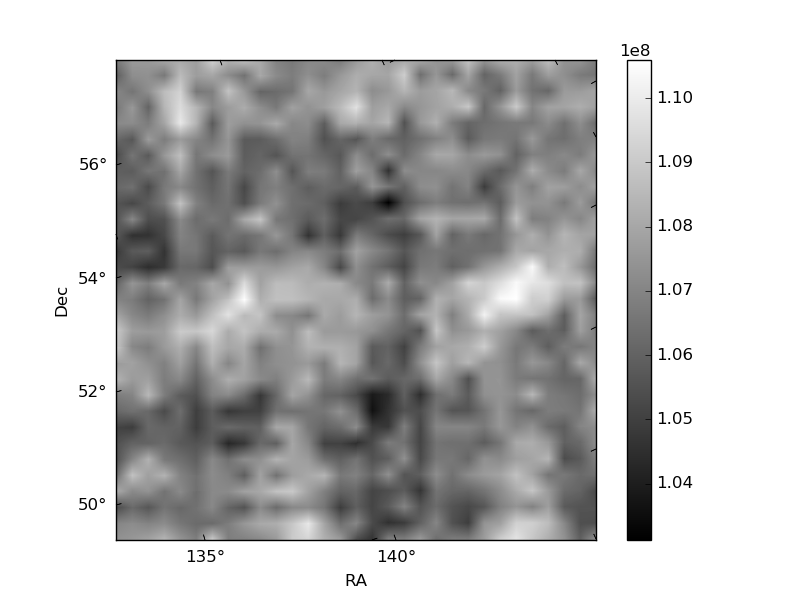
Quadrant B |
|---|---|---|---|
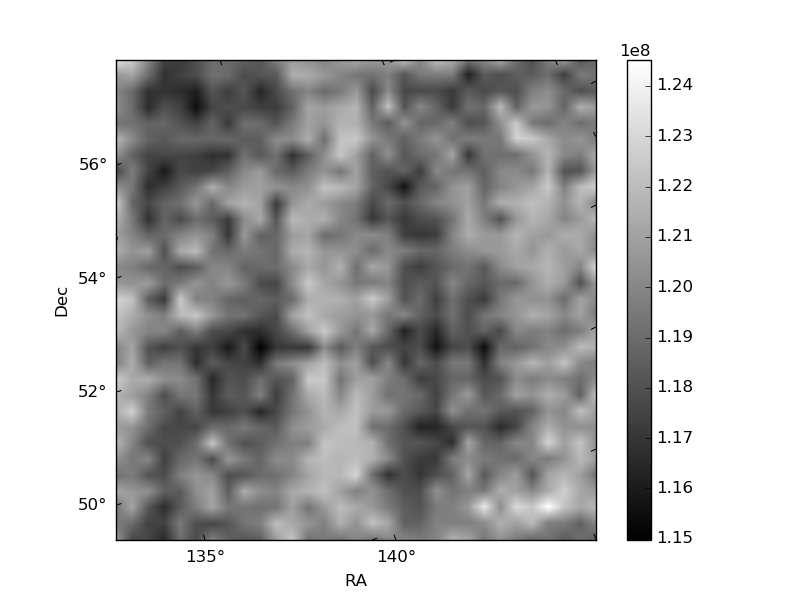
| Quadrant D |  |
 |
Quadrant C |
| Plot type | Count rate plots | Images |
|---|---|---|
| Comparison with Poisson distribution Blue bars denote a histogram of data divided into 1 sec bins. Red curve is a Poisson curve with rate = median count rate of data. |
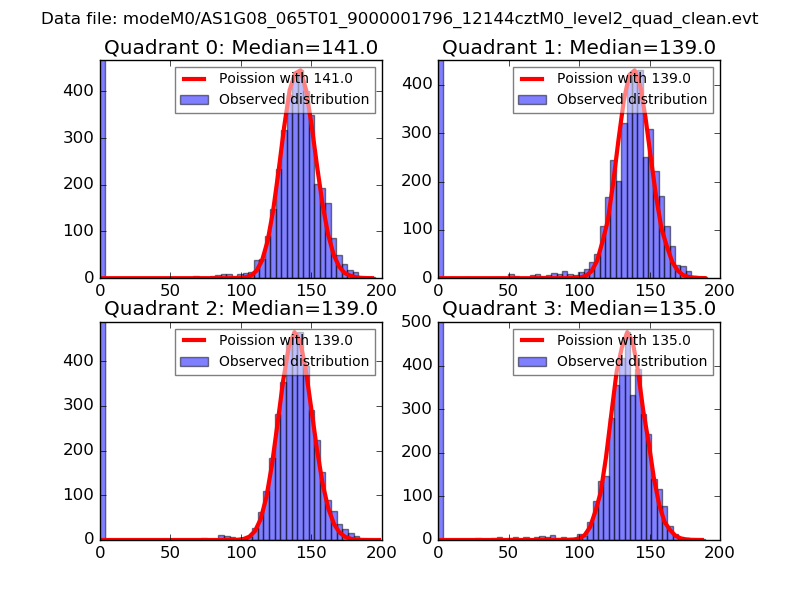 |
 |
| Quadrant-wise count rates Data is divided into 100 sec bins |
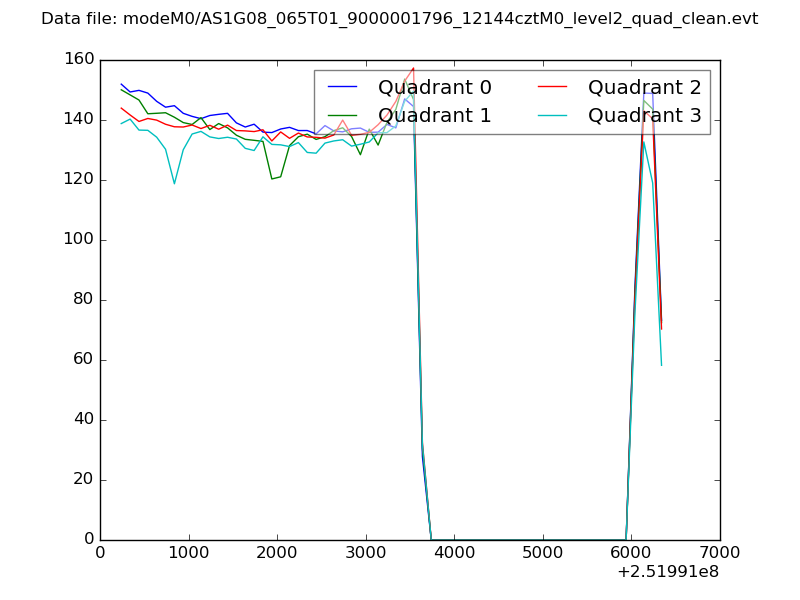 |
|
| Module-wise count rates for Quadrant A Data is divided into 100 sec bins |
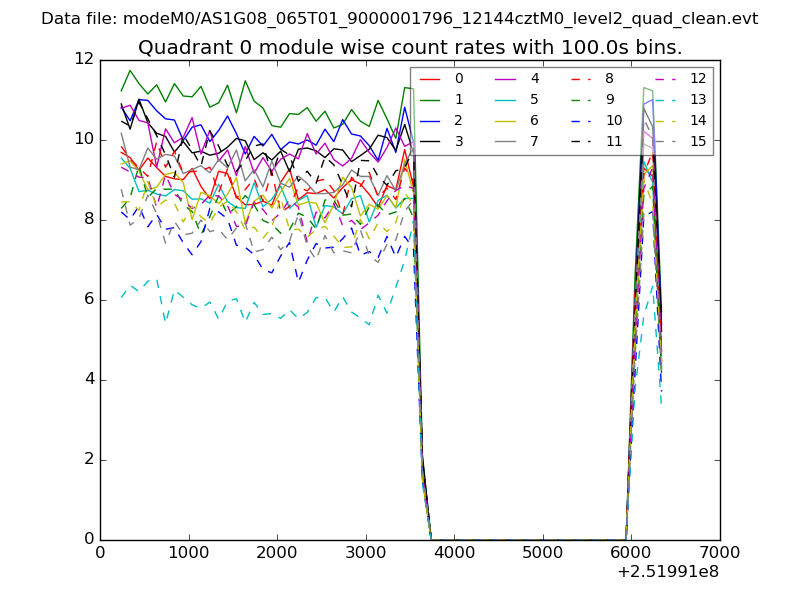 |
 |
| Module-wise count rates for Quadrant B Data is divided into 100 sec bins |
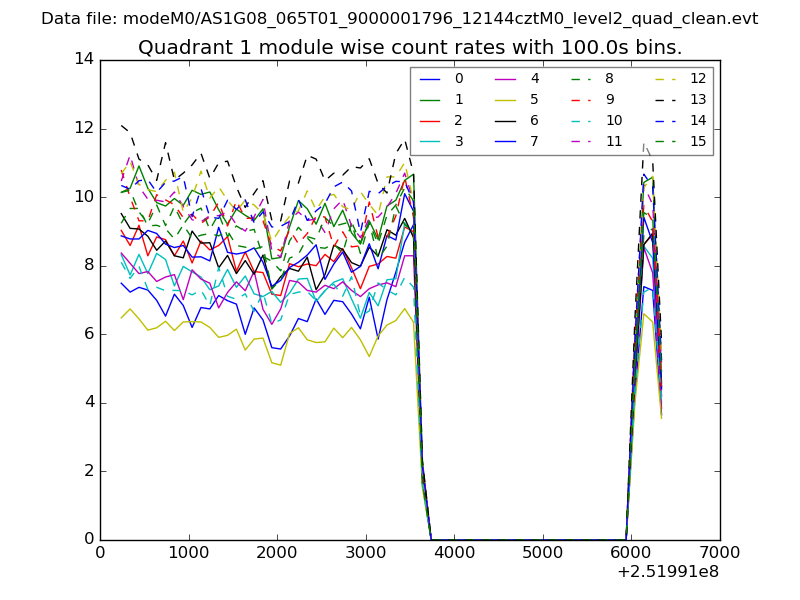 |
 |
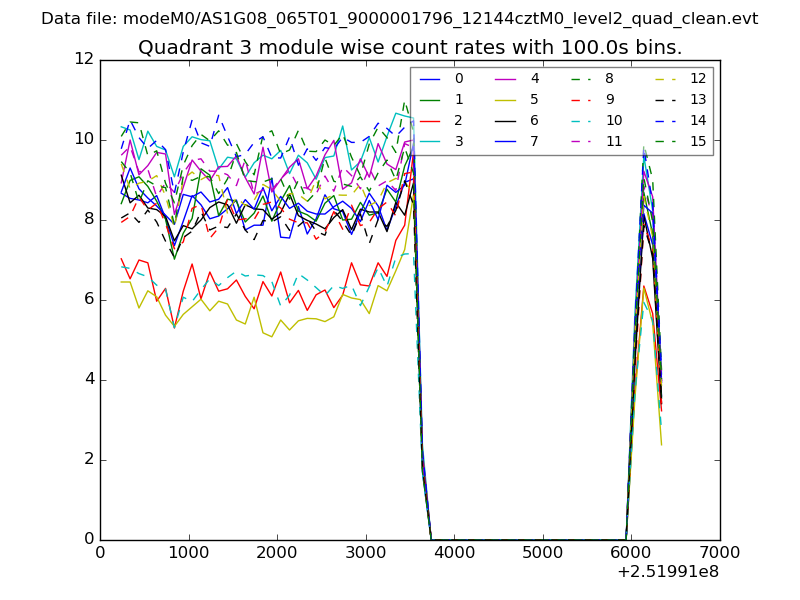
| Module-wise count rates for Quadrant C Data is divided into 100 sec bins |
 |
 |
| Module-wise count rates for Quadrant D Data is divided into 100 sec bins |
 |
 |
| Parameter | Plot |
|---|---|
| CZT HV Monitor | 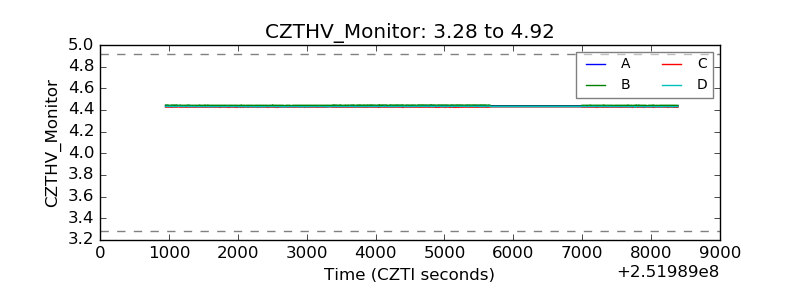 |
| D_VDD | 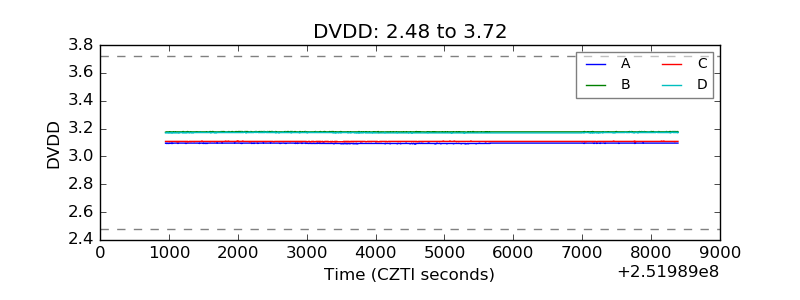 |
| Temperature 1 | 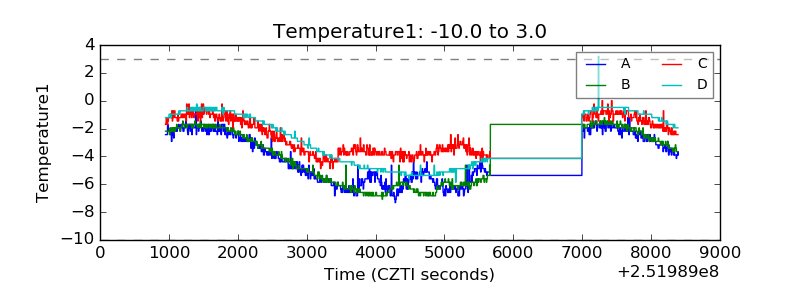 |
| Veto HV Monitor | 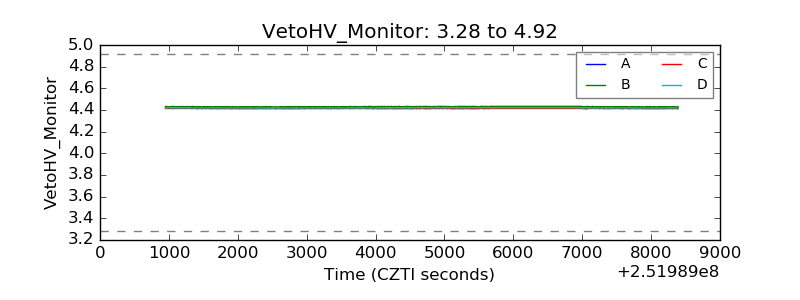 |
| Veto LLD | 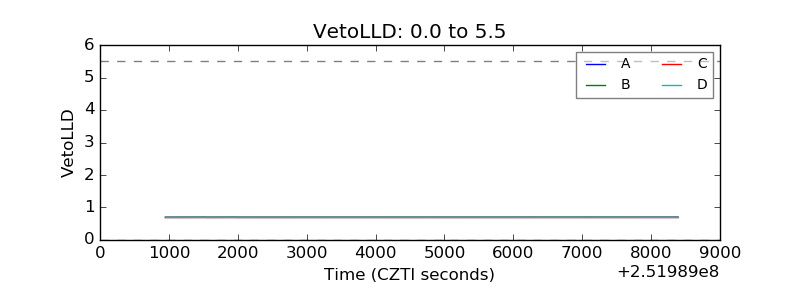 |
| Alpha Counter | 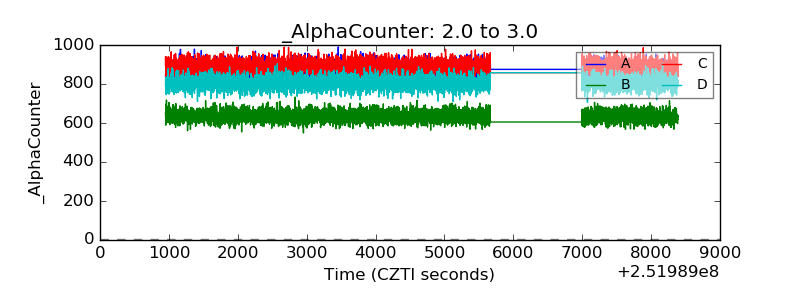 |
| _CPM_Rate | 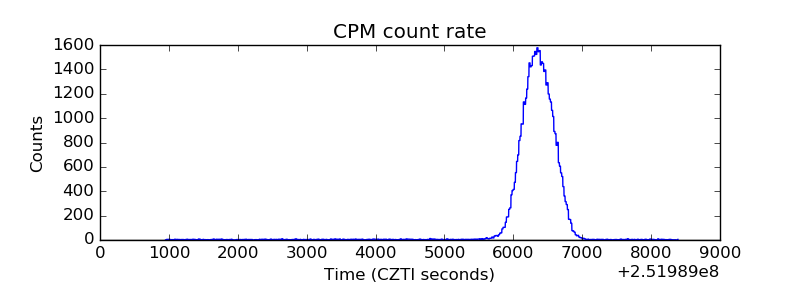 |
| CZT Counter | 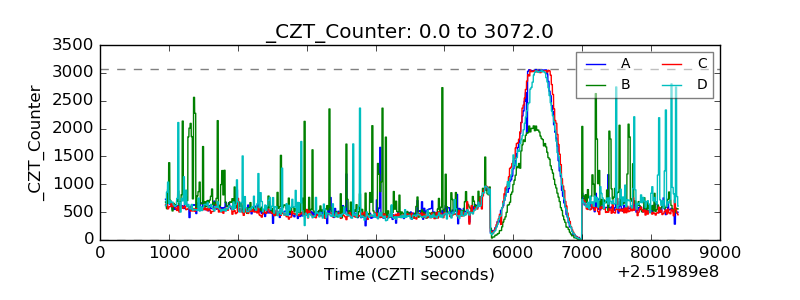 |
| +2.5 Volts monitor |  |
| +5 Volts monitor |  |
| _ROLL_ROT | 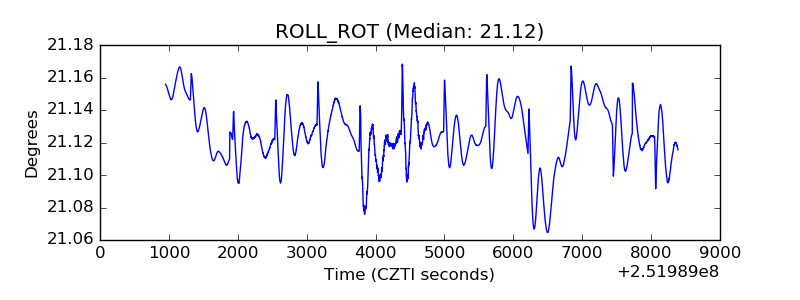 |
| _Roll_DEC | 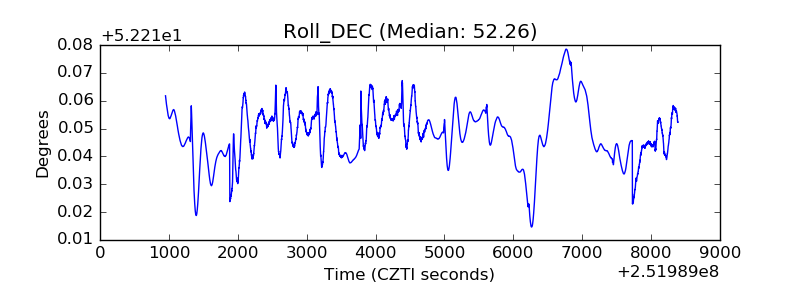 |
| _Roll_RA | 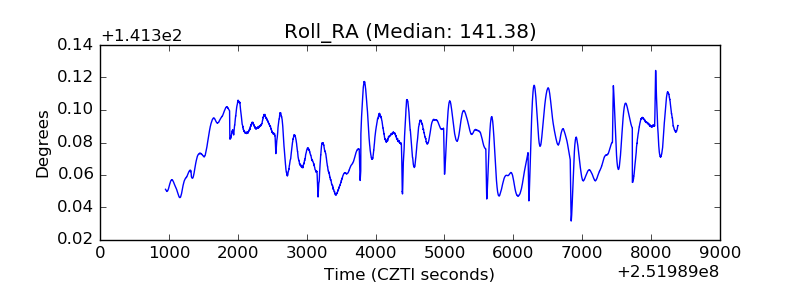 |
| Veto Counter | 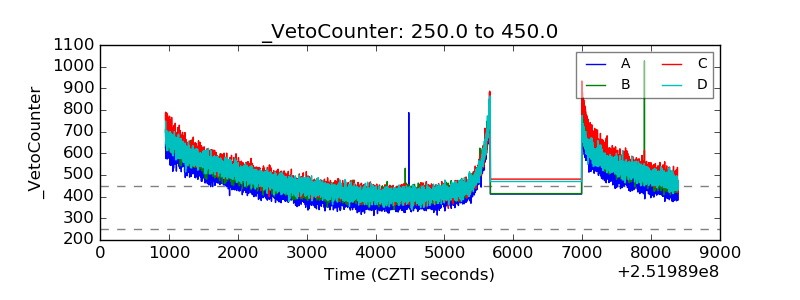 |