| Param | Original file | Final file |
|---|---|---|
| Filename | modeM0/AS1G08_065T01_9000001796_12145cztM0_level2.evt | modeM0/AS1G08_065T01_9000001796_12145cztM0_level2_quad_clean.evt |
| Size (bytes) | 544,665,600 | 93,942,720 |
| Size | 519.4 MB | 89.6 MB |
| Events in quadrant A | 3,323,484 | 620,494 |
| Events in quadrant B | 4,137,676 | 612,266 |
| Events in quadrant C | 3,122,000 | 611,925 |
| Events in quadrant D | 5,481,411 | 556,861 |
| Mode M0 | |||
|---|---|---|---|
| Quadrant | BADHDUFLAG | Total packets | Discarded packets |
| A | 0 | 13946 | 3 |
| B | 0 | 16470 | 2 |
| C | 0 | 13306 | 2 |
| D | 0 | 20711 | 2 |
| Mode M9 | |||
|---|---|---|---|
| Quadrant | BADHDUFLAG | Total packets | Discarded packets |
| A | 0 | 19 | 0 |
| B | 0 | 19 | 0 |
| C | 0 | 19 | 0 |
| D | 0 | 20 | 0 |
| Mode SS | |||
|---|---|---|---|
| Quadrant | BADHDUFLAG | Total packets | Discarded packets |
| A | 0 | 130 | 0 |
| B | 0 | 130 | 0 |
| C | 0 | 130 | 0 |
| D | 0 | 130 | 0 |
| Quadrant | Total seconds | Saturated seconds | Saturation percentage |
|---|---|---|---|
| A | 6349 | 122 | 1.921562% |
| B | 6349 | 291 | 4.583399% |
| C | 6349 | 84 | 1.323043% |
| D | 6349 | 674 | 10.615845% |
Noise dominated data is calculated using 1-second bins in cleaned event files. If a bin has >2000 counts, and if more than 50% of those come from <1% of pixels, then it is considered to be noise-dominated and hence unusable.
| Quadrant | # 1 sec bins | Bins with >0 counts | Bins with >2000 counts | High rate bins dominated by noise | Noise dominated (total time) | Noise dominated (detector-on time) | Marked lightcurve |
|---|---|---|---|---|---|---|---|
| A | 7545 | 6351 | 4 | 4 | 0.05% | 0.06% | 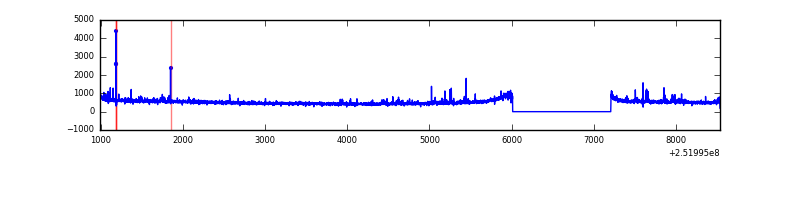 |
| B | 7545 | 6351 | 110 | 110 | 1.46% | 1.73% | 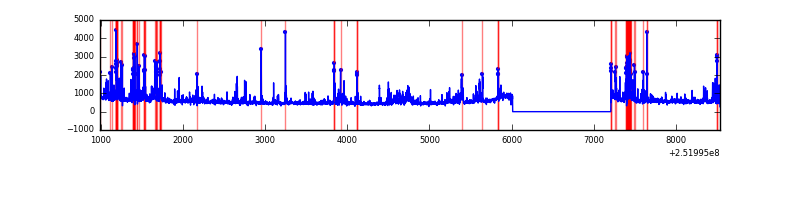 |
| C | 7545 | 6351 | 0 | 0 | 0.00% | 0.00% | 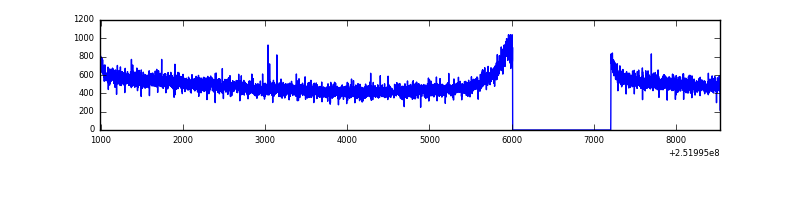 |
| D | 7545 | 6351 | 555 | 555 | 7.36% | 8.74% | 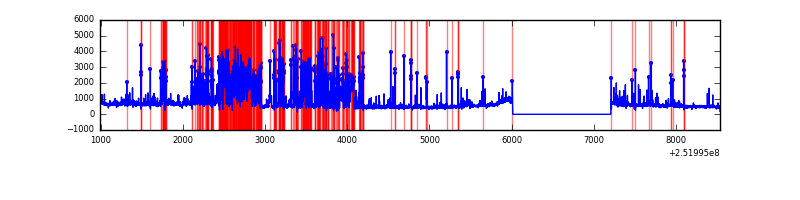 |
Top three noisy pixels from each quadrant. If the there are fewer than three noisy pixels in the level2.evt file, extra rows are filled as -1
| Pixel properties | Quadrant properties | ||||||
|---|---|---|---|---|---|---|---|
| Quadrant | DetID | PixID | Counts | Sigma | Mean | Median | Sigma |
| A | 15 | 239 | 56656 | 344.03 | 816 | 802 | 162.4 |
| A | 1 | 162 | 47928 | 290.27 | 816 | 802 | 162.4 |
| A | 1 | 178 | 21513 | 127.57 | 816 | 802 | 162.4 |
| B | 4 | 239 | 450813 | 3020.7 | 801 | 782 | 149.0 |
| B | 0 | 85 | 171275 | 1144.39 | 801 | 782 | 149.0 |
| B | 3 | 64 | 128657 | 858.32 | 801 | 782 | 149.0 |
| C | 13 | 61 | 5860 | 27.8 | 800 | 805 | 181.8 |
| C | 12 | 4 | 3244 | 13.41 | 800 | 805 | 181.8 |
| C | 4 | 175 | 2549 | 9.59 | 800 | 805 | 181.8 |
| D | 1 | 52 | 2039075 | 10989.64 | 773 | 749 | 185.5 |
| D | 5 | 222 | 205029 | 1101.38 | 773 | 749 | 185.5 |
| D | 8 | 195 | 158807 | 852.17 | 773 | 749 | 185.5 |
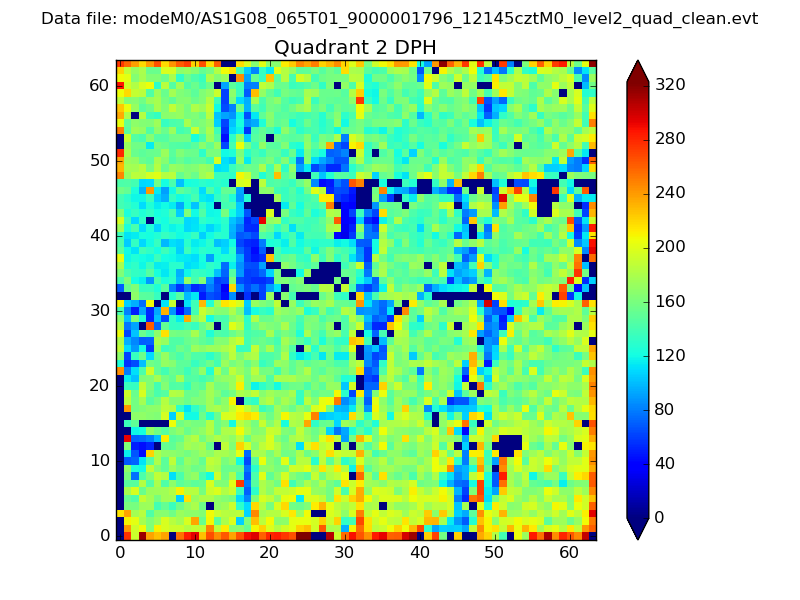
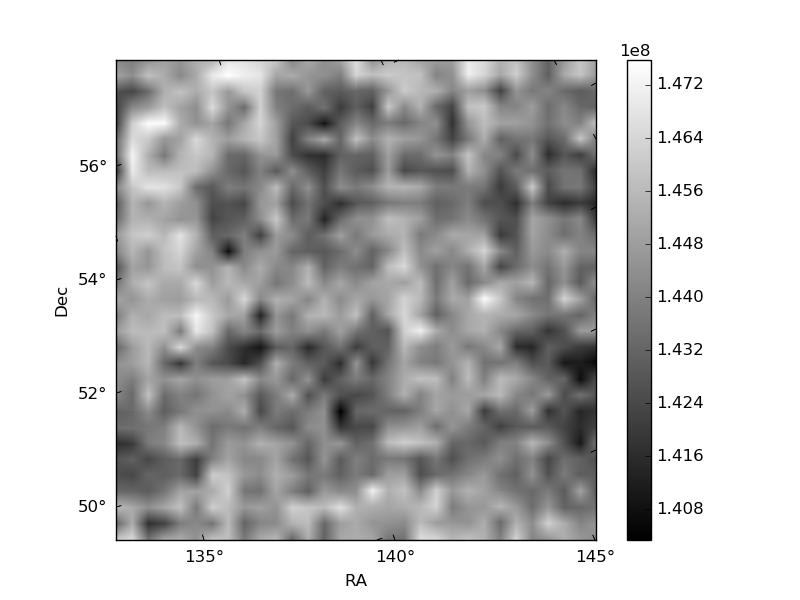
Histogram calculated using DETX and DETY for each event in the final _common_clean file
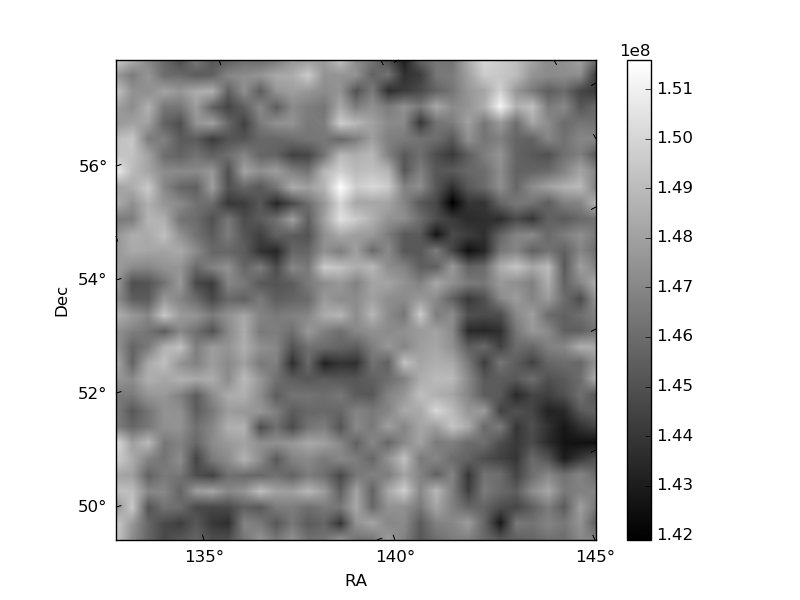
| Quadrant A | 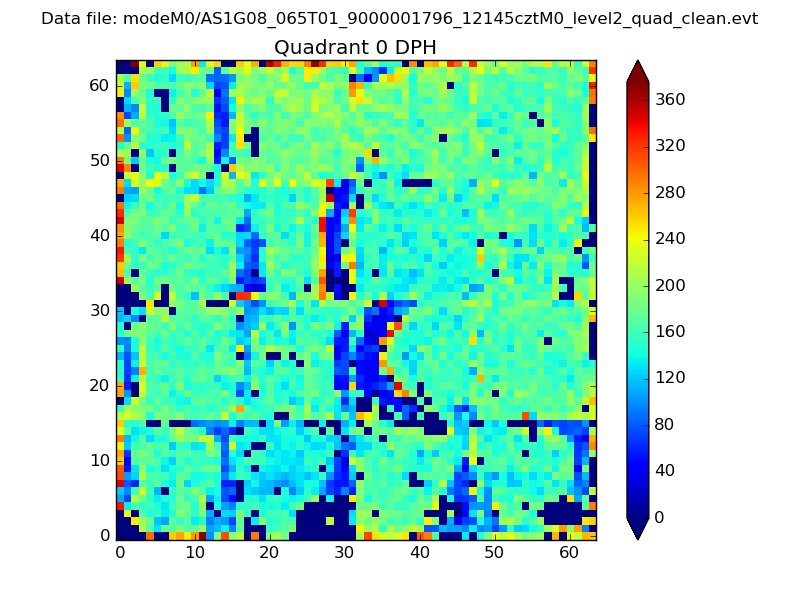 |
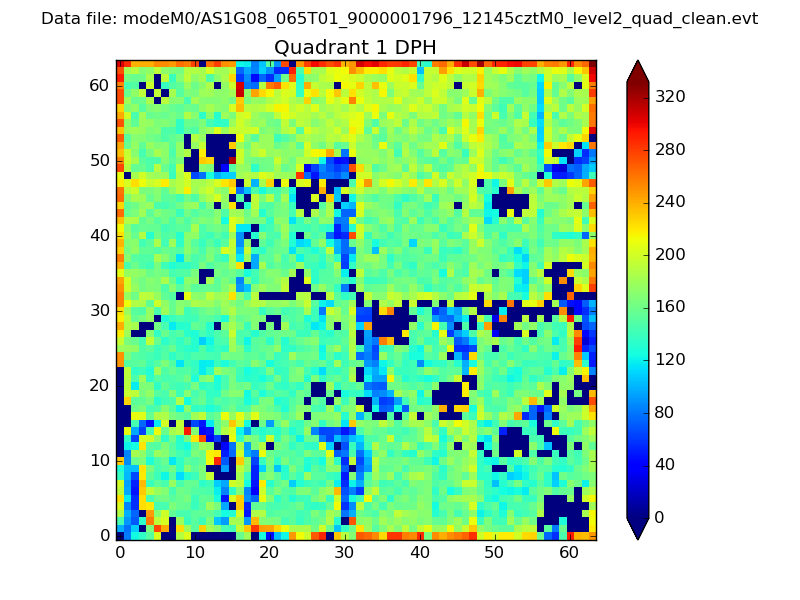 |
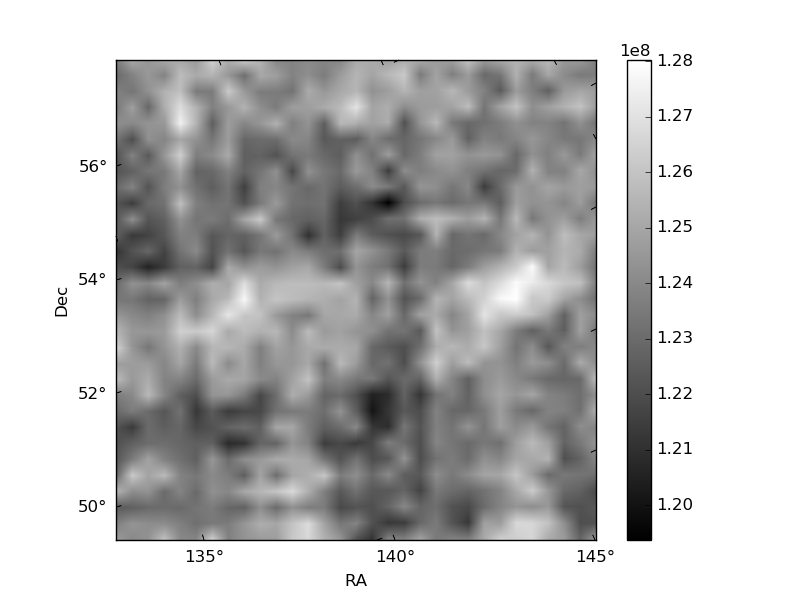
Quadrant B |
|---|---|---|---|
| Quadrant D | 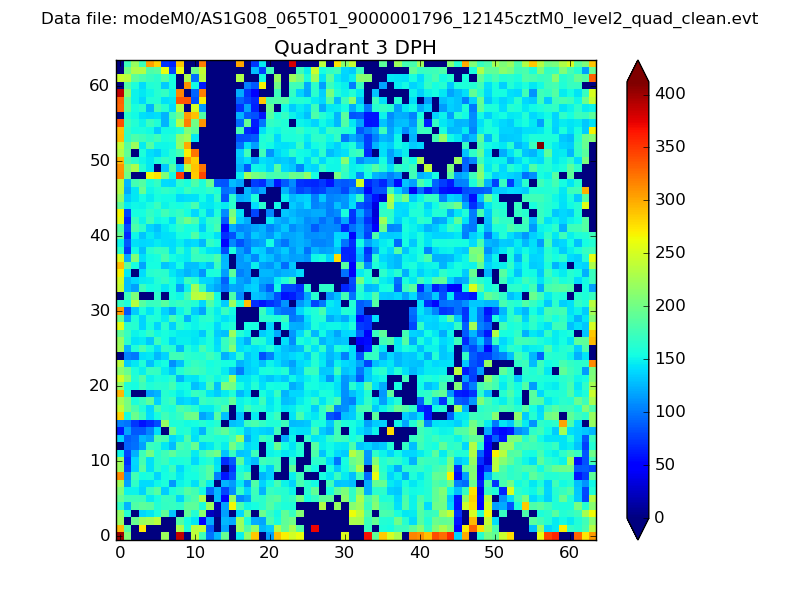 |
 |
Quadrant C |
| Plot type | Count rate plots | Images |
|---|---|---|
| Comparison with Poisson distribution Blue bars denote a histogram of data divided into 1 sec bins. Red curve is a Poisson curve with rate = median count rate of data. |
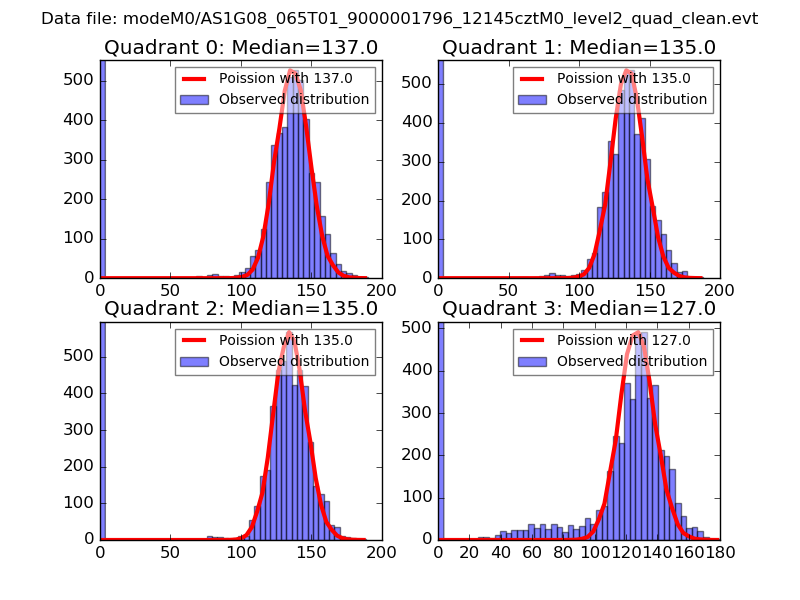 |
 |
| Quadrant-wise count rates Data is divided into 100 sec bins |
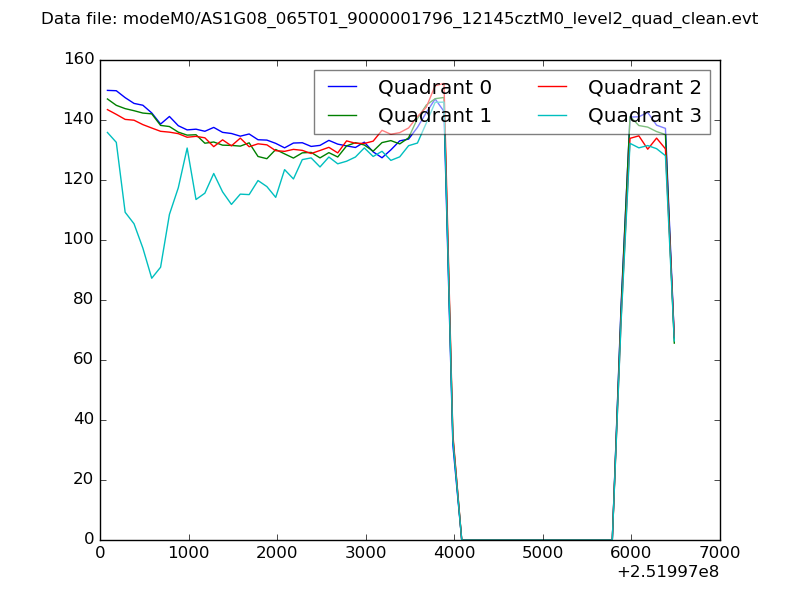 |
|
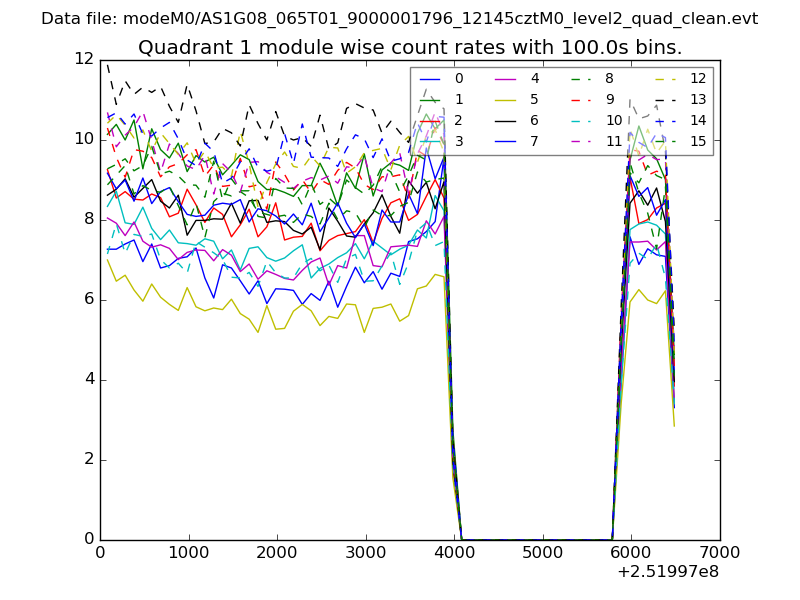
| Module-wise count rates for Quadrant A Data is divided into 100 sec bins |
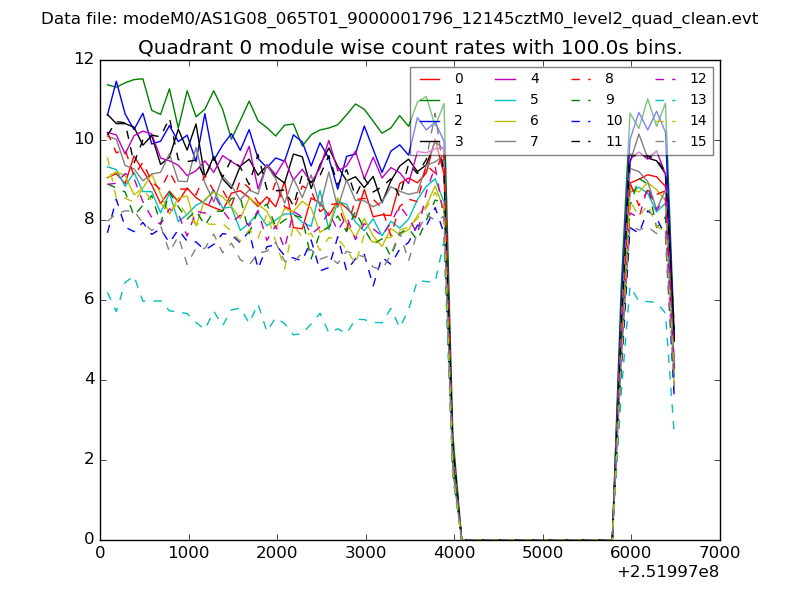 |
 |
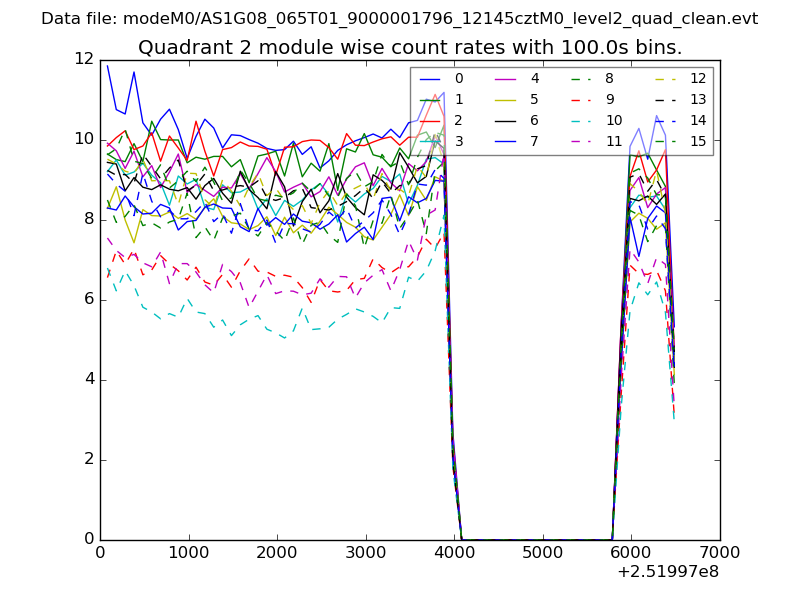
| Module-wise count rates for Quadrant B Data is divided into 100 sec bins |
 |
 |
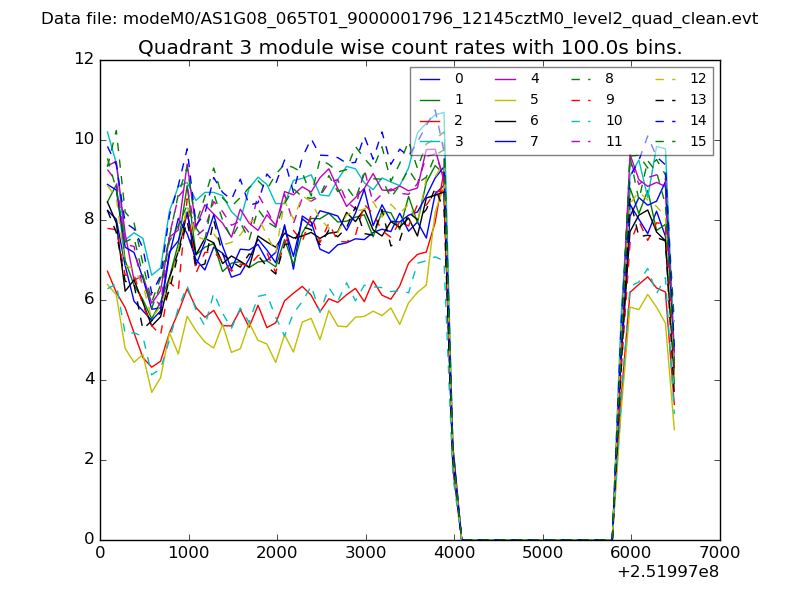
| Module-wise count rates for Quadrant C Data is divided into 100 sec bins |
 |
 |
| Module-wise count rates for Quadrant D Data is divided into 100 sec bins |
 |
 |
| Parameter | Plot |
|---|---|
| CZT HV Monitor | 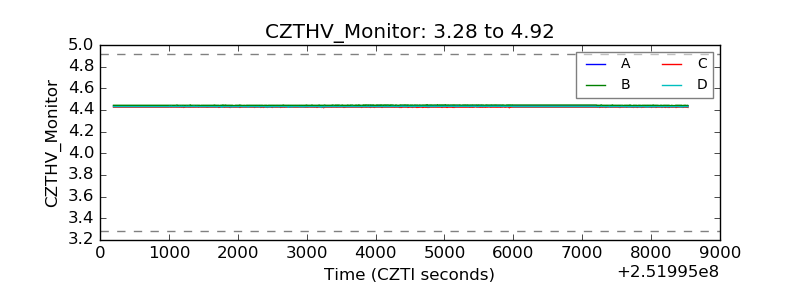 |
| D_VDD | 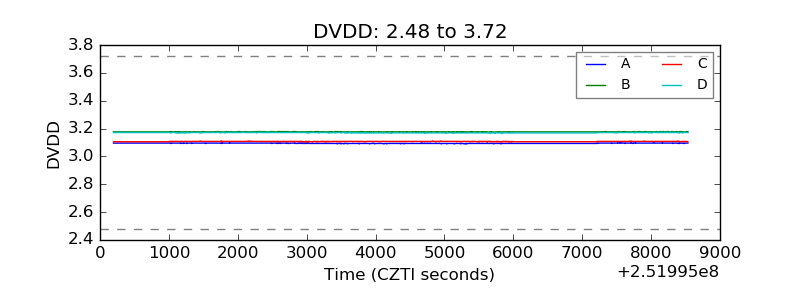 |
| Temperature 1 | 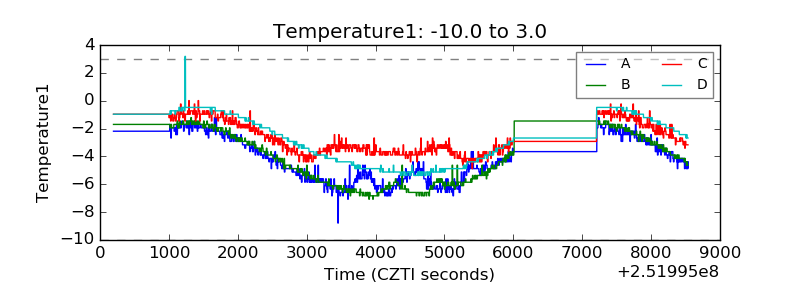 |
| Veto HV Monitor | 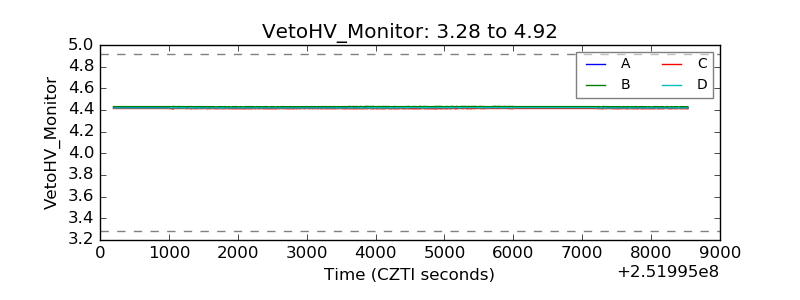 |
| Veto LLD | 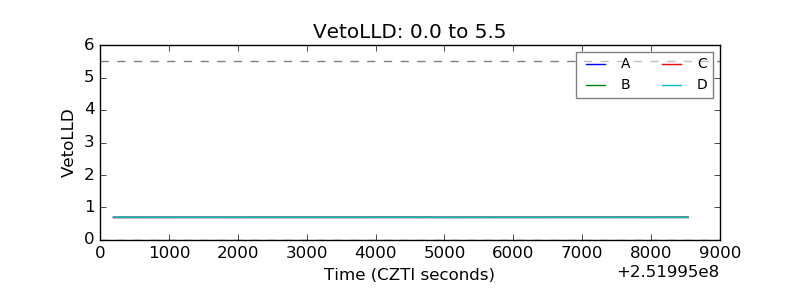 |
| Alpha Counter | 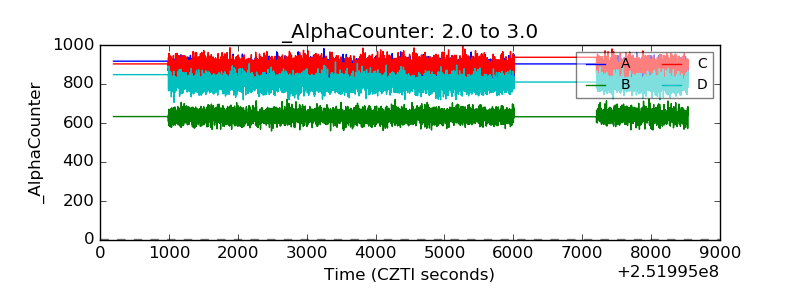 |
| _CPM_Rate | 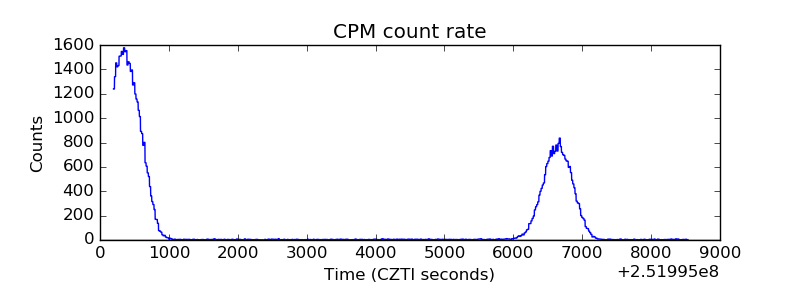 |
| CZT Counter |  |
| +2.5 Volts monitor |  |
| +5 Volts monitor |  |
| _ROLL_ROT | 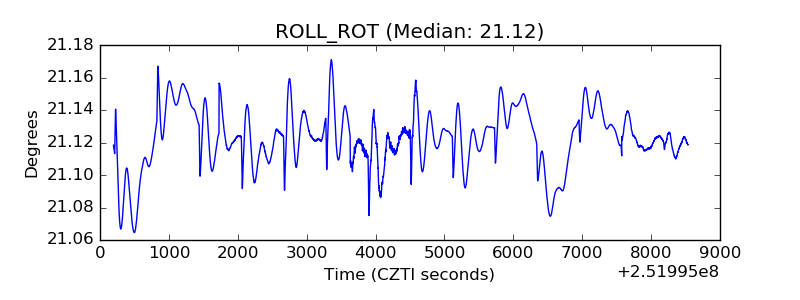 |
| _Roll_DEC | 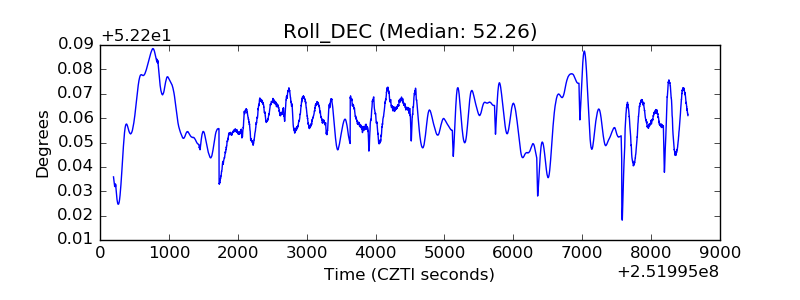 |
| _Roll_RA |  |
| Veto Counter | 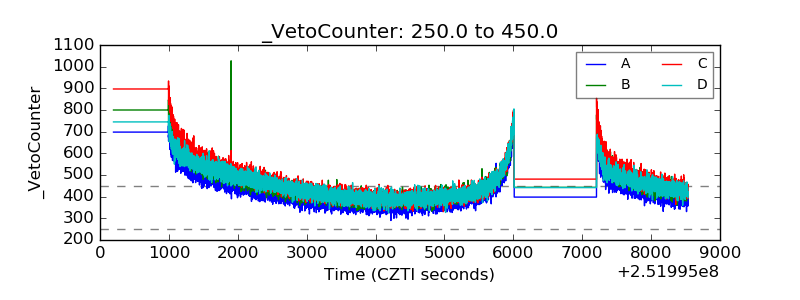 |