| Param | Original file | Final file |
|---|---|---|
| Filename | modeM0/AS1G08_065T01_9000001796_12147cztM0_level2.evt | modeM0/AS1G08_065T01_9000001796_12147cztM0_level2_quad_clean.evt |
| Size (bytes) | 573,845,760 | 108,239,040 |
| Size | 547.3 MB | 103.2 MB |
| Events in quadrant A | 3,916,149 | 699,411 |
| Events in quadrant B | 5,094,427 | 683,927 |
| Events in quadrant C | 3,611,356 | 684,572 |
| Events in quadrant D | 4,227,161 | 667,085 |
| Mode M0 | |||
|---|---|---|---|
| Quadrant | BADHDUFLAG | Total packets | Discarded packets |
| A | 0 | 16872 | 3 |
| B | 0 | 20377 | 2 |
| C | 0 | 16168 | 2 |
| D | 0 | 17840 | 2 |
| Mode M9 | |||
|---|---|---|---|
| Quadrant | BADHDUFLAG | Total packets | Discarded packets |
| A | 0 | 14 | 0 |
| B | 0 | 14 | 0 |
| C | 0 | 14 | 0 |
| D | 0 | 14 | 0 |
| Mode SS | |||
|---|---|---|---|
| Quadrant | BADHDUFLAG | Total packets | Discarded packets |
| A | 0 | 160 | 0 |
| B | 0 | 160 | 0 |
| C | 0 | 160 | 0 |
| D | 0 | 160 | 0 |
| Quadrant | Total seconds | Saturated seconds | Saturation percentage |
|---|---|---|---|
| A | 7811 | 134 | 1.715529% |
| B | 7811 | 428 | 5.479452% |
| C | 7811 | 82 | 1.049802% |
| D | 7811 | 138 | 1.766739% |
Noise dominated data is calculated using 1-second bins in cleaned event files. If a bin has >2000 counts, and if more than 50% of those come from <1% of pixels, then it is considered to be noise-dominated and hence unusable.
| Quadrant | # 1 sec bins | Bins with >0 counts | Bins with >2000 counts | High rate bins dominated by noise | Noise dominated (total time) | Noise dominated (detector-on time) | Marked lightcurve |
|---|---|---|---|---|---|---|---|
| A | 9237 | 7814 | 5 | 5 | 0.05% | 0.06% | 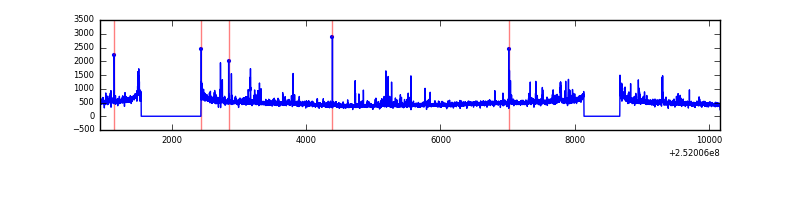 |
| B | 9237 | 7814 | 138 | 138 | 1.49% | 1.77% | 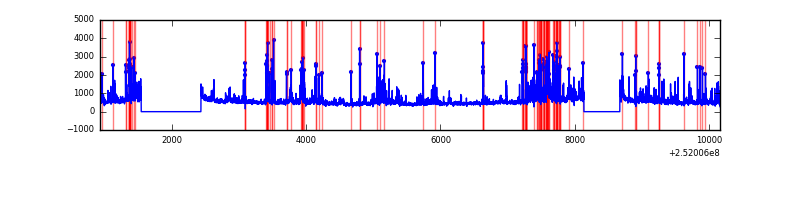 |
| C | 9237 | 7814 | 1 | 1 | 0.01% | 0.01% | 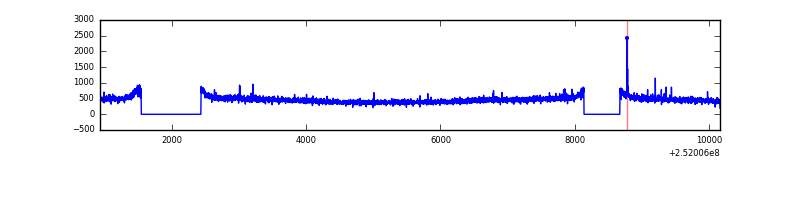 |
| D | 9237 | 7814 | 32 | 32 | 0.35% | 0.41% | 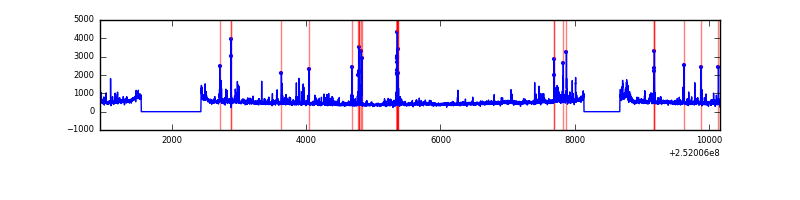 |
Top three noisy pixels from each quadrant. If the there are fewer than three noisy pixels in the level2.evt file, extra rows are filled as -1
| Pixel properties | Quadrant properties | ||||||
|---|---|---|---|---|---|---|---|
| Quadrant | DetID | PixID | Counts | Sigma | Mean | Median | Sigma |
| A | 1 | 162 | 81613 | 425.83 | 941 | 922 | 189.5 |
| A | 15 | 239 | 57641 | 299.32 | 941 | 922 | 189.5 |
| A | 13 | 248 | 35773 | 183.92 | 941 | 922 | 189.5 |
| B | 4 | 239 | 704506 | 3991.48 | 927 | 902 | 176.3 |
| B | 3 | 64 | 236598 | 1337.08 | 927 | 902 | 176.3 |
| B | 11 | 51 | 154320 | 870.32 | 927 | 902 | 176.3 |
| C | 15 | 208 | 9899 | 42.14 | 920 | 922 | 213.0 |
| C | 13 | 61 | 6799 | 27.59 | 920 | 922 | 213.0 |
| C | 0 | 207 | 5891 | 23.33 | 920 | 922 | 213.0 |
| D | 1 | 52 | 232100 | 1060.62 | 916 | 891 | 218.0 |
| D | 8 | 195 | 144423 | 658.42 | 916 | 891 | 218.0 |
| D | 10 | 157 | 92791 | 421.57 | 916 | 891 | 218.0 |
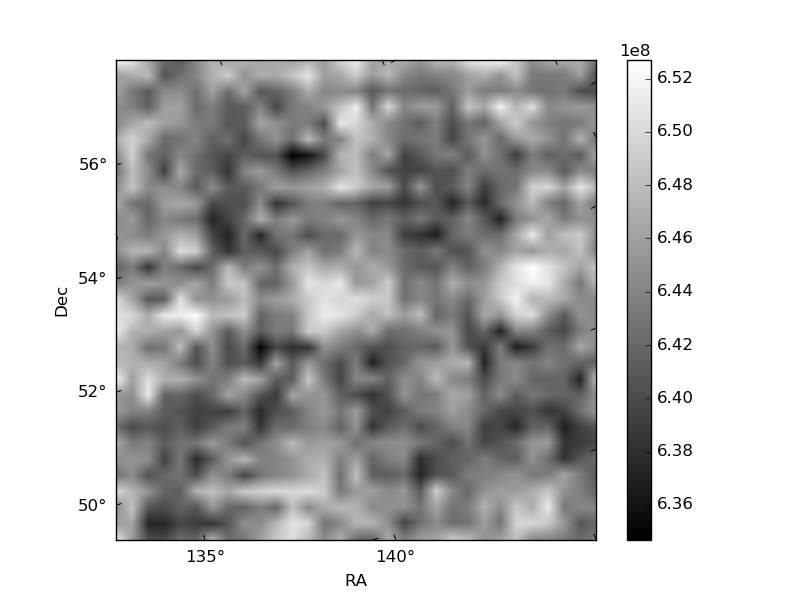
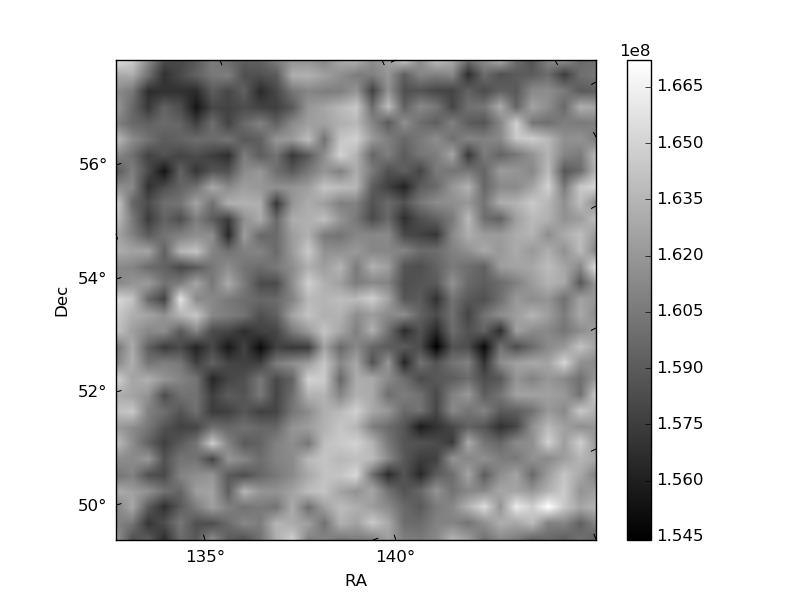
Histogram calculated using DETX and DETY for each event in the final _common_clean file
| Quadrant A | 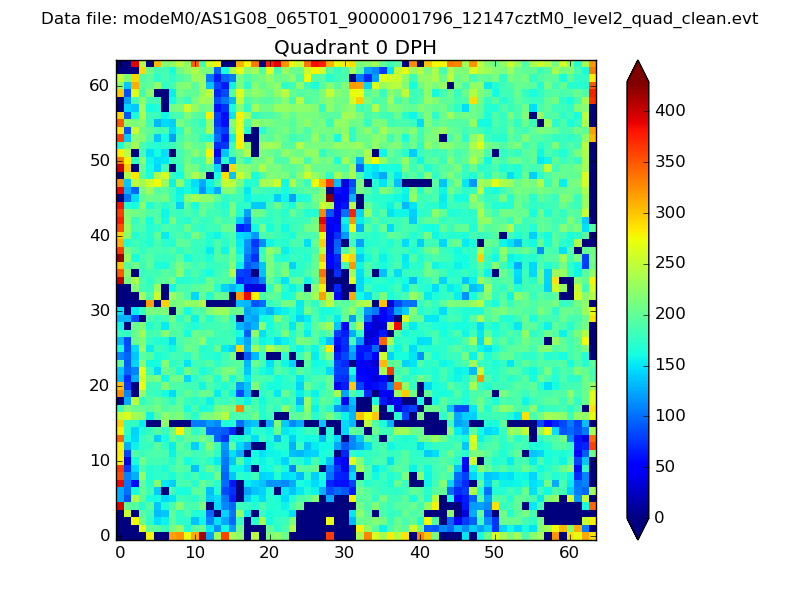 |
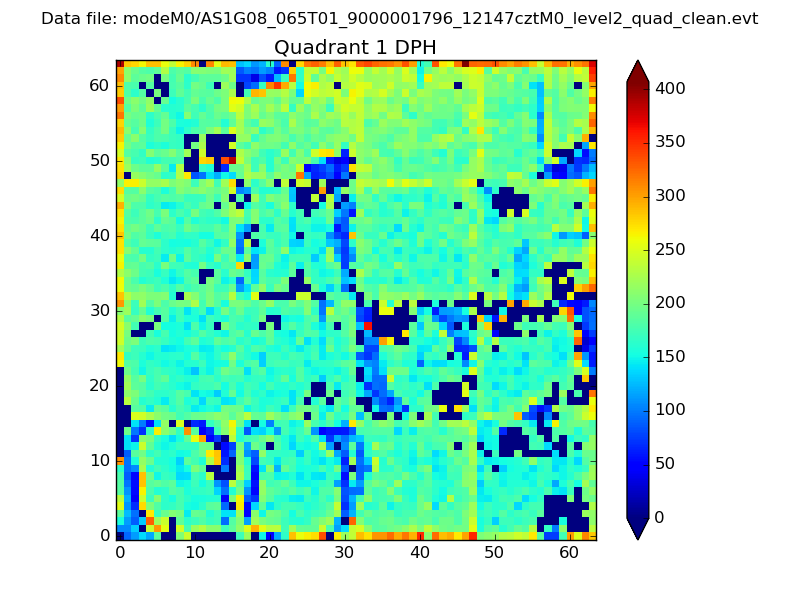 |
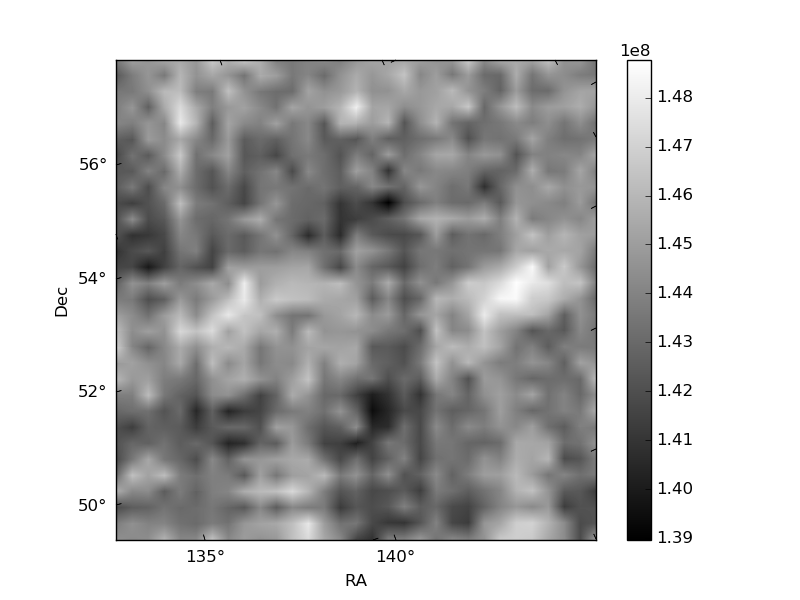
Quadrant B |
|---|---|---|---|
| Quadrant D | 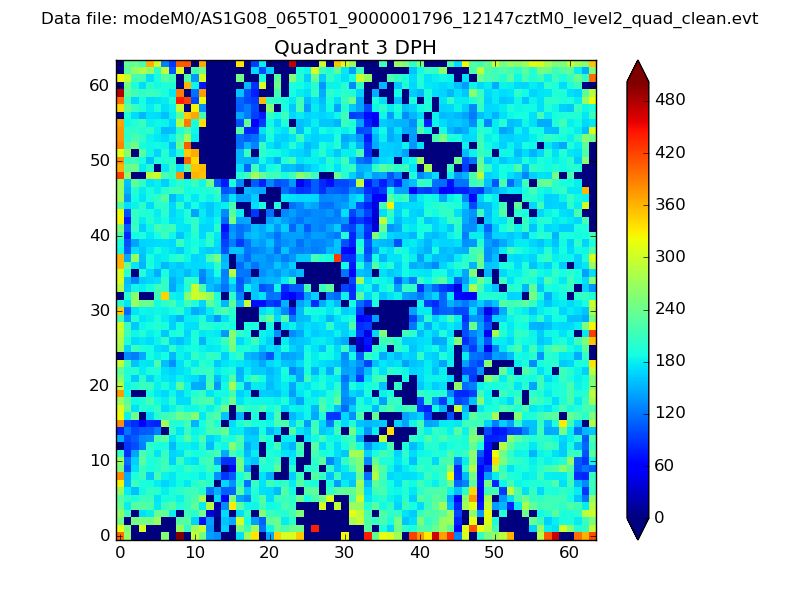 |
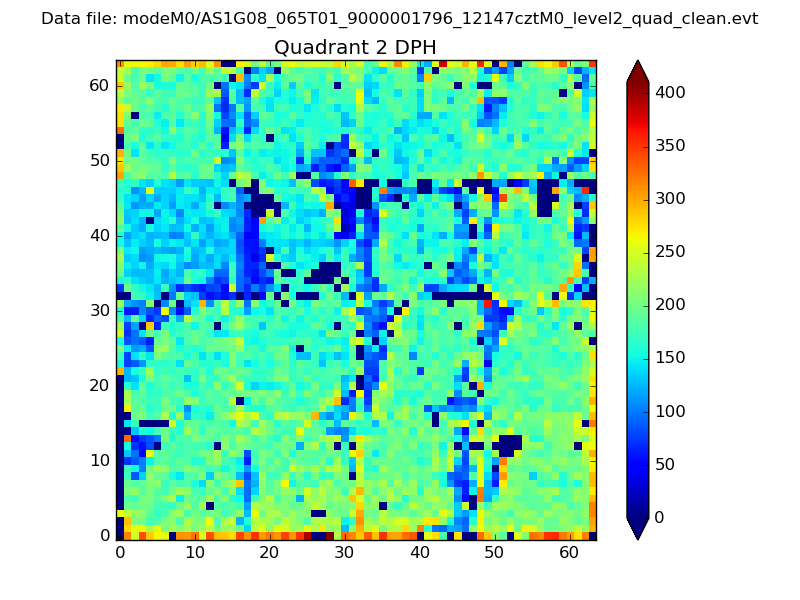 |
Quadrant C |
| Plot type | Count rate plots | Images |
|---|---|---|
| Comparison with Poisson distribution Blue bars denote a histogram of data divided into 1 sec bins. Red curve is a Poisson curve with rate = median count rate of data. |
 |
 |
| Quadrant-wise count rates Data is divided into 100 sec bins |
 |
|
| Module-wise count rates for Quadrant A Data is divided into 100 sec bins |
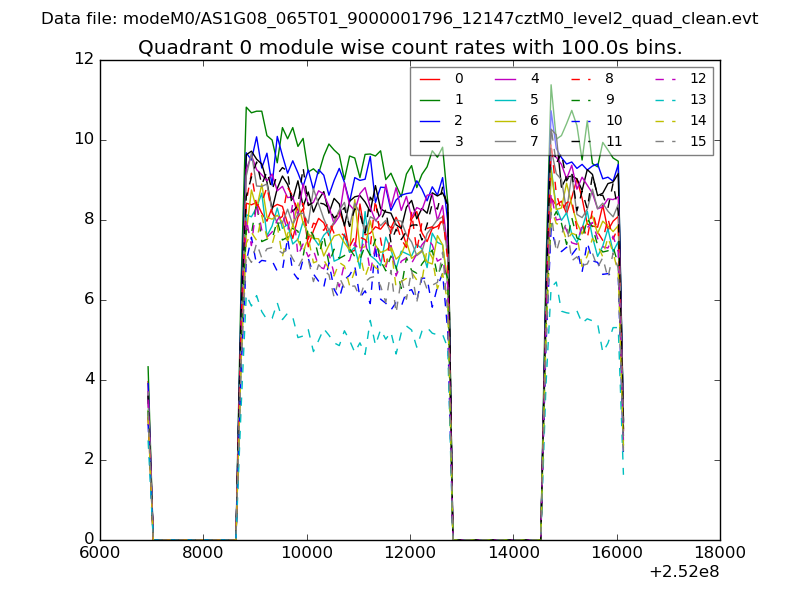 |
 |
| Module-wise count rates for Quadrant B Data is divided into 100 sec bins |
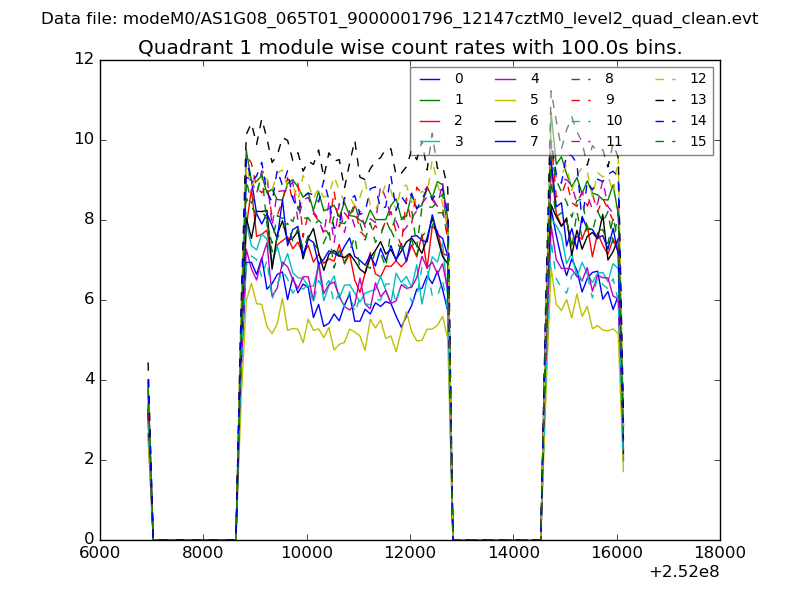 |
 |
| Module-wise count rates for Quadrant C Data is divided into 100 sec bins |
 |
 |
| Module-wise count rates for Quadrant D Data is divided into 100 sec bins |
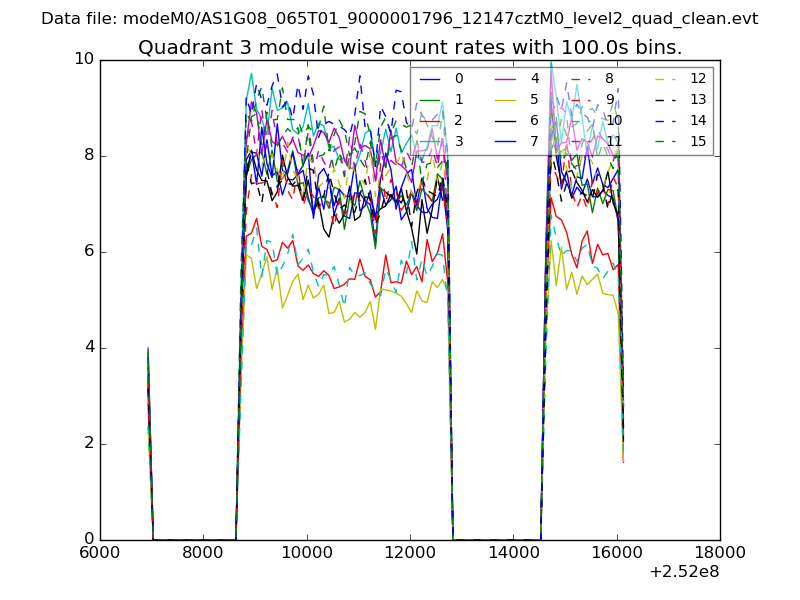 |
 |
| Parameter | Plot |
|---|---|
| CZT HV Monitor |  |
| D_VDD | 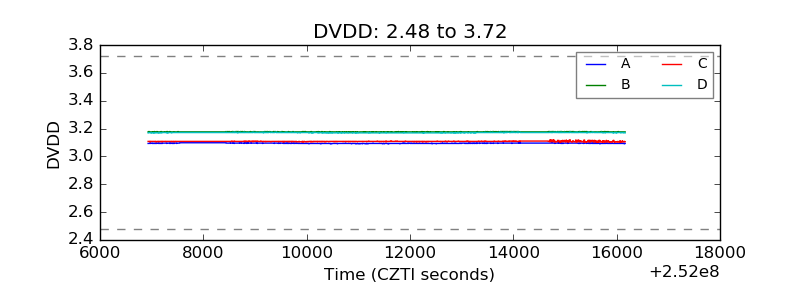 |
| Temperature 1 | 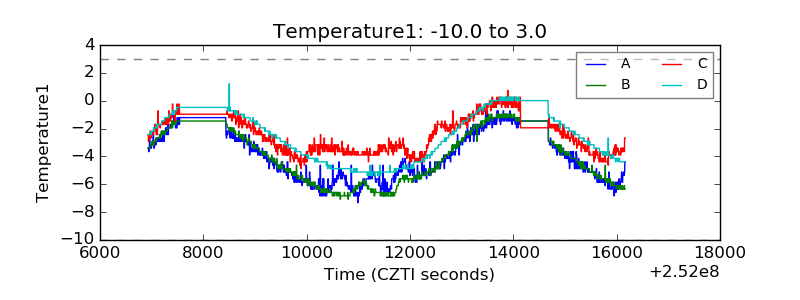 |
| Veto HV Monitor | 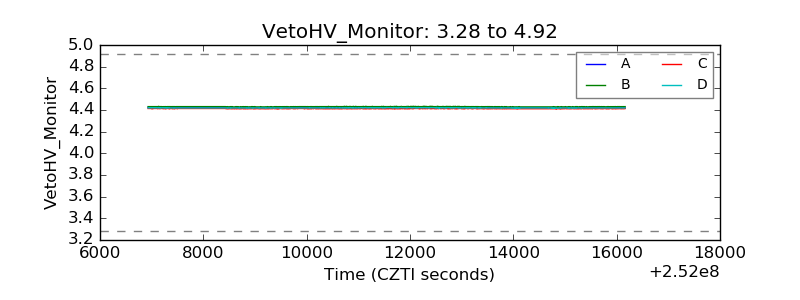 |
| Veto LLD | 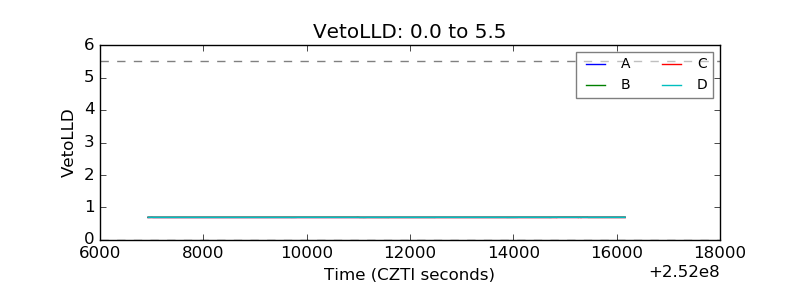 |
| Alpha Counter | 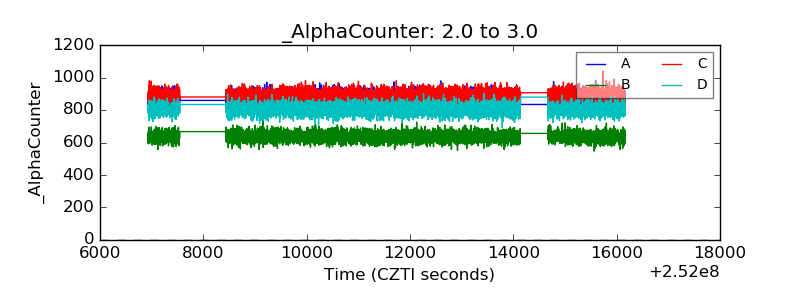 |
| _CPM_Rate | 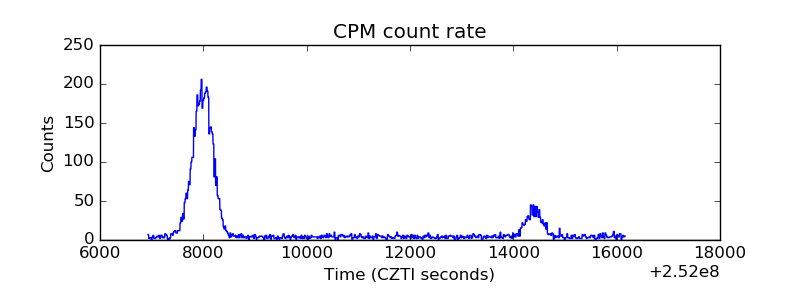 |
| CZT Counter | 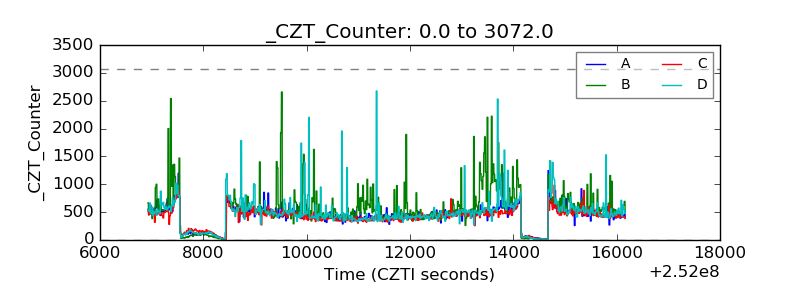 |
| +2.5 Volts monitor |  |
| +5 Volts monitor |  |
| _ROLL_ROT | 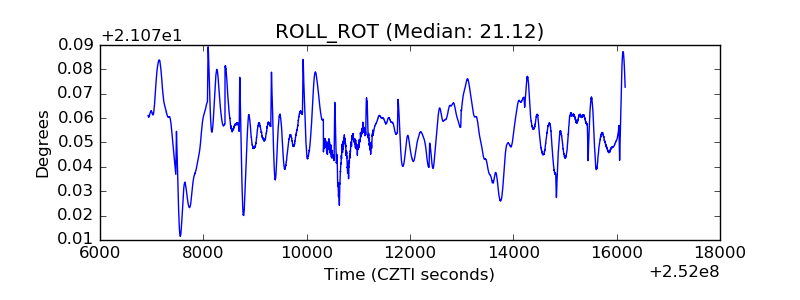 |
| _Roll_DEC | 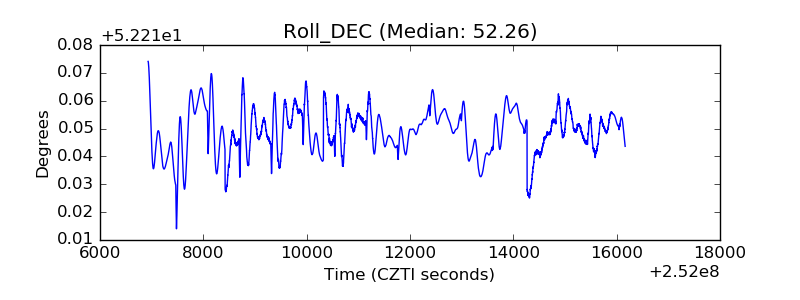 |
| _Roll_RA | 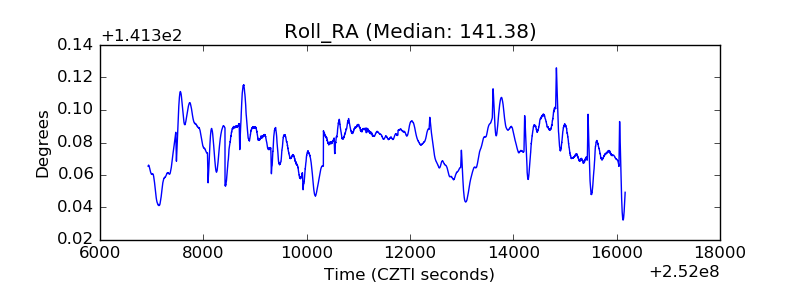 |
| Veto Counter | 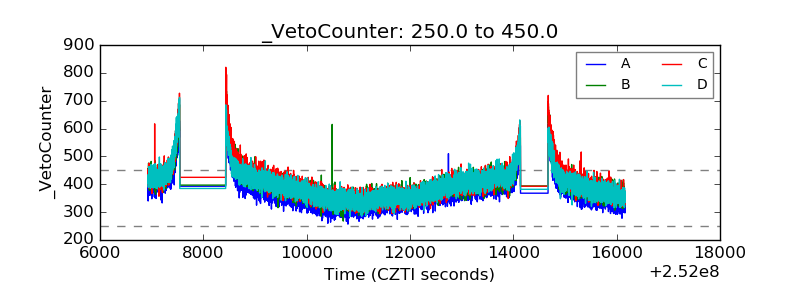 |