| Param | Original file | Final file |
|---|---|---|
| Filename | modeM0/AS1G08_065T01_9000001796_12148cztM0_level2.evt | modeM0/AS1G08_065T01_9000001796_12148cztM0_level2_quad_clean.evt |
| Size (bytes) | 681,096,960 | 112,348,800 |
| Size | 649.5 MB | 107.1 MB |
| Events in quadrant A | 4,239,560 | 732,559 |
| Events in quadrant B | 5,806,119 | 718,620 |
| Events in quadrant C | 3,769,382 | 722,291 |
| Events in quadrant D | 6,265,247 | 667,409 |
| Mode M0 | |||
|---|---|---|---|
| Quadrant | BADHDUFLAG | Total packets | Discarded packets |
| A | 0 | 18276 | 3 |
| B | 0 | 22839 | 2 |
| C | 0 | 16908 | 2 |
| D | 0 | 24384 | 2 |
| Mode M9 | |||
|---|---|---|---|
| Quadrant | BADHDUFLAG | Total packets | Discarded packets |
| A | 0 | 6 | 0 |
| B | 0 | 6 | 0 |
| C | 0 | 6 | 0 |
| D | 0 | 6 | 0 |
| Mode SS | |||
|---|---|---|---|
| Quadrant | BADHDUFLAG | Total packets | Discarded packets |
| A | 0 | 166 | 0 |
| B | 0 | 166 | 0 |
| C | 0 | 166 | 0 |
| D | 0 | 166 | 0 |
| Quadrant | Total seconds | Saturated seconds | Saturation percentage |
|---|---|---|---|
| A | 8072 | 175 | 2.167988% |
| B | 8072 | 645 | 7.990585% |
| C | 8072 | 69 | 0.854807% |
| D | 8072 | 686 | 8.498513% |
Noise dominated data is calculated using 1-second bins in cleaned event files. If a bin has >2000 counts, and if more than 50% of those come from <1% of pixels, then it is considered to be noise-dominated and hence unusable.
| Quadrant | # 1 sec bins | Bins with >0 counts | Bins with >2000 counts | High rate bins dominated by noise | Noise dominated (total time) | Noise dominated (detector-on time) | Marked lightcurve |
|---|---|---|---|---|---|---|---|
| A | 8663 | 8075 | 37 | 37 | 0.43% | 0.46% | 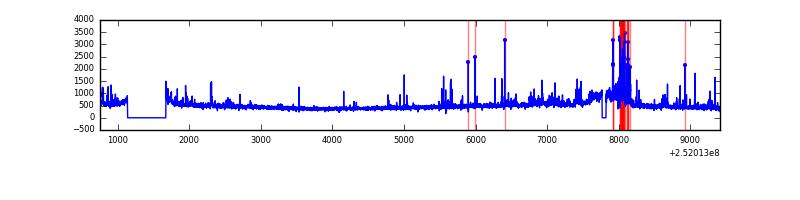 |
| B | 8663 | 8075 | 277 | 277 | 3.20% | 3.43% | 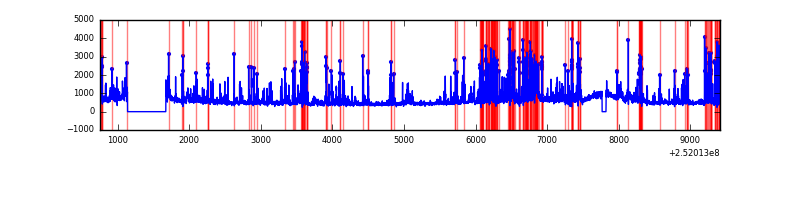 |
| C | 8663 | 8075 | 2 | 2 | 0.02% | 0.02% | 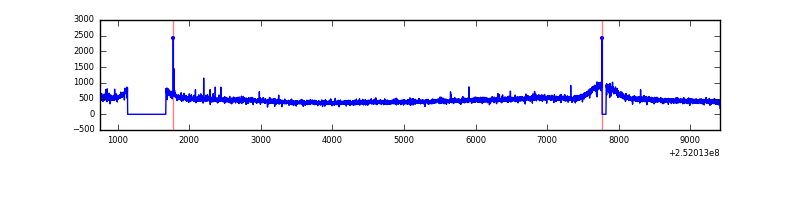 |
| D | 8663 | 8075 | 441 | 441 | 5.09% | 5.46% | 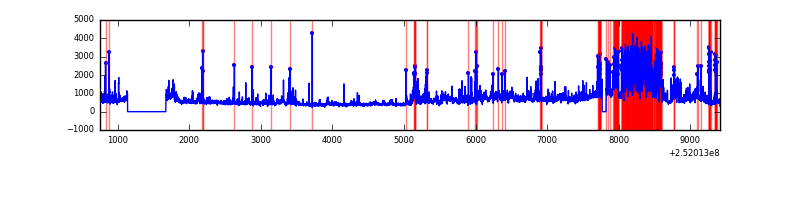 |
Top three noisy pixels from each quadrant. If the there are fewer than three noisy pixels in the level2.evt file, extra rows are filled as -1
| Pixel properties | Quadrant properties | ||||||
|---|---|---|---|---|---|---|---|
| Quadrant | DetID | PixID | Counts | Sigma | Mean | Median | Sigma |
| A | 13 | 248 | 169696 | 845.58 | 981 | 958 | 199.6 |
| A | 1 | 162 | 85003 | 421.17 | 981 | 958 | 199.6 |
| A | 8 | 15 | 67682 | 334.37 | 981 | 958 | 199.6 |
| B | 4 | 239 | 826233 | 4519.11 | 959 | 935 | 182.6 |
| B | 3 | 64 | 795617 | 4351.46 | 959 | 935 | 182.6 |
| B | 11 | 51 | 125475 | 681.95 | 959 | 935 | 182.6 |
| C | 8 | 128 | 9979 | 40.67 | 957 | 958 | 221.8 |
| C | 13 | 61 | 7255 | 28.39 | 957 | 958 | 221.8 |
| C | 8 | 112 | 6239 | 23.81 | 957 | 958 | 221.8 |
| D | 10 | 157 | 1259543 | 5605.82 | 926 | 895 | 224.5 |
| D | 14 | 34 | 461636 | 2052.07 | 926 | 895 | 224.5 |
| D | 8 | 195 | 439310 | 1952.63 | 926 | 895 | 224.5 |
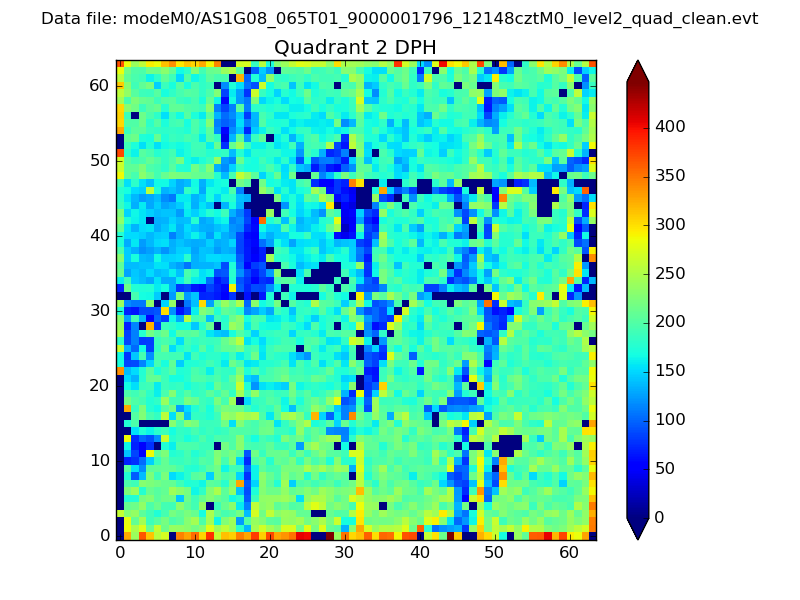
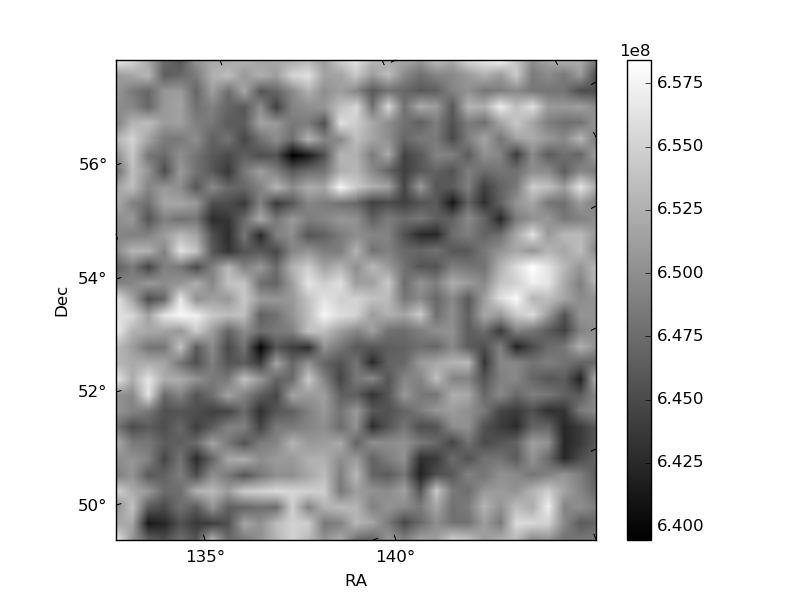
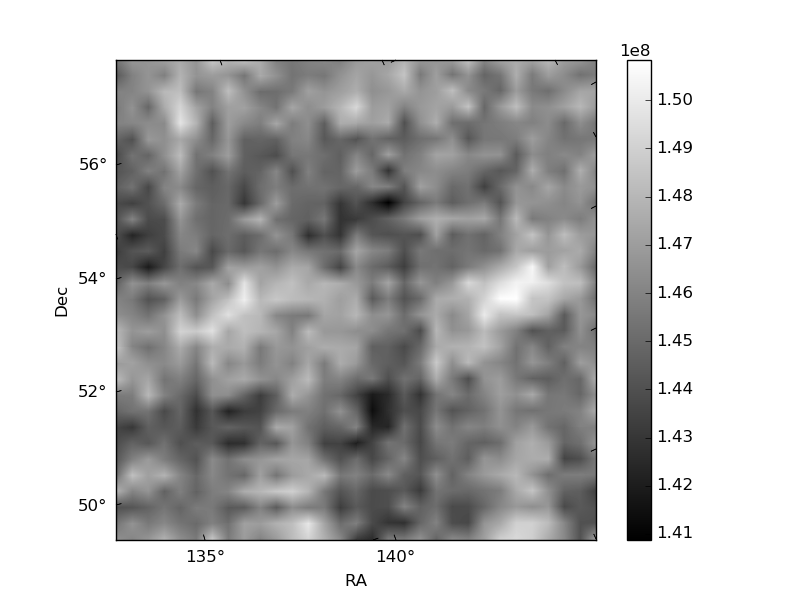
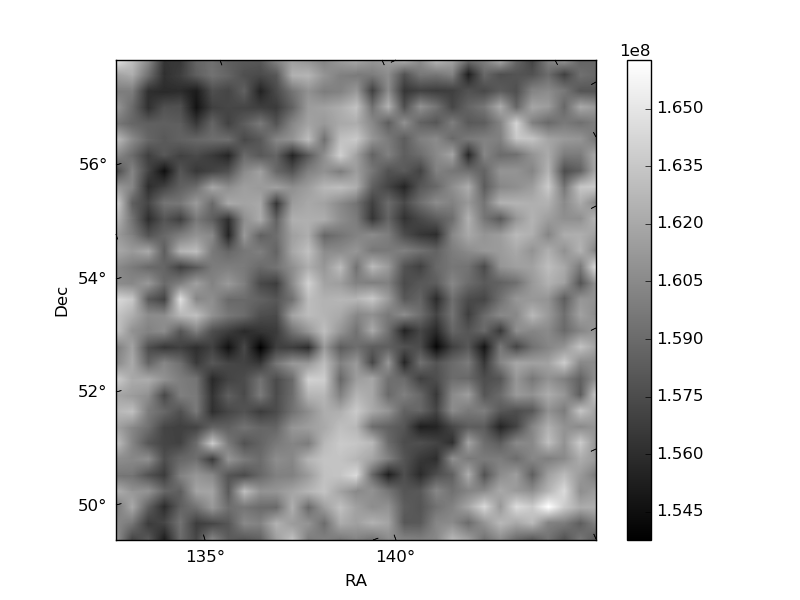
Histogram calculated using DETX and DETY for each event in the final _common_clean file
| Quadrant A | 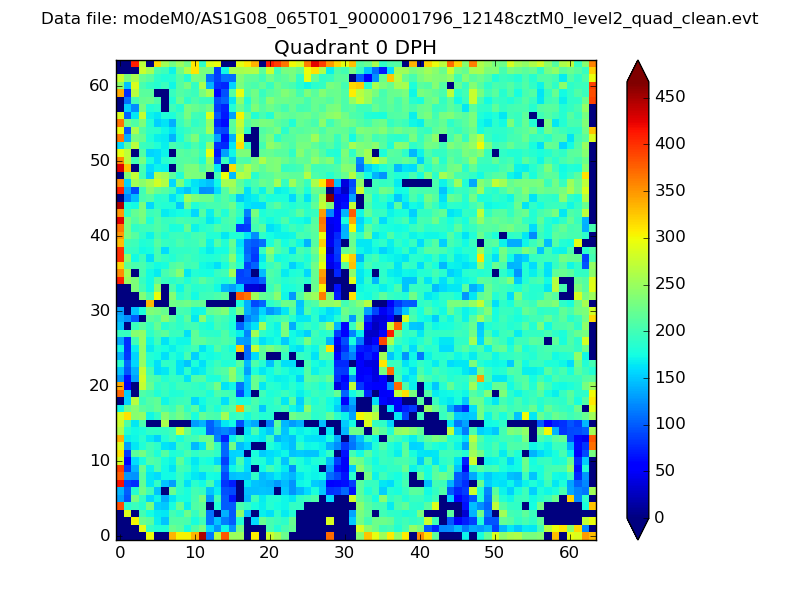 |
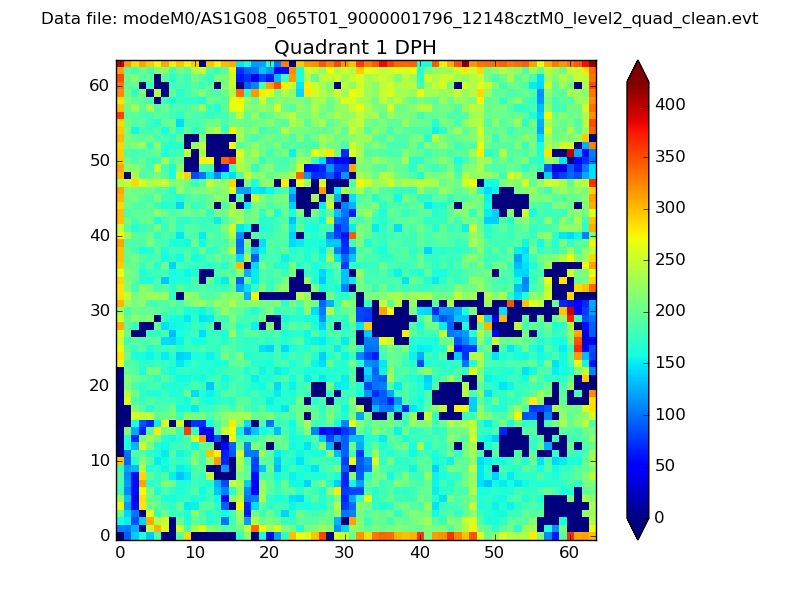 |
Quadrant B |
|---|---|---|---|
| Quadrant D | 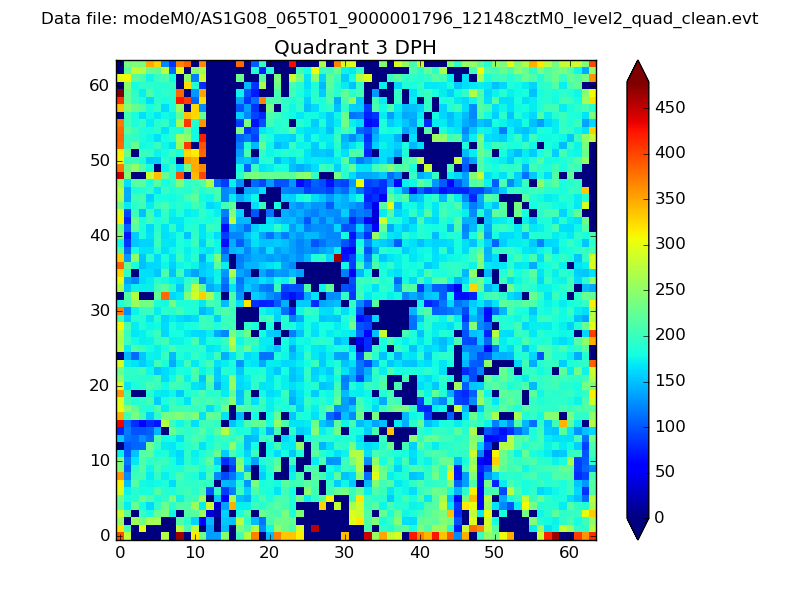 |
 |
Quadrant C |
| Plot type | Count rate plots | Images |
|---|---|---|
| Comparison with Poisson distribution Blue bars denote a histogram of data divided into 1 sec bins. Red curve is a Poisson curve with rate = median count rate of data. |
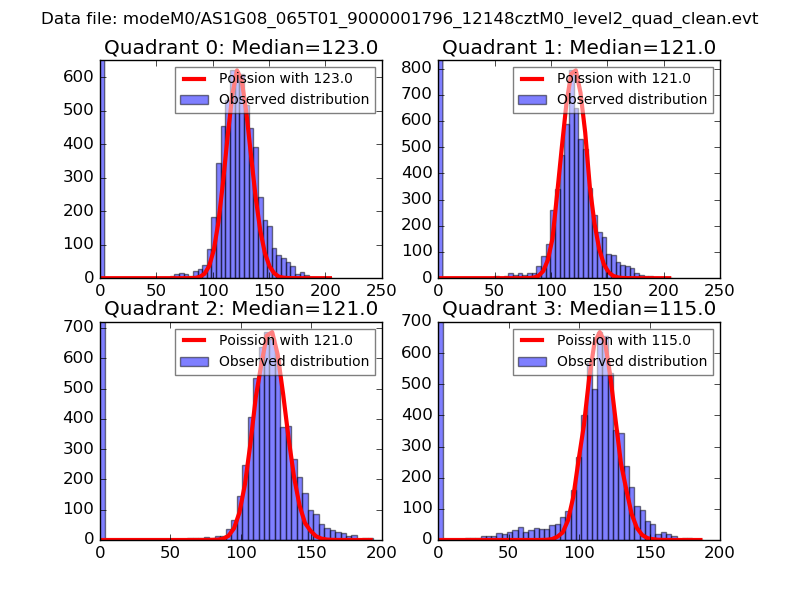 |
 |
| Quadrant-wise count rates Data is divided into 100 sec bins |
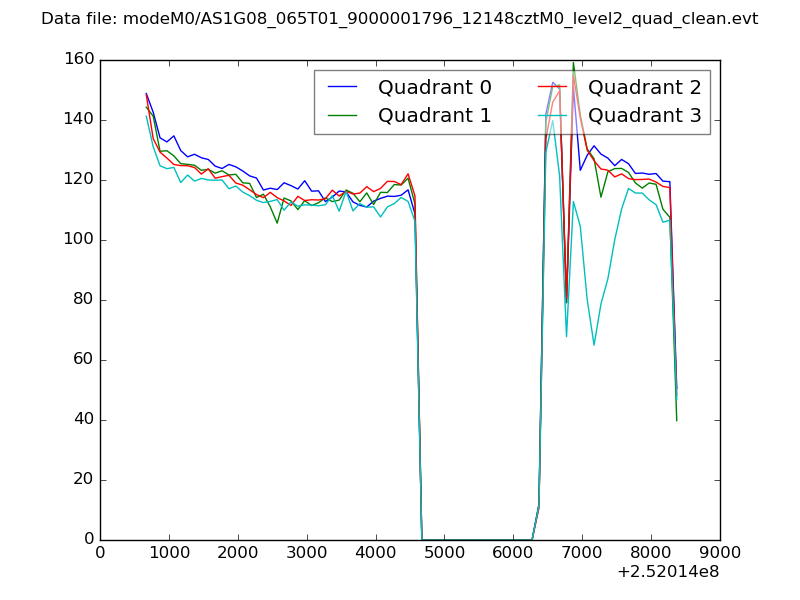 |
|
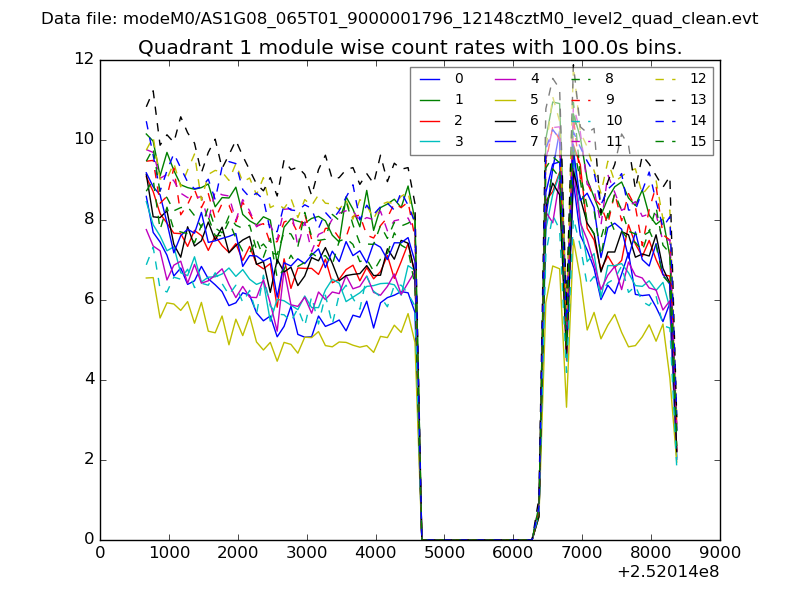
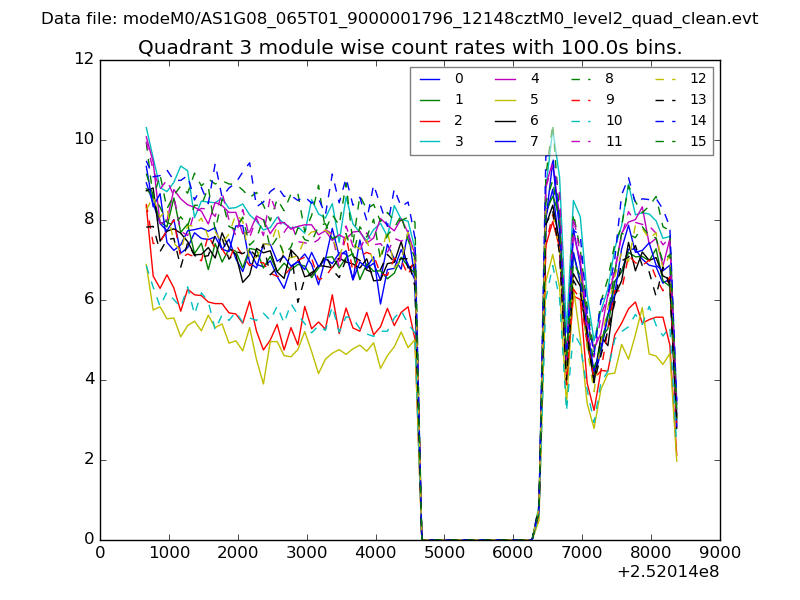
| Module-wise count rates for Quadrant A Data is divided into 100 sec bins |
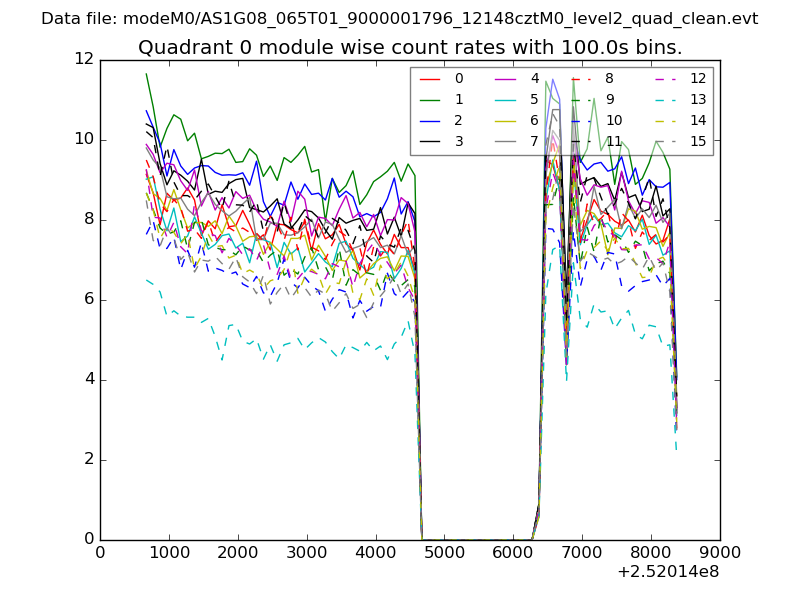 |
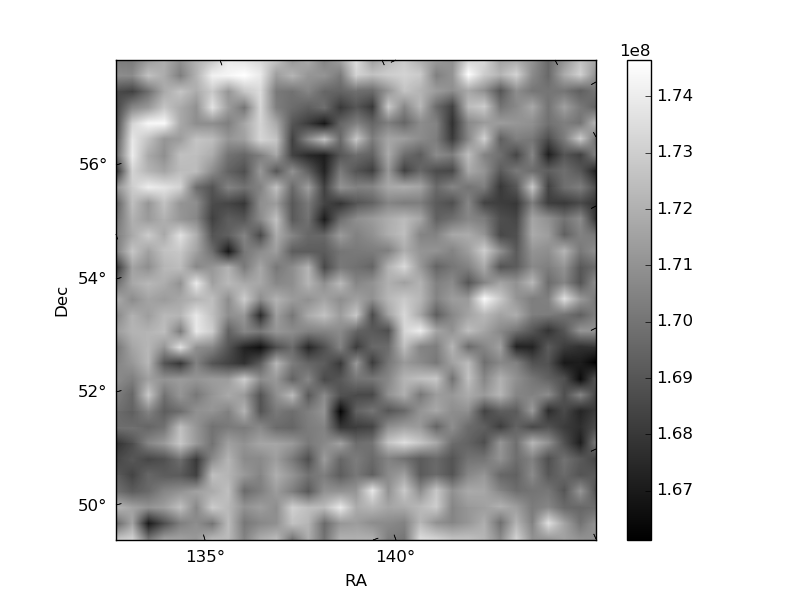 |
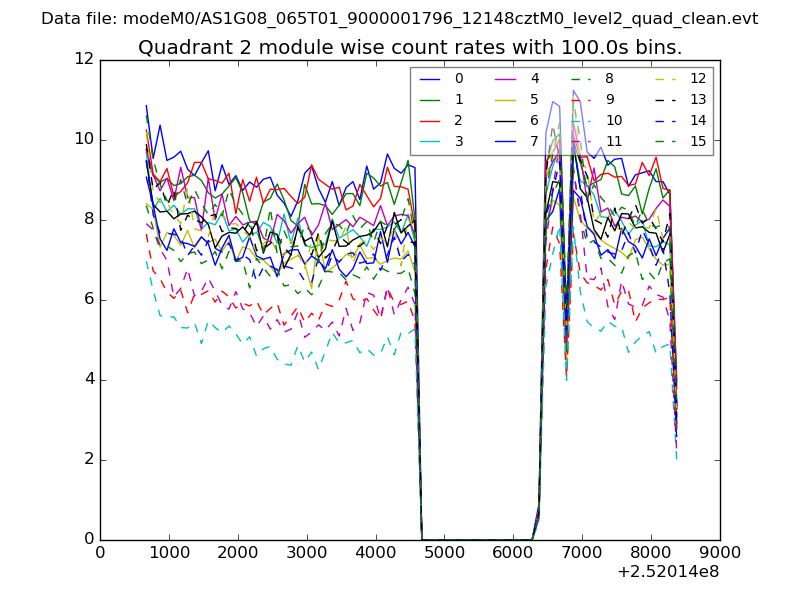
| Module-wise count rates for Quadrant B Data is divided into 100 sec bins |
 |
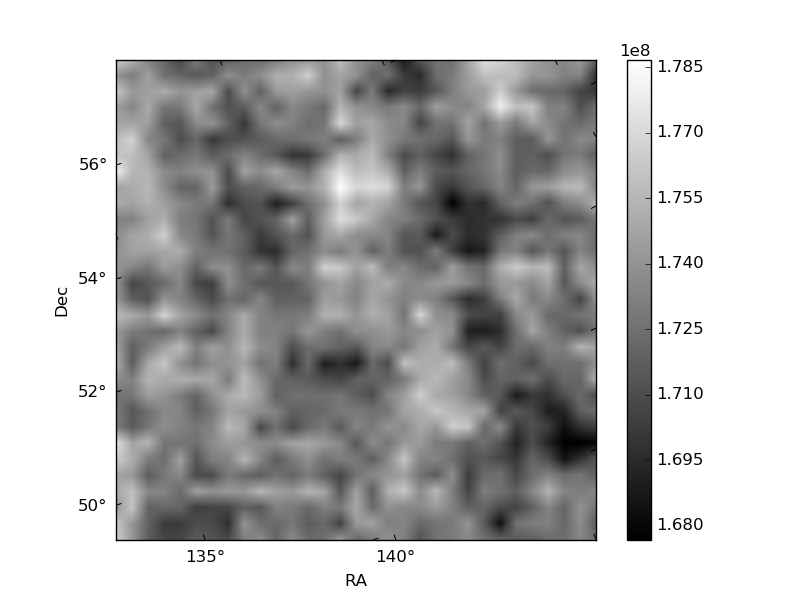 |
| Module-wise count rates for Quadrant C Data is divided into 100 sec bins |
 |
 |
| Module-wise count rates for Quadrant D Data is divided into 100 sec bins |
 |
 |
| Parameter | Plot |
|---|---|
| CZT HV Monitor | 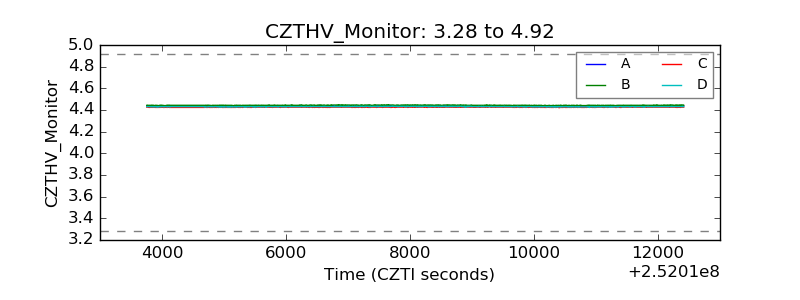 |
| D_VDD | 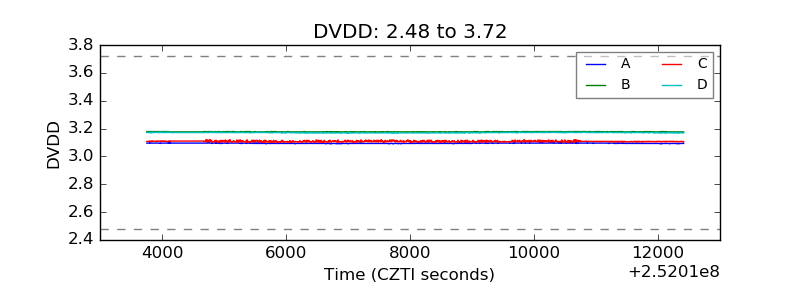 |
| Temperature 1 | 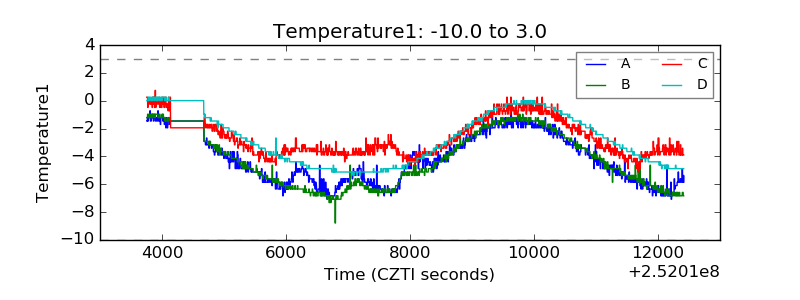 |
| Veto HV Monitor | 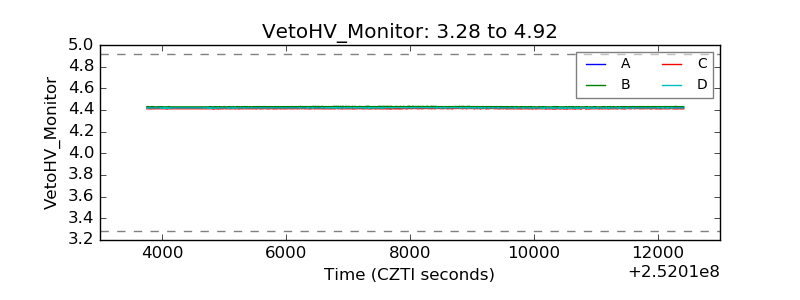 |
| Veto LLD | 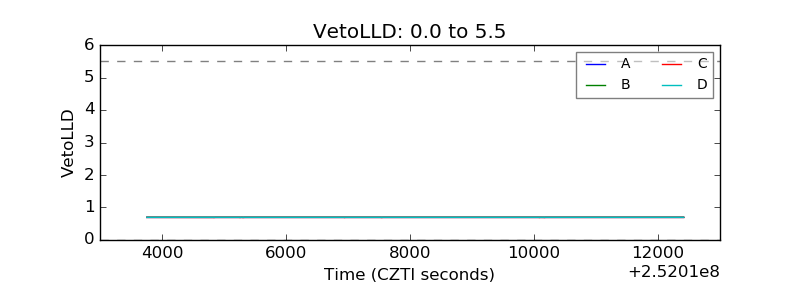 |
| Alpha Counter | 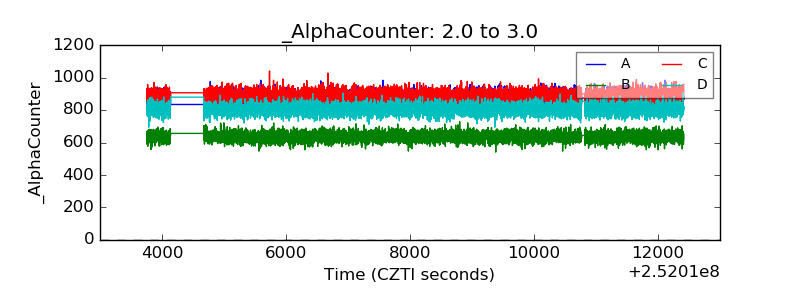 |
| _CPM_Rate | 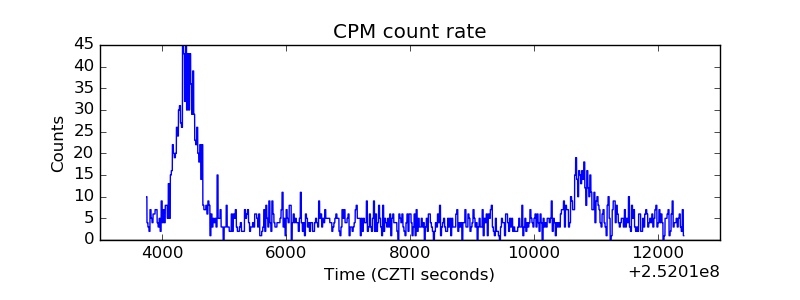 |
| CZT Counter | 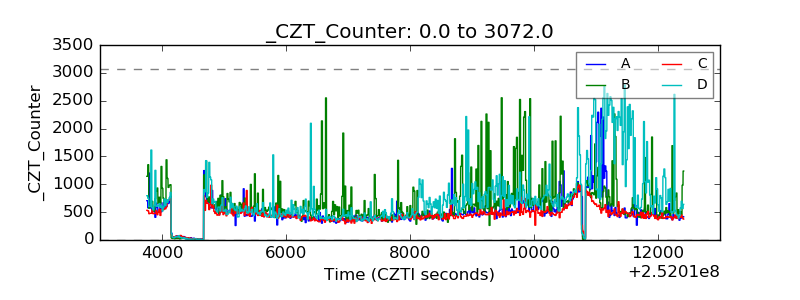 |
| +2.5 Volts monitor |  |
| +5 Volts monitor |  |
| _ROLL_ROT | 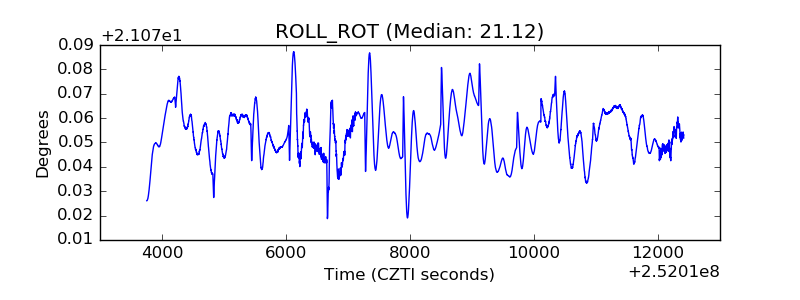 |
| _Roll_DEC | 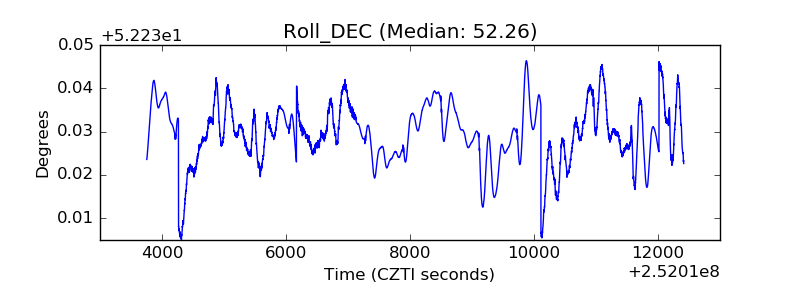 |
| _Roll_RA | 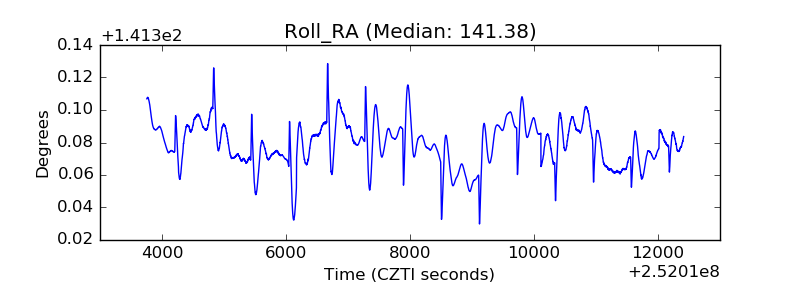 |
| Veto Counter | 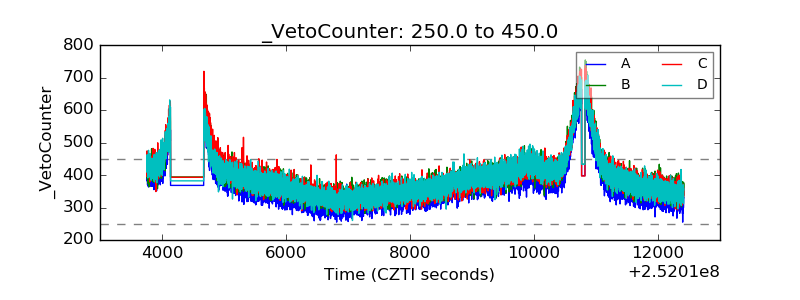 |