| Param | Original file | Final file |
|---|---|---|
| Filename | modeM0/AS1G08_065T01_9000001796_12149cztM0_level2.evt | modeM0/AS1G08_065T01_9000001796_12149cztM0_level2_quad_clean.evt |
| Size (bytes) | 663,995,520 | 116,688,960 |
| Size | 633.2 MB | 111.3 MB |
| Events in quadrant A | 4,207,249 | 764,783 |
| Events in quadrant B | 5,529,700 | 746,471 |
| Events in quadrant C | 3,829,788 | 755,190 |
| Events in quadrant D | 5,988,412 | 699,050 |
| Mode M0 | |||
|---|---|---|---|
| Quadrant | BADHDUFLAG | Total packets | Discarded packets |
| A | 0 | 18210 | 3 |
| B | 0 | 22147 | 2 |
| C | 0 | 17232 | 2 |
| D | 0 | 23668 | 2 |
| Mode M9 | |||
|---|---|---|---|
| Quadrant | BADHDUFLAG | Total packets | Discarded packets |
| A | 0 | 2 | 0 |
| B | 0 | 2 | 0 |
| C | 0 | 2 | 0 |
| D | 0 | 2 | 0 |
| Mode SS | |||
|---|---|---|---|
| Quadrant | BADHDUFLAG | Total packets | Discarded packets |
| A | 0 | 168 | 0 |
| B | 0 | 168 | 0 |
| C | 0 | 168 | 0 |
| D | 0 | 168 | 0 |
| Quadrant | Total seconds | Saturated seconds | Saturation percentage |
|---|---|---|---|
| A | 8171 | 201 | 2.459919% |
| B | 8171 | 653 | 7.991678% |
| C | 8171 | 91 | 1.113695% |
| D | 8171 | 712 | 8.713744% |
Noise dominated data is calculated using 1-second bins in cleaned event files. If a bin has >2000 counts, and if more than 50% of those come from <1% of pixels, then it is considered to be noise-dominated and hence unusable.
| Quadrant | # 1 sec bins | Bins with >0 counts | Bins with >2000 counts | High rate bins dominated by noise | Noise dominated (total time) | Noise dominated (detector-on time) | Marked lightcurve |
|---|---|---|---|---|---|---|---|
| A | 8422 | 8174 | 38 | 38 | 0.45% | 0.46% | 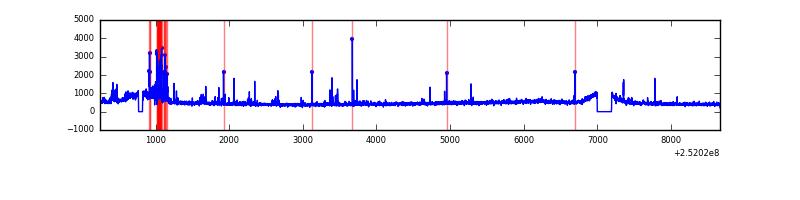 |
| B | 8422 | 8174 | 232 | 232 | 2.75% | 2.84% | 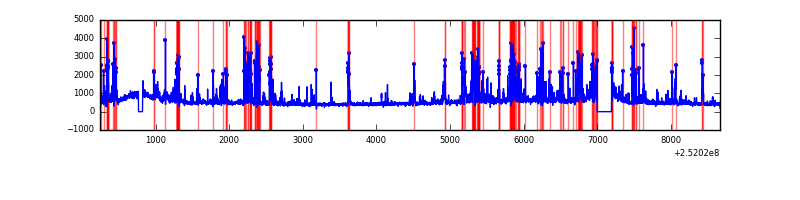 |
| C | 8422 | 8174 | 1 | 1 | 0.01% | 0.01% | 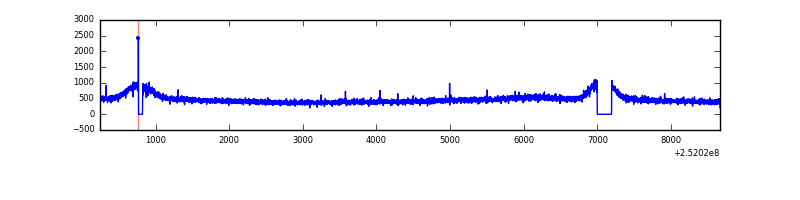 |
| D | 8422 | 8174 | 457 | 457 | 5.43% | 5.59% |  |
Top three noisy pixels from each quadrant. If the there are fewer than three noisy pixels in the level2.evt file, extra rows are filled as -1
| Pixel properties | Quadrant properties | ||||||
|---|---|---|---|---|---|---|---|
| Quadrant | DetID | PixID | Counts | Sigma | Mean | Median | Sigma |
| A | 13 | 248 | 145581 | 699.0 | 998 | 974 | 206.9 |
| A | 8 | 15 | 65068 | 309.82 | 998 | 974 | 206.9 |
| A | 1 | 162 | 61555 | 292.83 | 998 | 974 | 206.9 |
| B | 4 | 239 | 751839 | 3983.58 | 980 | 954 | 188.5 |
| B | 3 | 64 | 655897 | 3474.59 | 980 | 954 | 188.5 |
| B | 11 | 51 | 95397 | 501.04 | 980 | 954 | 188.5 |
| C | 13 | 61 | 7375 | 27.98 | 978 | 981 | 228.6 |
| C | 14 | 234 | 5483 | 19.7 | 978 | 981 | 228.6 |
| C | 8 | 128 | 4238 | 14.25 | 978 | 981 | 228.6 |
| D | 10 | 157 | 1261907 | 5513.89 | 942 | 915 | 228.7 |
| D | 8 | 195 | 440457 | 1921.97 | 942 | 915 | 228.7 |
| D | 1 | 52 | 411811 | 1796.71 | 942 | 915 | 228.7 |
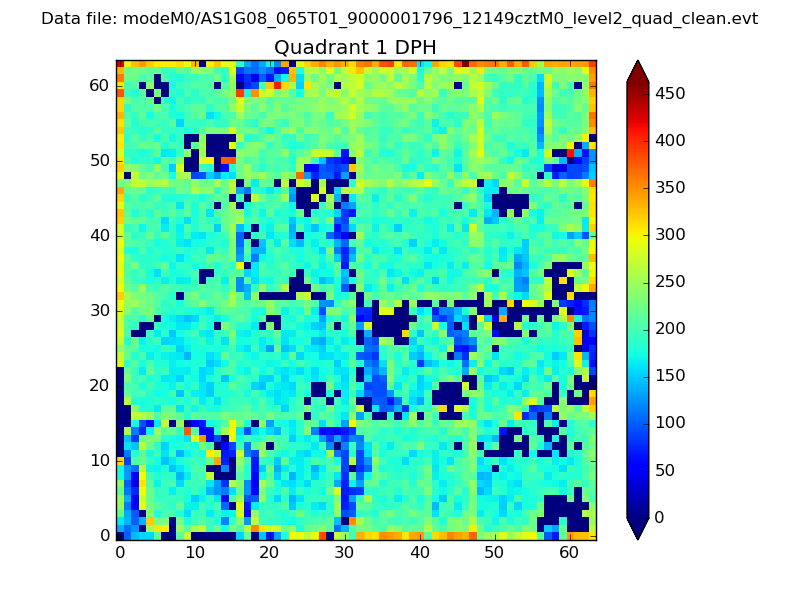
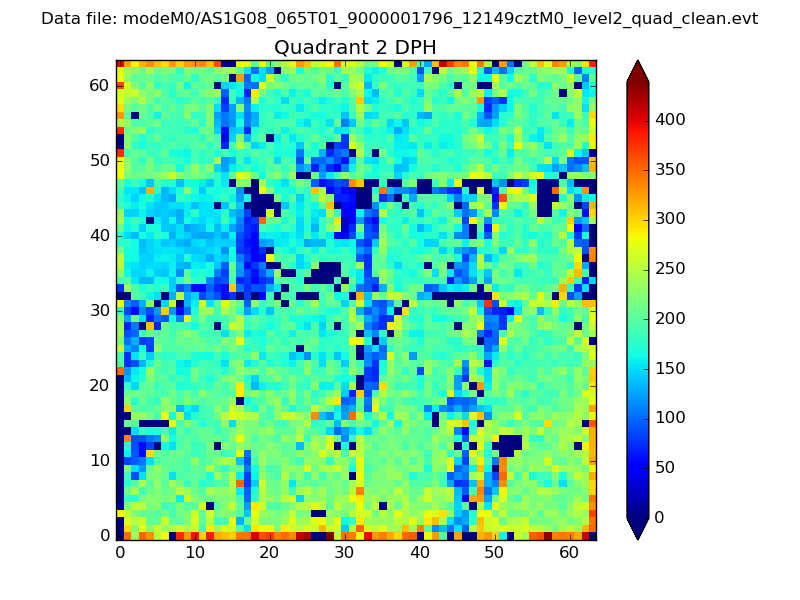
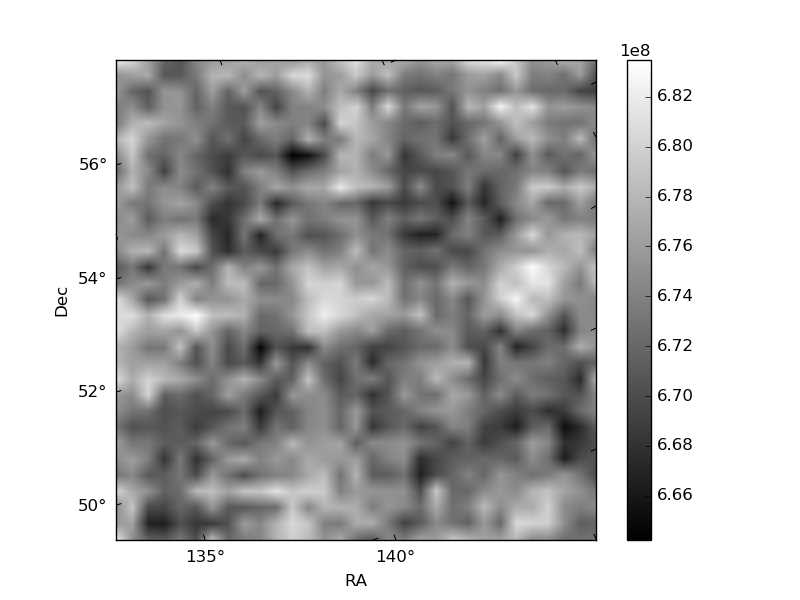
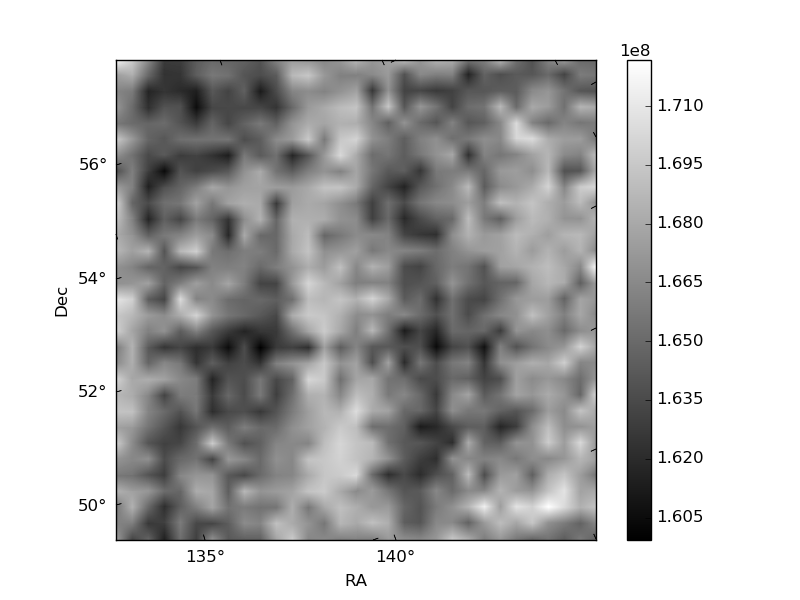
Histogram calculated using DETX and DETY for each event in the final _common_clean file
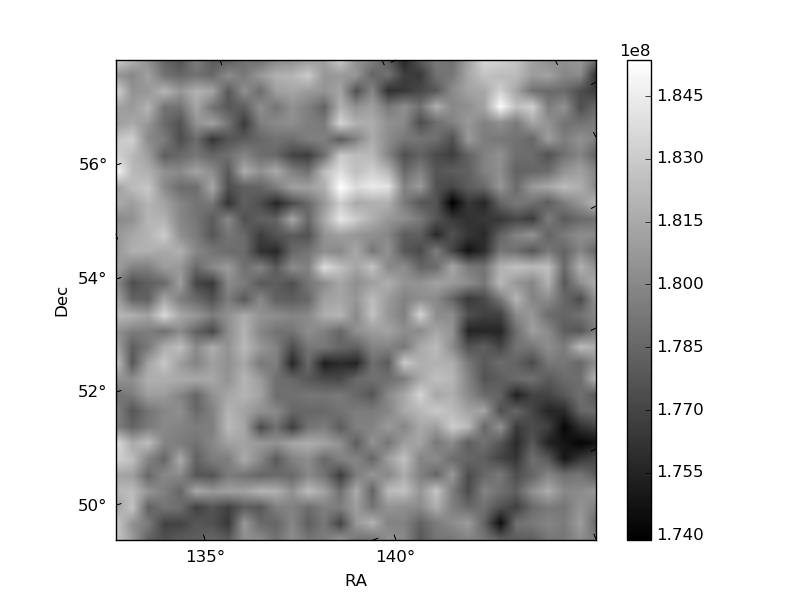
| Quadrant A | 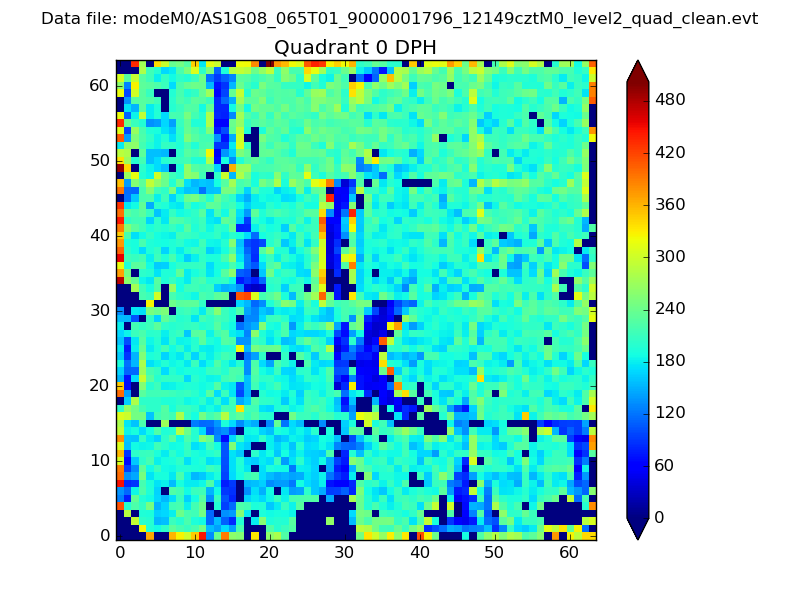 |
 |
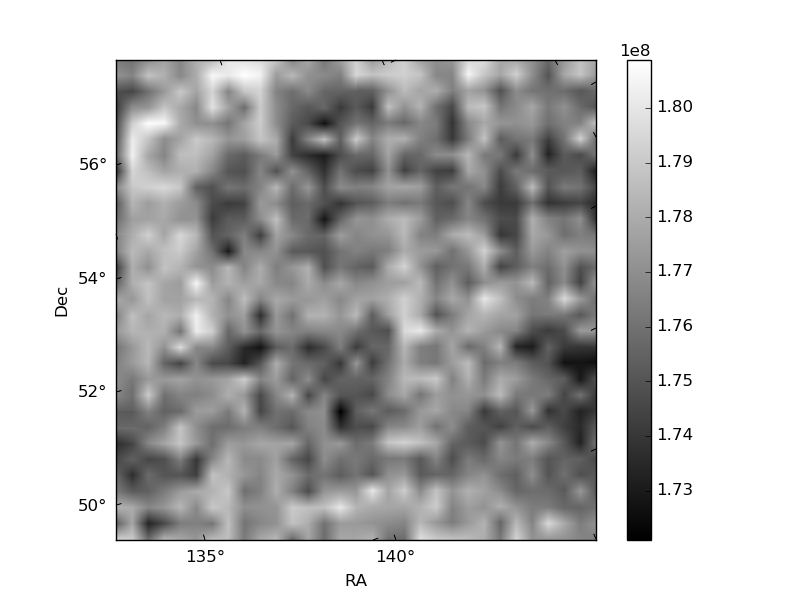
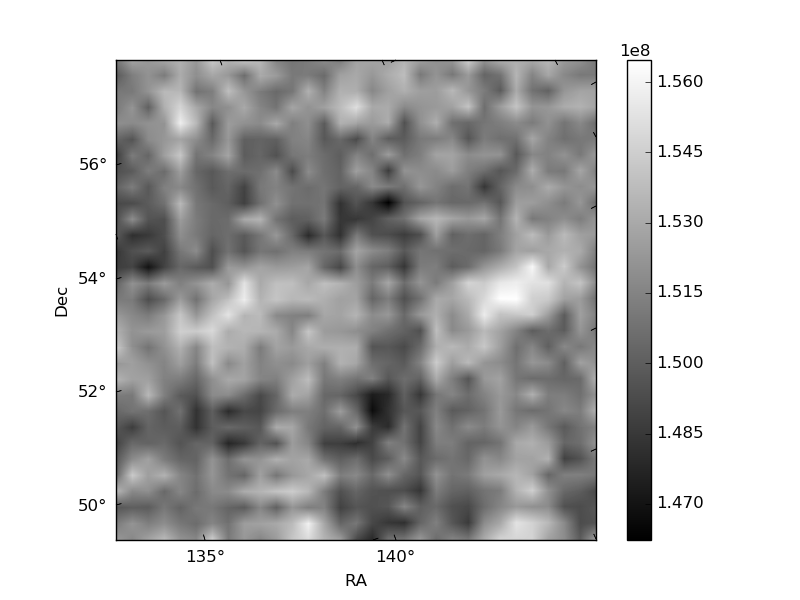
Quadrant B |
|---|---|---|---|
| Quadrant D | 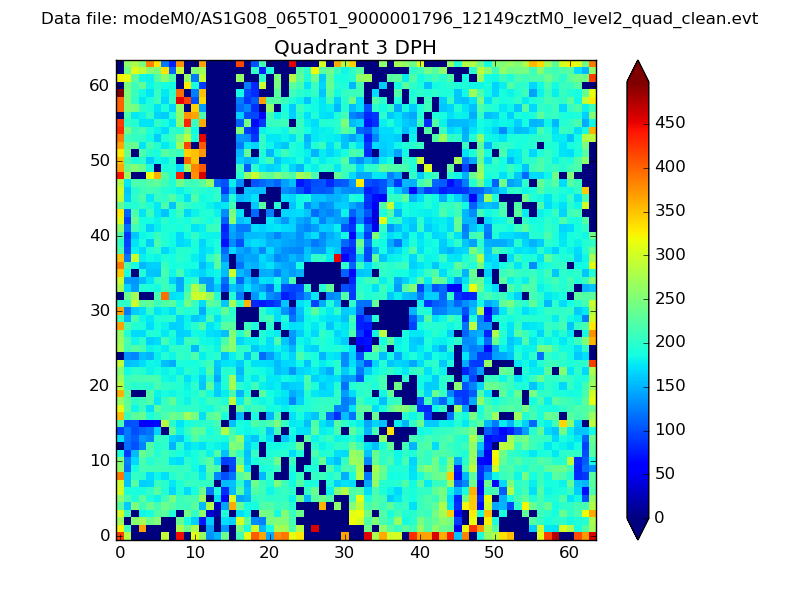 |
 |
Quadrant C |
| Plot type | Count rate plots | Images |
|---|---|---|
| Comparison with Poisson distribution Blue bars denote a histogram of data divided into 1 sec bins. Red curve is a Poisson curve with rate = median count rate of data. |
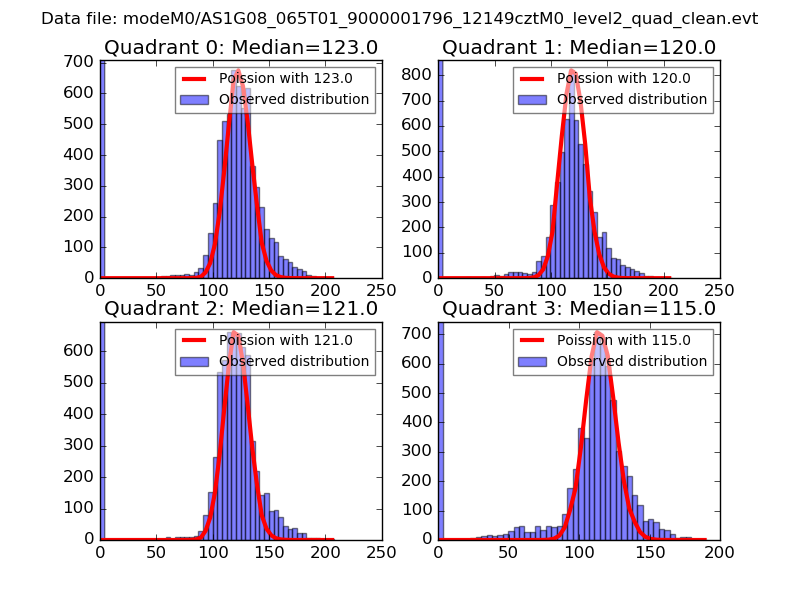 |
 |
| Quadrant-wise count rates Data is divided into 100 sec bins |
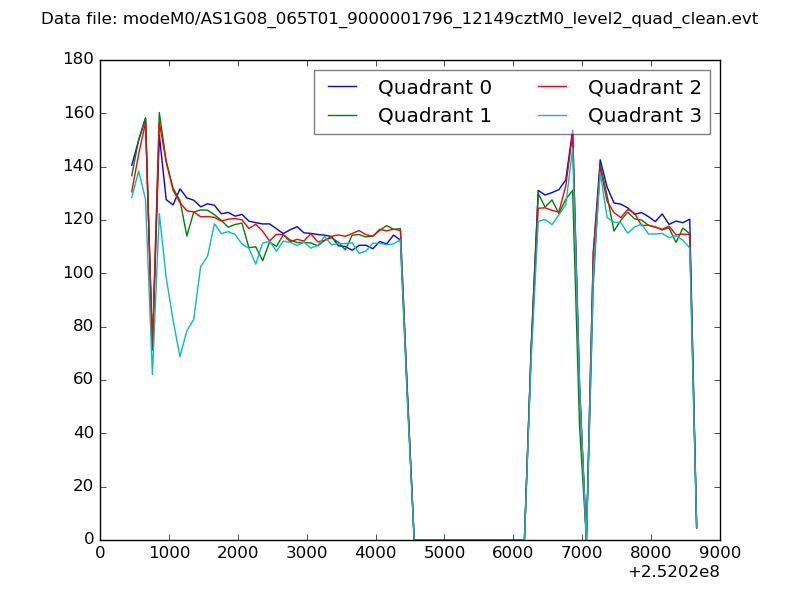 |
|
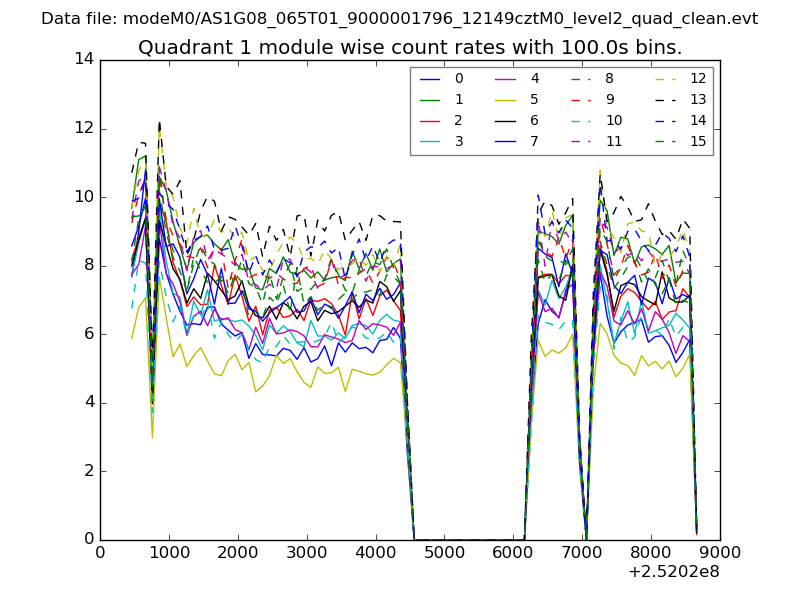
| Module-wise count rates for Quadrant A Data is divided into 100 sec bins |
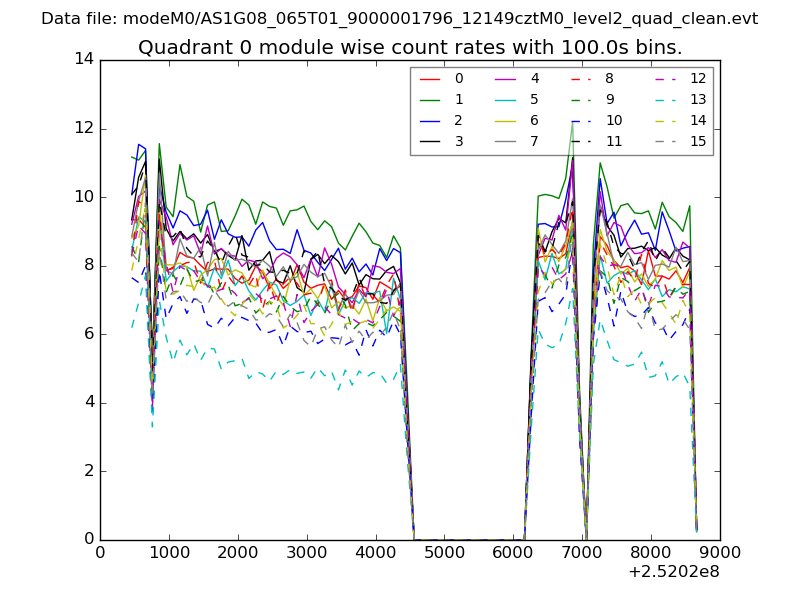 |
 |
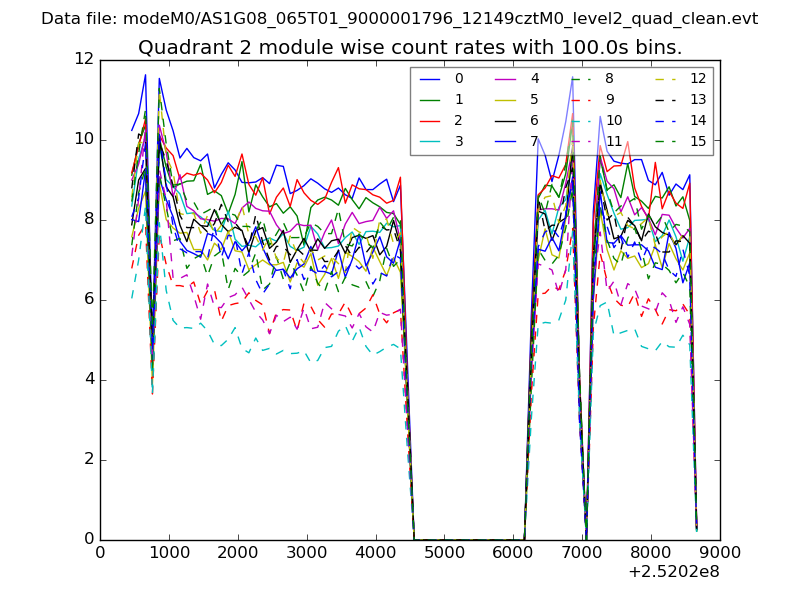
| Module-wise count rates for Quadrant B Data is divided into 100 sec bins |
 |
 |
| Module-wise count rates for Quadrant C Data is divided into 100 sec bins |
 |
 |
| Module-wise count rates for Quadrant D Data is divided into 100 sec bins |
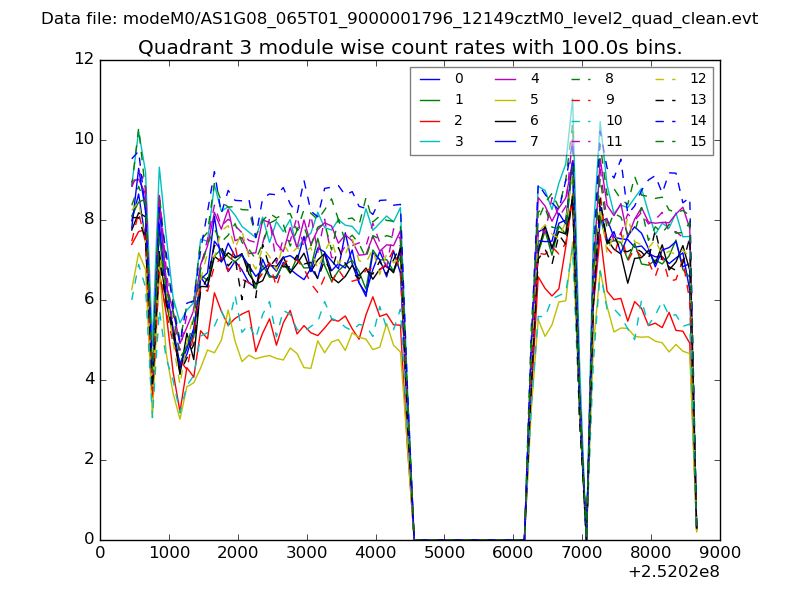 |
 |
| Parameter | Plot |
|---|---|
| CZT HV Monitor | 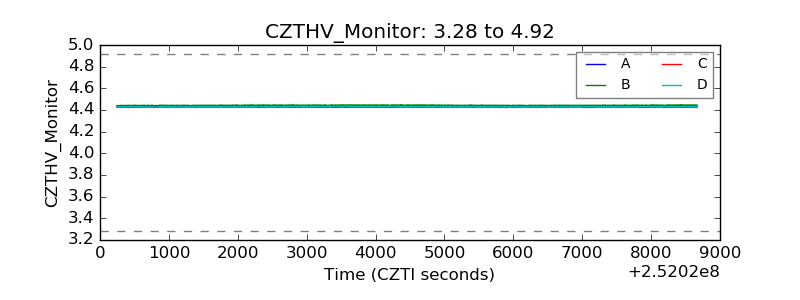 |
| D_VDD | 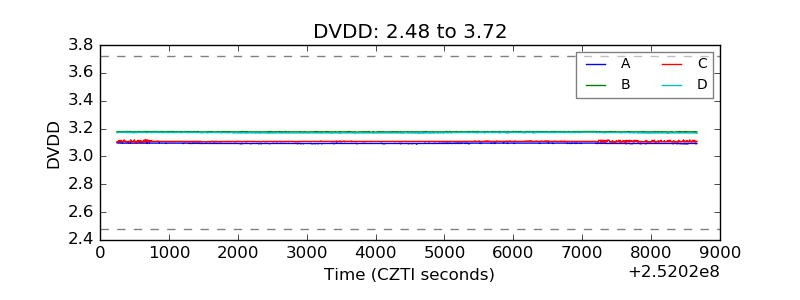 |
| Temperature 1 | 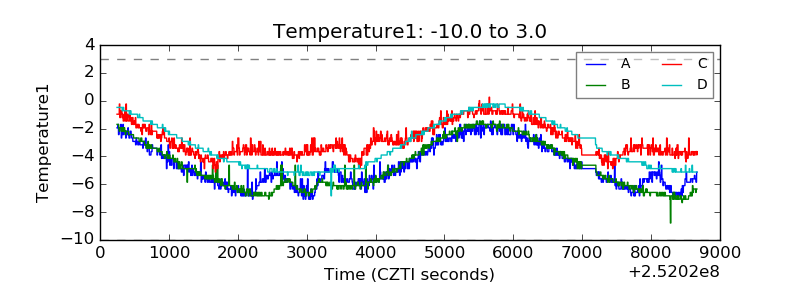 |
| Veto HV Monitor | 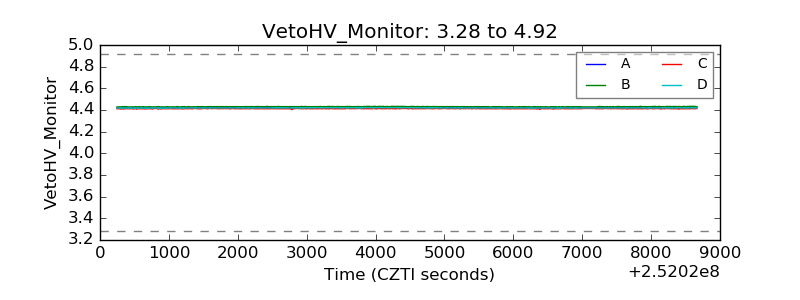 |
| Veto LLD |  |
| Alpha Counter | 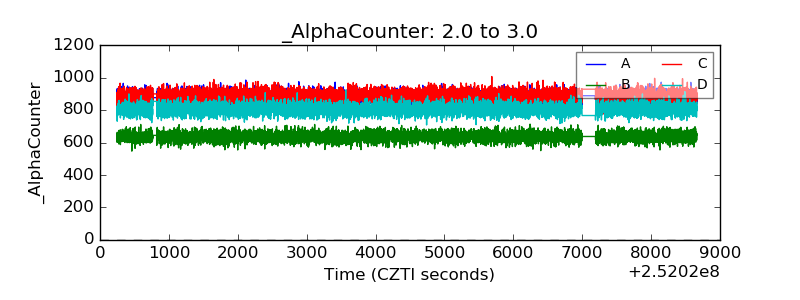 |
| _CPM_Rate | 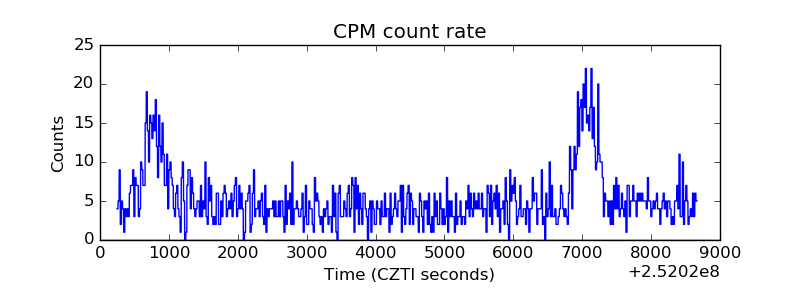 |
| CZT Counter | 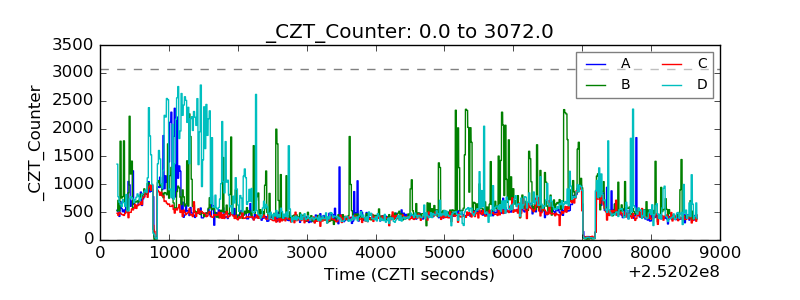 |
| +2.5 Volts monitor |  |
| +5 Volts monitor |  |
| _ROLL_ROT | 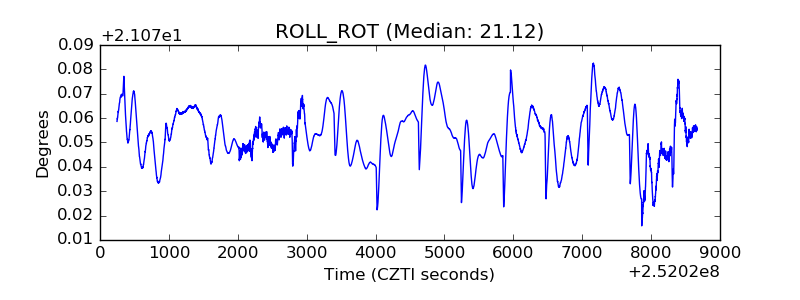 |
| _Roll_DEC |  |
| _Roll_RA | 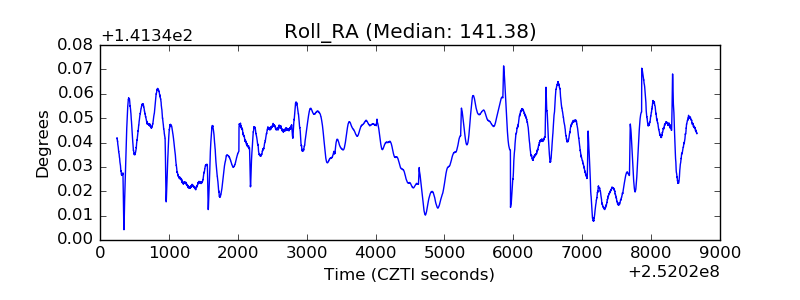 |
| Veto Counter | 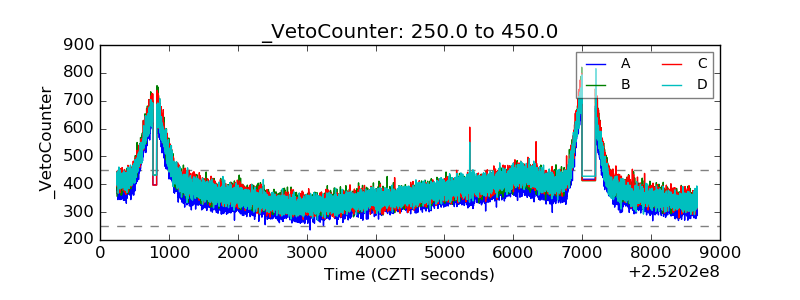 |