| Param | Original file | Final file |
|---|---|---|
| Filename | modeM0/AS1G08_065T01_9000001796_12153cztM0_level2.evt | modeM0/AS1G08_065T01_9000001796_12153cztM0_level2_quad_clean.evt |
| Size (bytes) | 507,458,880 | 93,810,240 |
| Size | 484.0 MB | 89.5 MB |
| Events in quadrant A | 3,197,270 | 608,793 |
| Events in quadrant B | 5,516,964 | 584,224 |
| Events in quadrant C | 2,931,735 | 602,190 |
| Events in quadrant D | 3,272,552 | 583,498 |
| Mode M0 | |||
|---|---|---|---|
| Quadrant | BADHDUFLAG | Total packets | Discarded packets |
| A | 0 | 13787 | 3 |
| B | 0 | 20716 | 2 |
| C | 0 | 13393 | 2 |
| D | 0 | 14363 | 2 |
| Mode M9 | |||
|---|---|---|---|
| Quadrant | BADHDUFLAG | Total packets | Discarded packets |
| A | 0 | 10 | 0 |
| B | 0 | 10 | 0 |
| C | 0 | 10 | 0 |
| D | 0 | 11 | 0 |
| Mode SS | |||
|---|---|---|---|
| Quadrant | BADHDUFLAG | Total packets | Discarded packets |
| A | 0 | 134 | 0 |
| B | 0 | 134 | 0 |
| C | 0 | 134 | 0 |
| D | 0 | 134 | 0 |
| Quadrant | Total seconds | Saturated seconds | Saturation percentage |
|---|---|---|---|
| A | 6629 | 54 | 0.814603% |
| B | 6629 | 654 | 9.865741% |
| C | 6629 | 17 | 0.256449% |
| D | 6629 | 81 | 1.221904% |
Noise dominated data is calculated using 1-second bins in cleaned event files. If a bin has >2000 counts, and if more than 50% of those come from <1% of pixels, then it is considered to be noise-dominated and hence unusable.
| Quadrant | # 1 sec bins | Bins with >0 counts | Bins with >2000 counts | High rate bins dominated by noise | Noise dominated (total time) | Noise dominated (detector-on time) | Marked lightcurve |
|---|---|---|---|---|---|---|---|
| A | 7605 | 6631 | 5 | 5 | 0.07% | 0.08% | 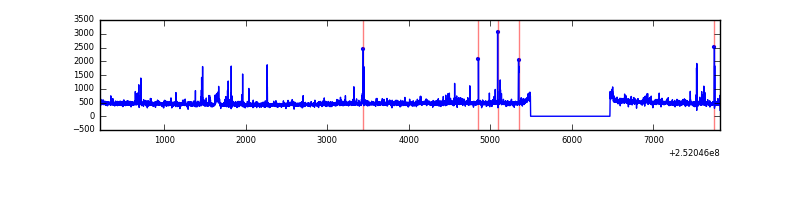 |
| B | 7605 | 6631 | 410 | 410 | 5.39% | 6.18% | 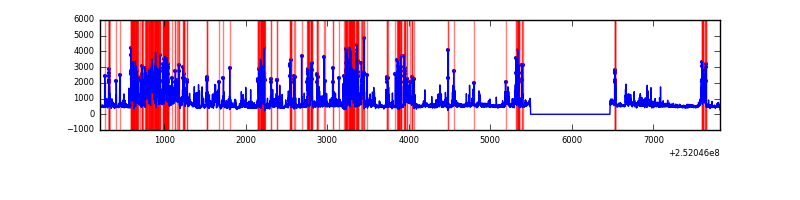 |
| C | 7605 | 6631 | 0 | 0 | 0.00% | 0.00% | 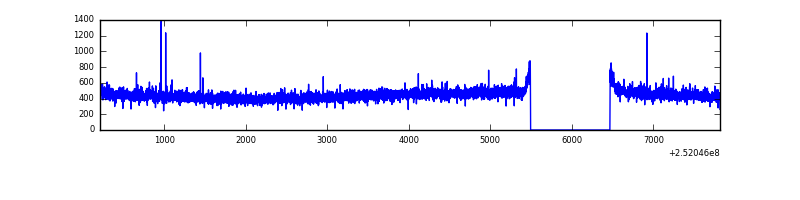 |
| D | 7605 | 6631 | 42 | 42 | 0.55% | 0.63% |  |
Top three noisy pixels from each quadrant. If the there are fewer than three noisy pixels in the level2.evt file, extra rows are filled as -1
| Pixel properties | Quadrant properties | ||||||
|---|---|---|---|---|---|---|---|
| Quadrant | DetID | PixID | Counts | Sigma | Mean | Median | Sigma |
| A | 1 | 162 | 61085 | 380.36 | 781 | 764 | 158.6 |
| A | 5 | 16 | 30368 | 186.67 | 781 | 764 | 158.6 |
| A | 8 | 15 | 25794 | 157.83 | 781 | 764 | 158.6 |
| B | 4 | 239 | 1083293 | 7547.32 | 750 | 731 | 143.4 |
| B | 0 | 85 | 1037874 | 7230.67 | 750 | 731 | 143.4 |
| B | 15 | 204 | 105718 | 731.94 | 750 | 731 | 143.4 |
| C | 15 | 208 | 10432 | 55.59 | 748 | 750 | 174.2 |
| C | 13 | 61 | 5555 | 27.59 | 748 | 750 | 174.2 |
| C | 14 | 234 | 2950 | 12.63 | 748 | 750 | 174.2 |
| D | 1 | 52 | 172348 | 959.52 | 749 | 728 | 178.9 |
| D | 10 | 199 | 71647 | 396.5 | 749 | 728 | 178.9 |
| D | 10 | 50 | 47944 | 263.98 | 749 | 728 | 178.9 |
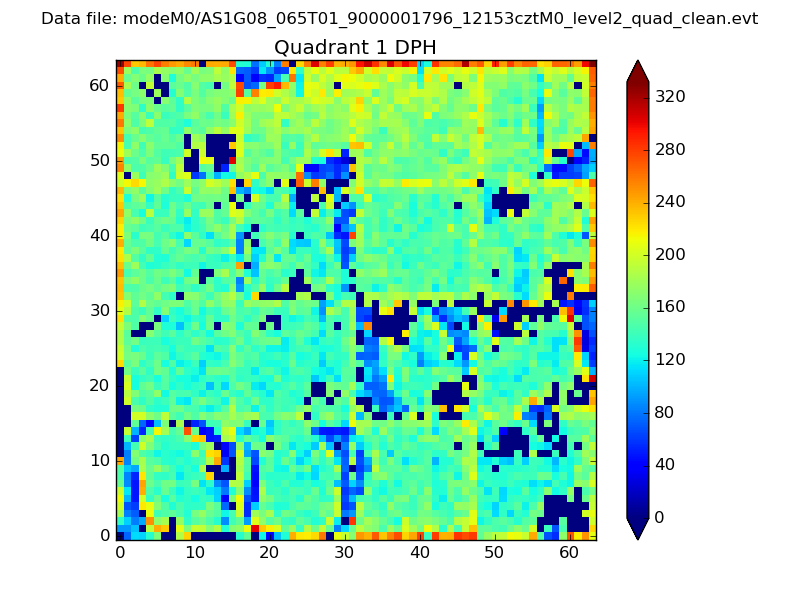
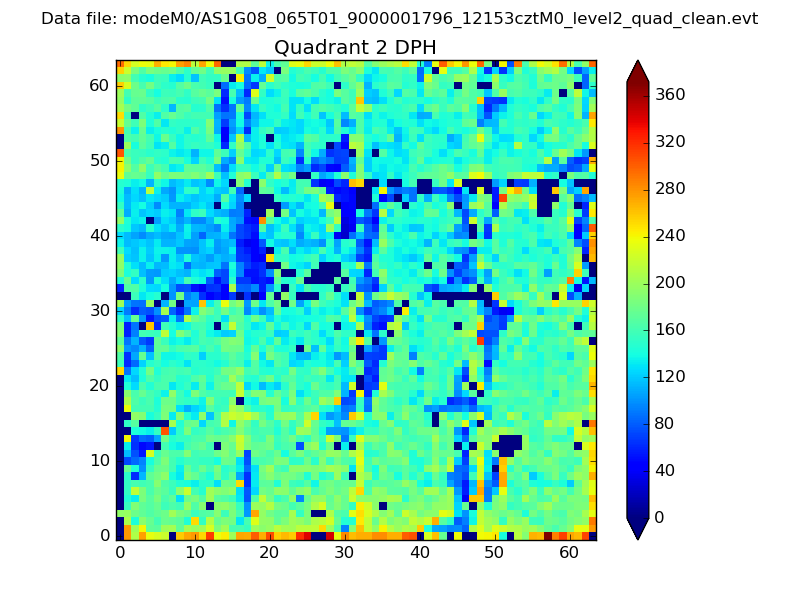
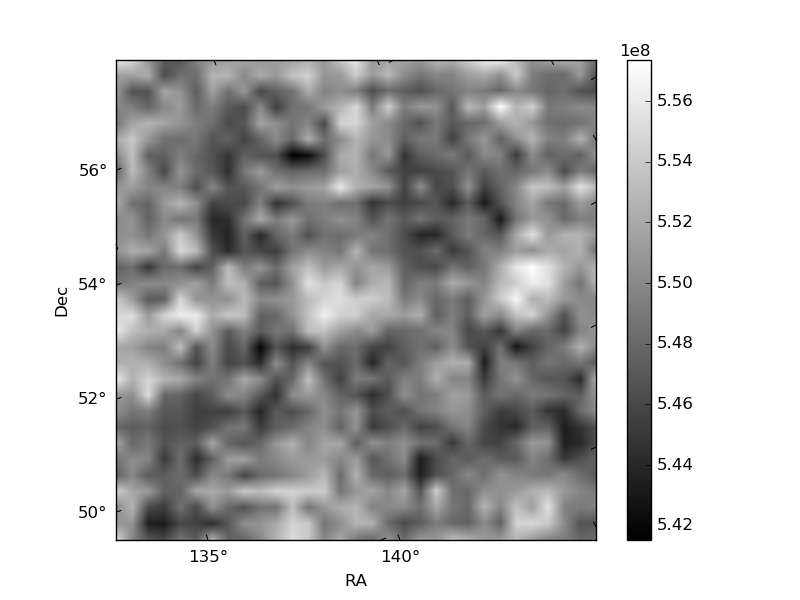
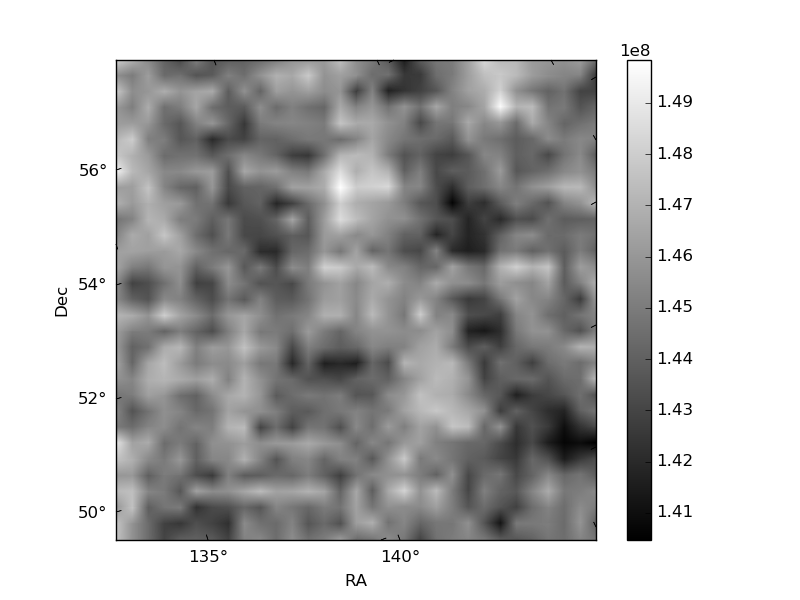
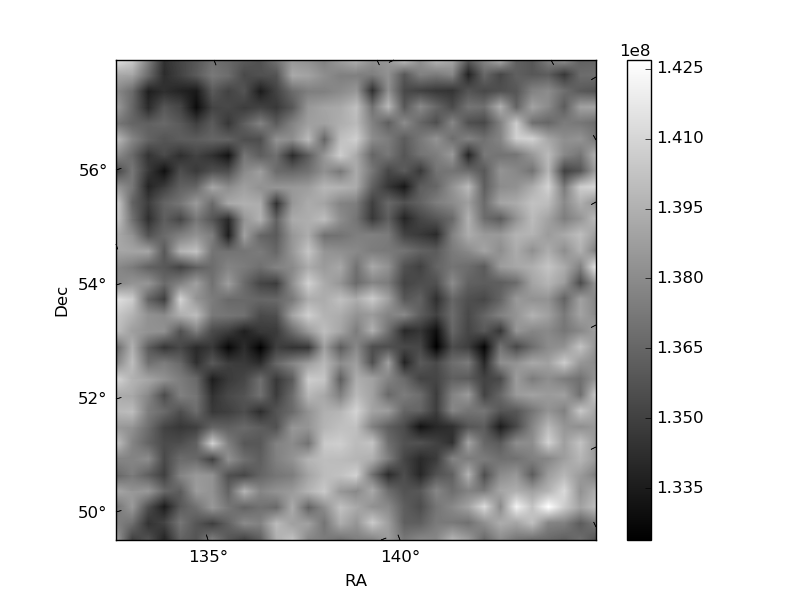
Histogram calculated using DETX and DETY for each event in the final _common_clean file
| Quadrant A | 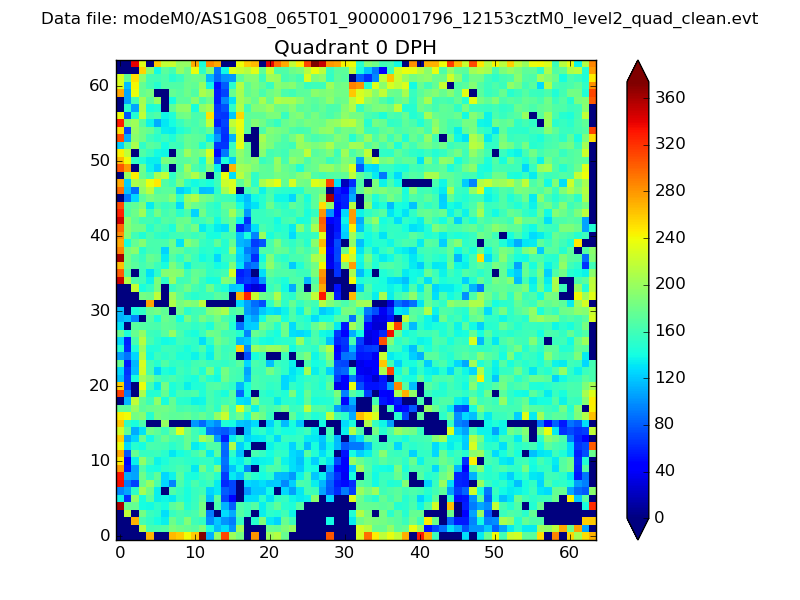 |
 |
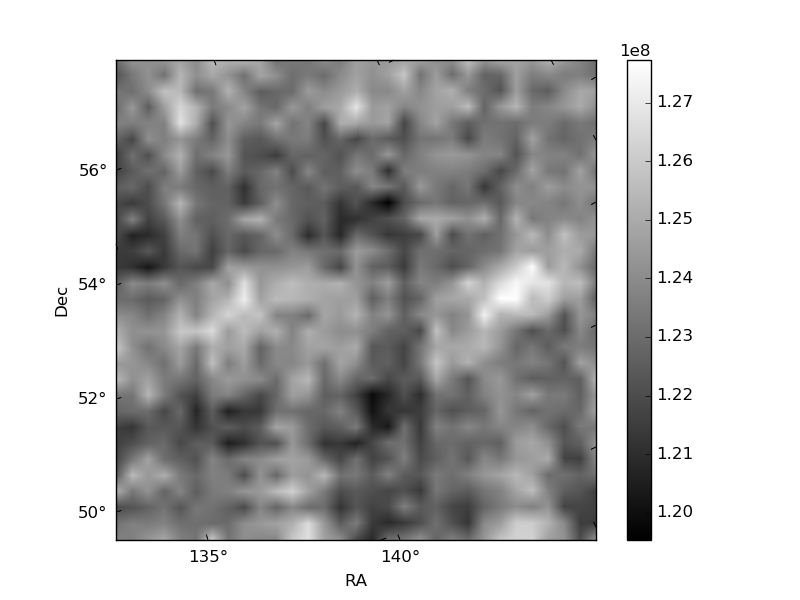
Quadrant B |
|---|---|---|---|
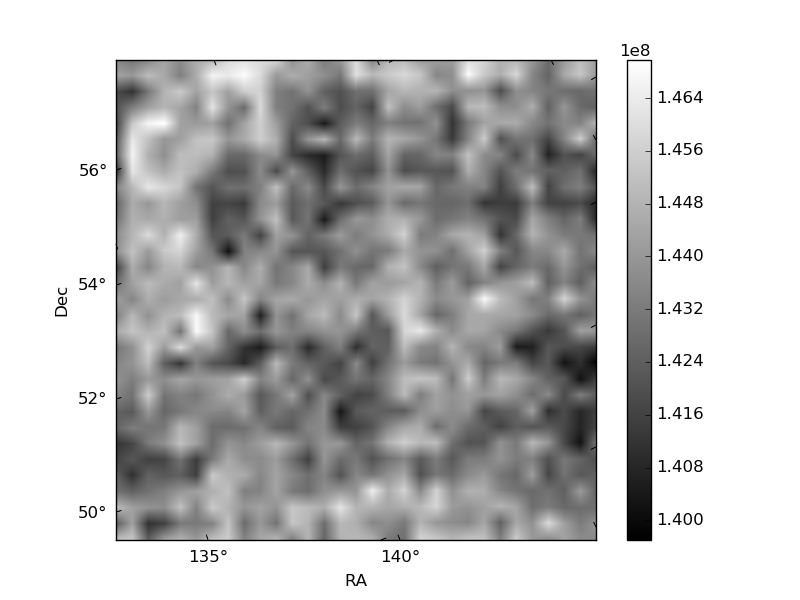
| Quadrant D | 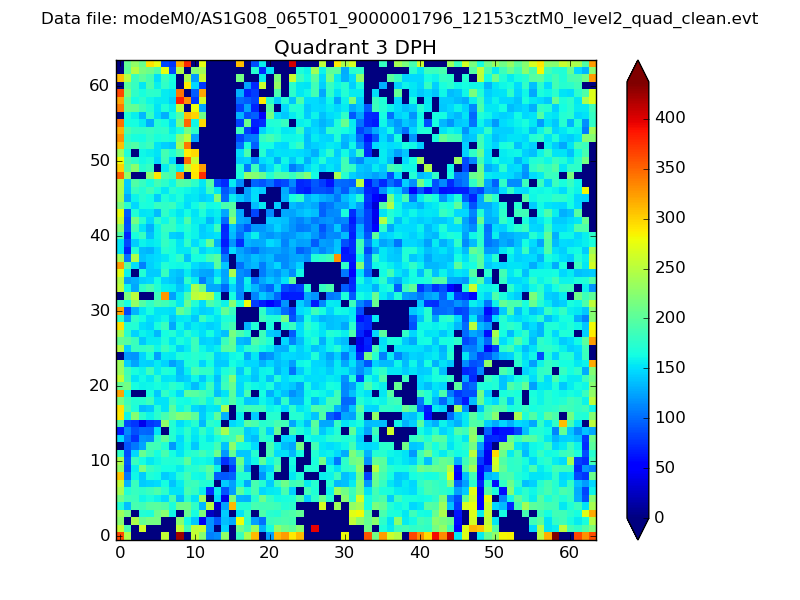 |
 |
Quadrant C |
| Plot type | Count rate plots | Images |
|---|---|---|
| Comparison with Poisson distribution Blue bars denote a histogram of data divided into 1 sec bins. Red curve is a Poisson curve with rate = median count rate of data. |
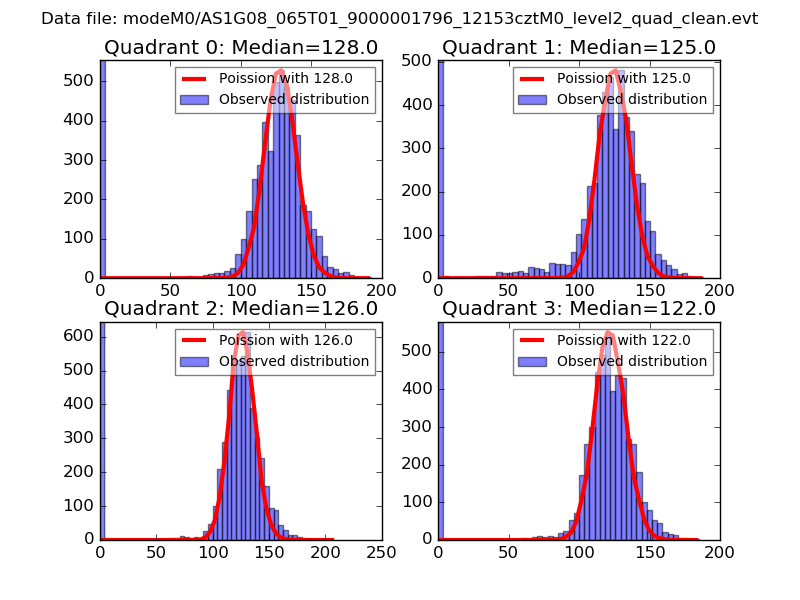 |
 |
| Quadrant-wise count rates Data is divided into 100 sec bins |
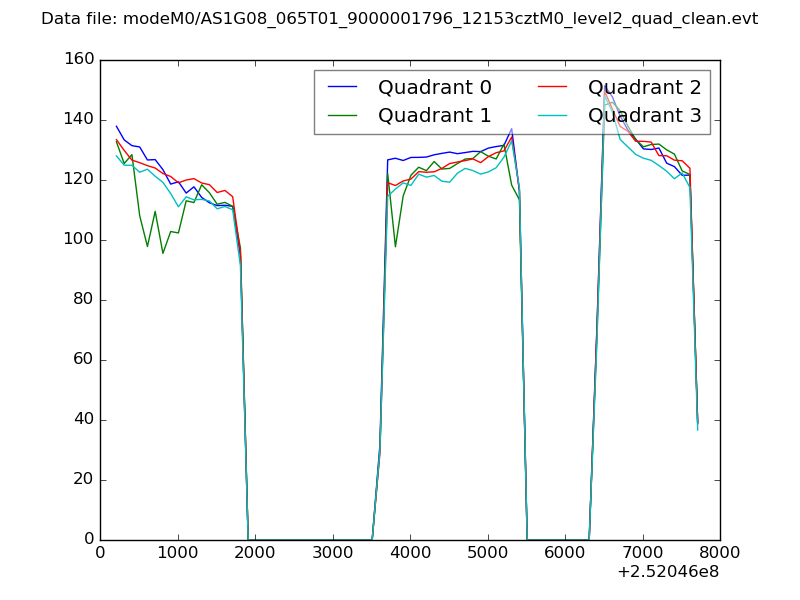 |
|
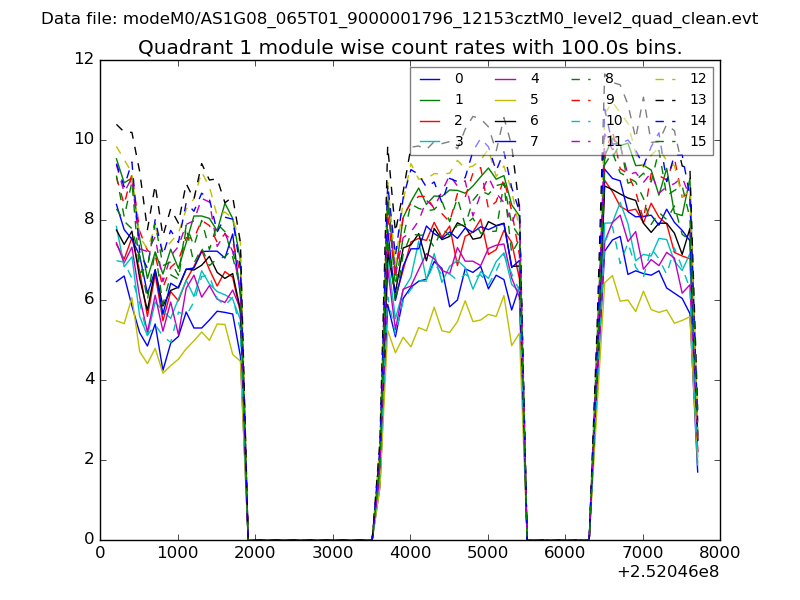
| Module-wise count rates for Quadrant A Data is divided into 100 sec bins |
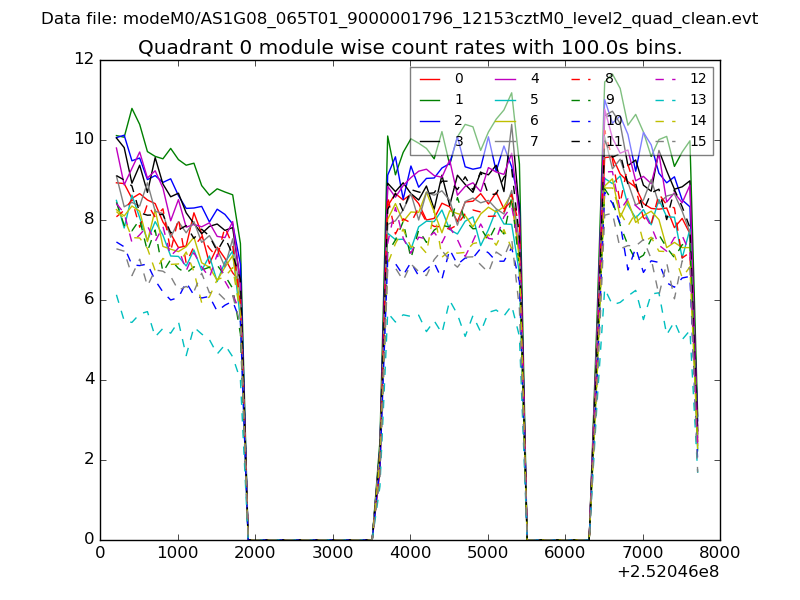 |
 |
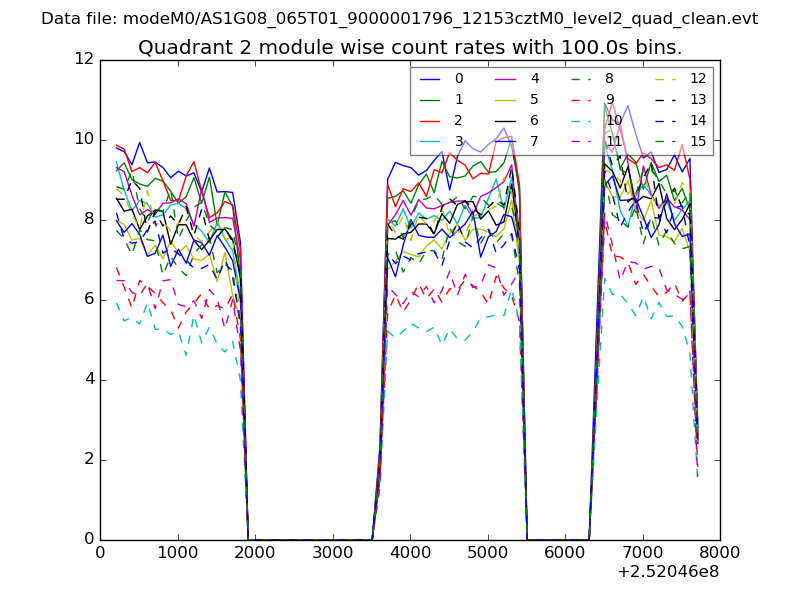
| Module-wise count rates for Quadrant B Data is divided into 100 sec bins |
 |
 |
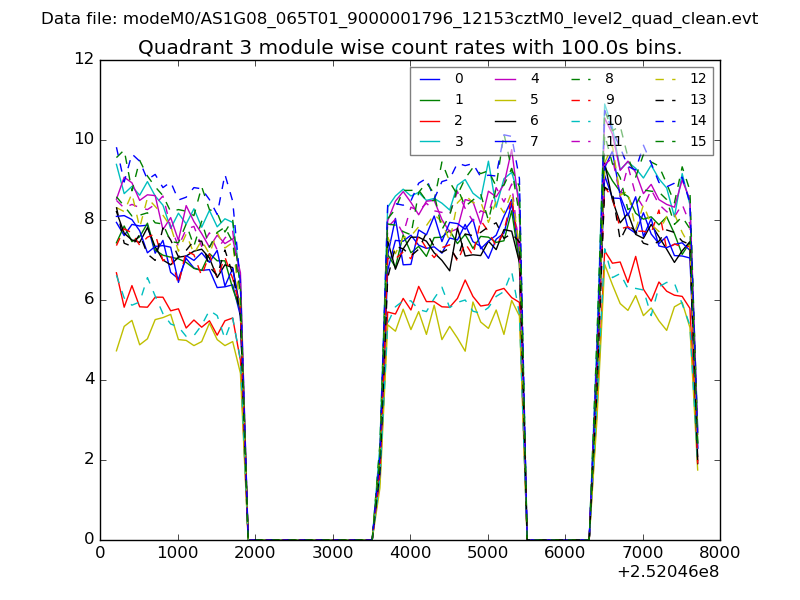
| Module-wise count rates for Quadrant C Data is divided into 100 sec bins |
 |
 |
| Module-wise count rates for Quadrant D Data is divided into 100 sec bins |
 |
 |
| Parameter | Plot |
|---|---|
| CZT HV Monitor | 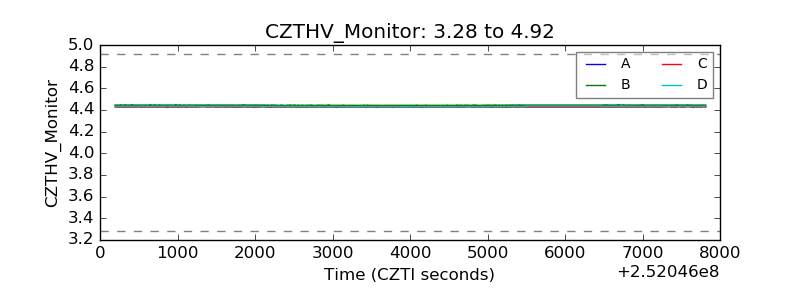 |
| D_VDD | 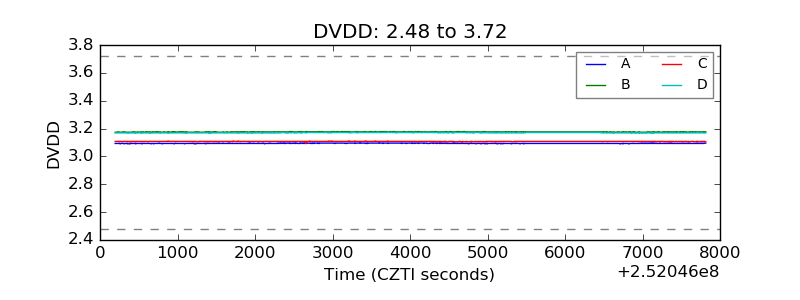 |
| Temperature 1 | 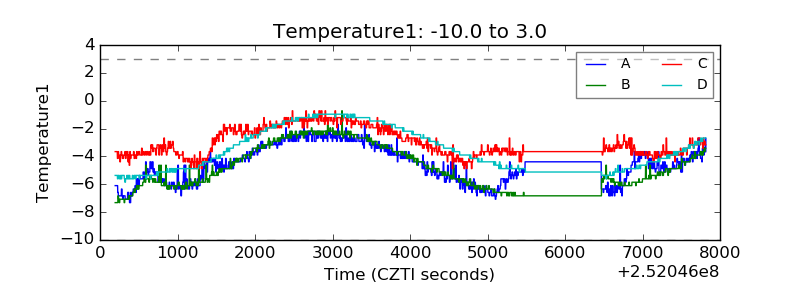 |
| Veto HV Monitor | 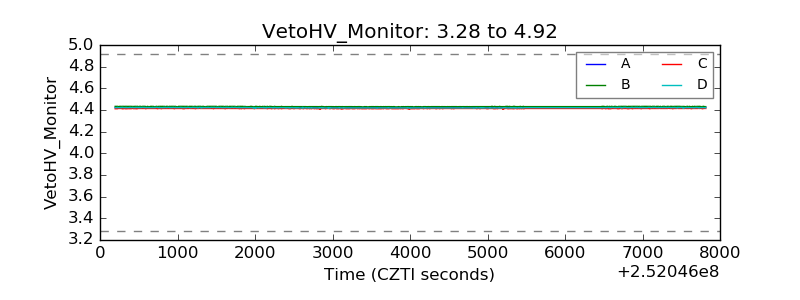 |
| Veto LLD | 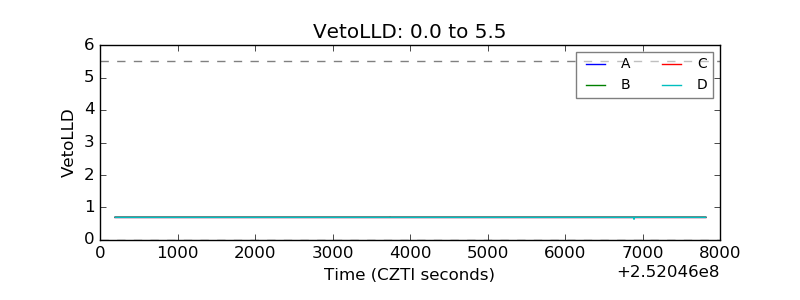 |
| Alpha Counter | 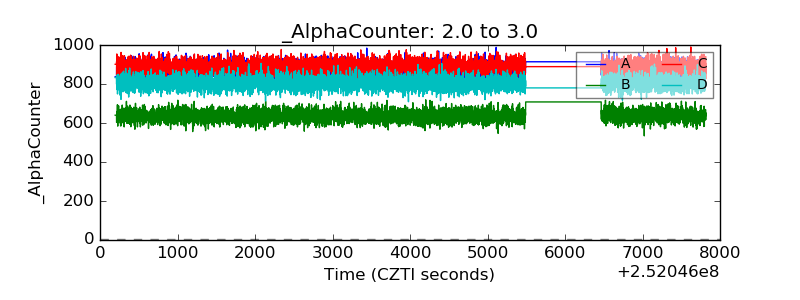 |
| _CPM_Rate | 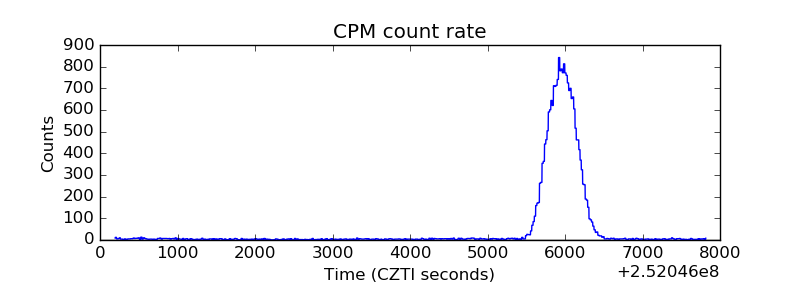 |
| CZT Counter | 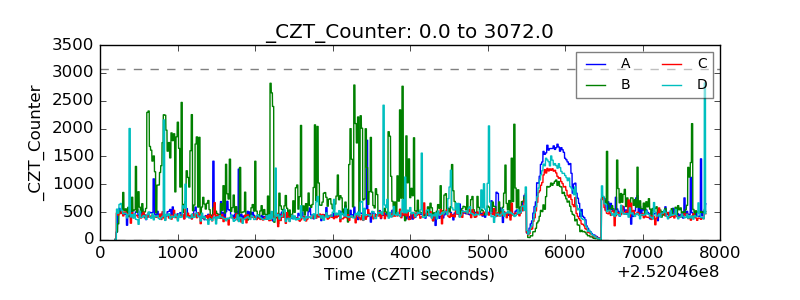 |
| +2.5 Volts monitor |  |
| +5 Volts monitor |  |
| _ROLL_ROT | 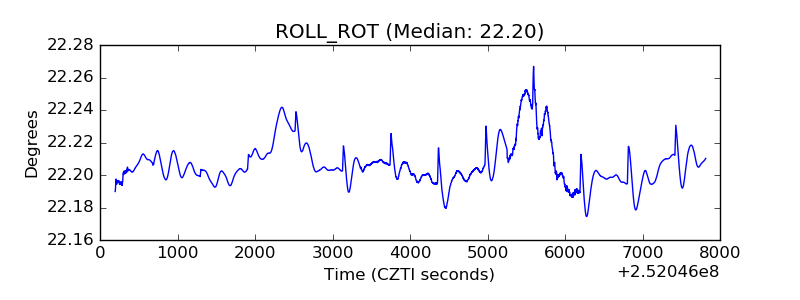 |
| _Roll_DEC | 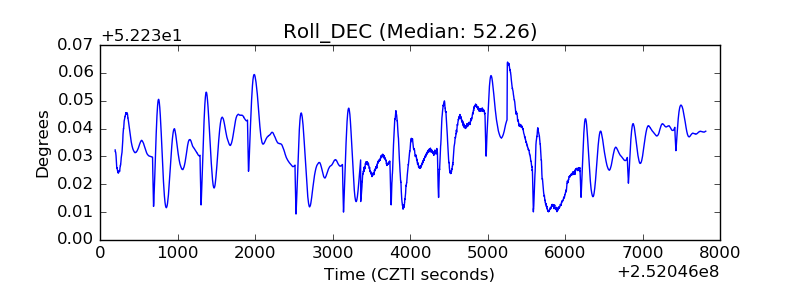 |
| _Roll_RA | 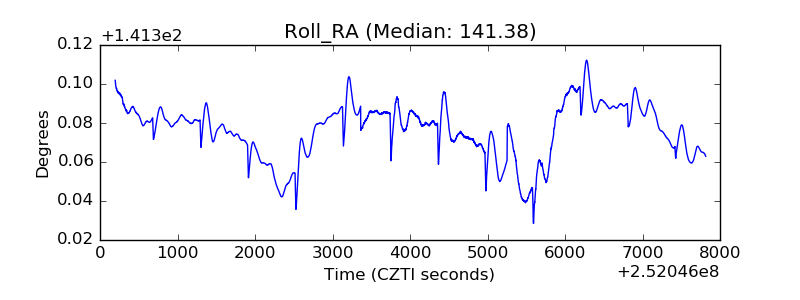 |
| Veto Counter | 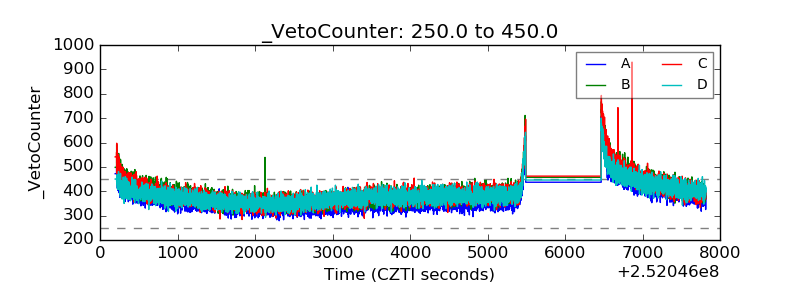 |