| Param | Original file | Final file |
|---|---|---|
| Filename | modeM0/AS1G08_065T01_9000001796_12159cztM0_level2.evt | modeM0/AS1G08_065T01_9000001796_12159cztM0_level2_quad_clean.evt |
| Size (bytes) | 509,304,960 | 86,019,840 |
| Size | 485.7 MB | 82.0 MB |
| Events in quadrant A | 3,503,568 | 550,874 |
| Events in quadrant B | 4,737,198 | 542,998 |
| Events in quadrant C | 3,274,092 | 540,530 |
| Events in quadrant D | 3,478,785 | 527,580 |
| Mode M0 | |||
|---|---|---|---|
| Quadrant | BADHDUFLAG | Total packets | Discarded packets |
| A | 0 | 14499 | 3 |
| B | 0 | 18572 | 2 |
| C | 0 | 13713 | 2 |
| D | 0 | 14481 | 2 |
| Mode M9 | |||
|---|---|---|---|
| Quadrant | BADHDUFLAG | Total packets | Discarded packets |
| A | 0 | 21 | 0 |
| B | 0 | 21 | 0 |
| C | 0 | 21 | 0 |
| D | 0 | 22 | 0 |
| Mode SS | |||
|---|---|---|---|
| Quadrant | BADHDUFLAG | Total packets | Discarded packets |
| A | 0 | 128 | 0 |
| B | 0 | 128 | 0 |
| C | 0 | 128 | 0 |
| D | 0 | 128 | 0 |
| Quadrant | Total seconds | Saturated seconds | Saturation percentage |
|---|---|---|---|
| A | 6349 | 146 | 2.299575% |
| B | 6349 | 467 | 7.355489% |
| C | 6349 | 101 | 1.590802% |
| D | 6349 | 138 | 2.173571% |
Noise dominated data is calculated using 1-second bins in cleaned event files. If a bin has >2000 counts, and if more than 50% of those come from <1% of pixels, then it is considered to be noise-dominated and hence unusable.
| Quadrant | # 1 sec bins | Bins with >0 counts | Bins with >2000 counts | High rate bins dominated by noise | Noise dominated (total time) | Noise dominated (detector-on time) | Marked lightcurve |
|---|---|---|---|---|---|---|---|
| A | 7635 | 6351 | 1 | 1 | 0.01% | 0.02% | 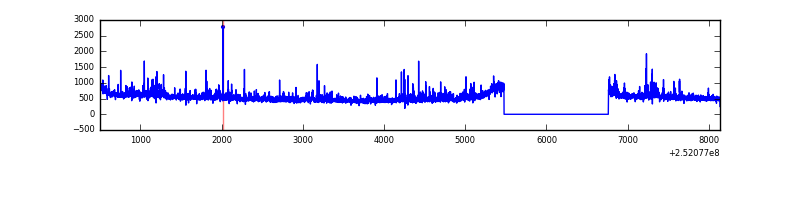 |
| B | 7635 | 6350 | 181 | 181 | 2.37% | 2.85% | 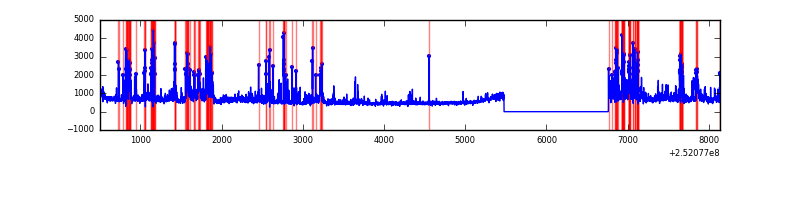 |
| C | 7635 | 6351 | 4 | 4 | 0.05% | 0.06% | 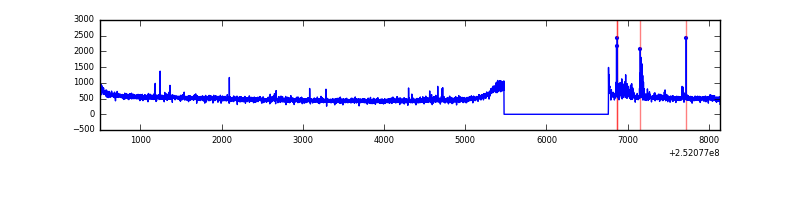 |
| D | 7635 | 6351 | 17 | 17 | 0.22% | 0.27% | 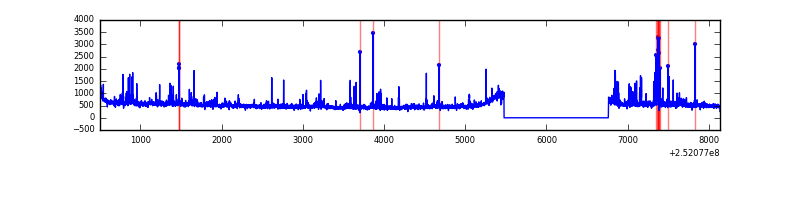 |
Top three noisy pixels from each quadrant. If the there are fewer than three noisy pixels in the level2.evt file, extra rows are filled as -1
| Pixel properties | Quadrant properties | ||||||
|---|---|---|---|---|---|---|---|
| Quadrant | DetID | PixID | Counts | Sigma | Mean | Median | Sigma |
| A | 1 | 162 | 105404 | 625.74 | 838 | 822 | 167.1 |
| A | 1 | 178 | 49688 | 292.38 | 838 | 822 | 167.1 |
| A | 1 | 161 | 45127 | 265.09 | 838 | 822 | 167.1 |
| B | 4 | 239 | 939600 | 6218.71 | 815 | 798 | 151.0 |
| B | 0 | 85 | 185732 | 1225.02 | 815 | 798 | 151.0 |
| B | 11 | 51 | 123816 | 814.88 | 815 | 798 | 151.0 |
| C | 15 | 208 | 88476 | 470.91 | 816 | 820 | 186.1 |
| C | 13 | 61 | 6137 | 28.56 | 816 | 820 | 186.1 |
| C | 12 | 4 | 3636 | 15.13 | 816 | 820 | 186.1 |
| D | 1 | 52 | 114300 | 588.28 | 816 | 794 | 192.9 |
| D | 10 | 199 | 83376 | 428.01 | 816 | 794 | 192.9 |
| D | 13 | 249 | 40389 | 205.21 | 816 | 794 | 192.9 |
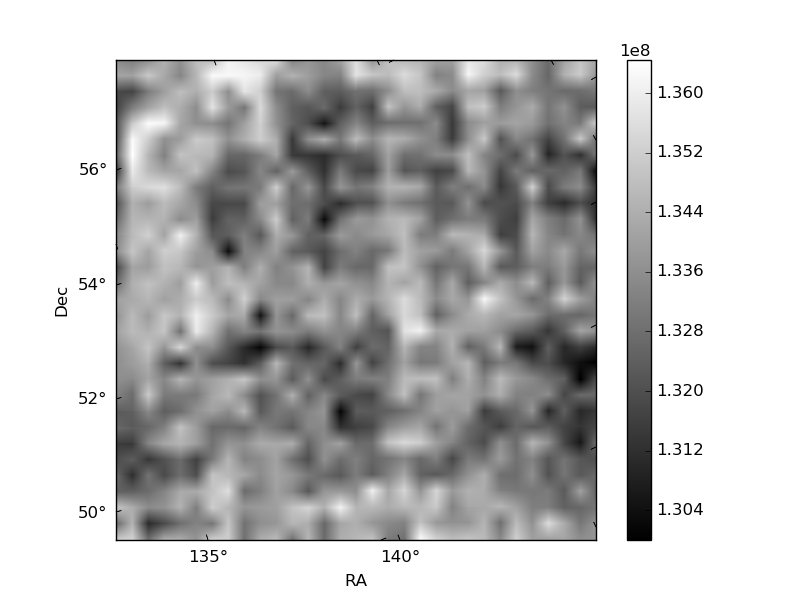
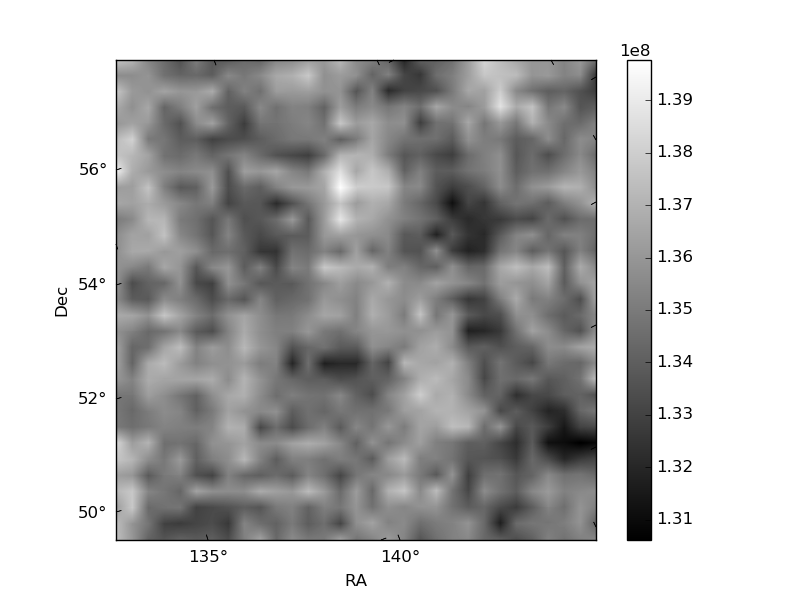
Histogram calculated using DETX and DETY for each event in the final _common_clean file
| Quadrant A |  |
 |
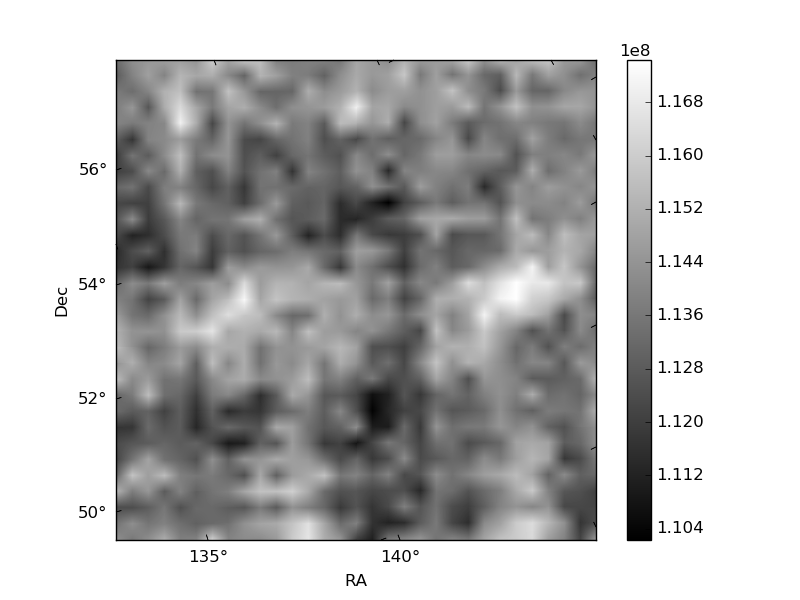
Quadrant B |
|---|---|---|---|
| Quadrant D |  |
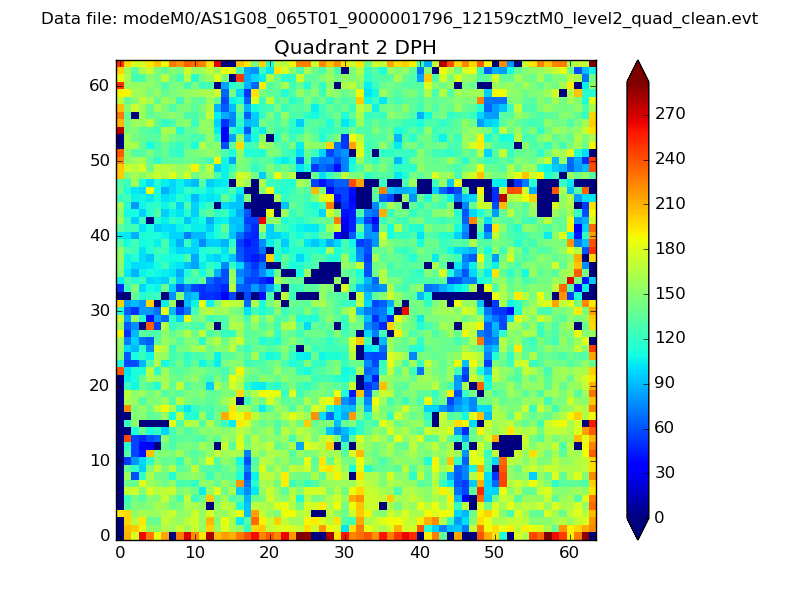 |
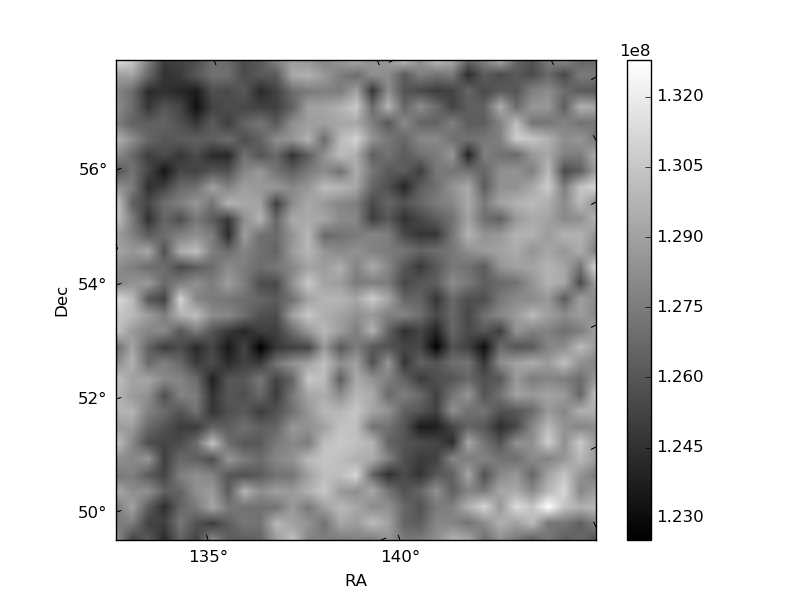
Quadrant C |
| Plot type | Count rate plots | Images |
|---|---|---|
| Comparison with Poisson distribution Blue bars denote a histogram of data divided into 1 sec bins. Red curve is a Poisson curve with rate = median count rate of data. |
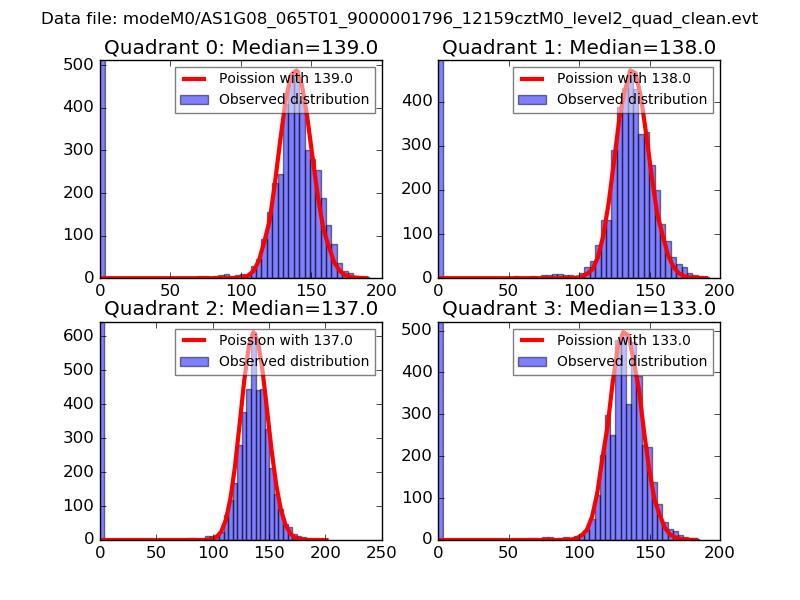 |
 |
| Quadrant-wise count rates Data is divided into 100 sec bins |
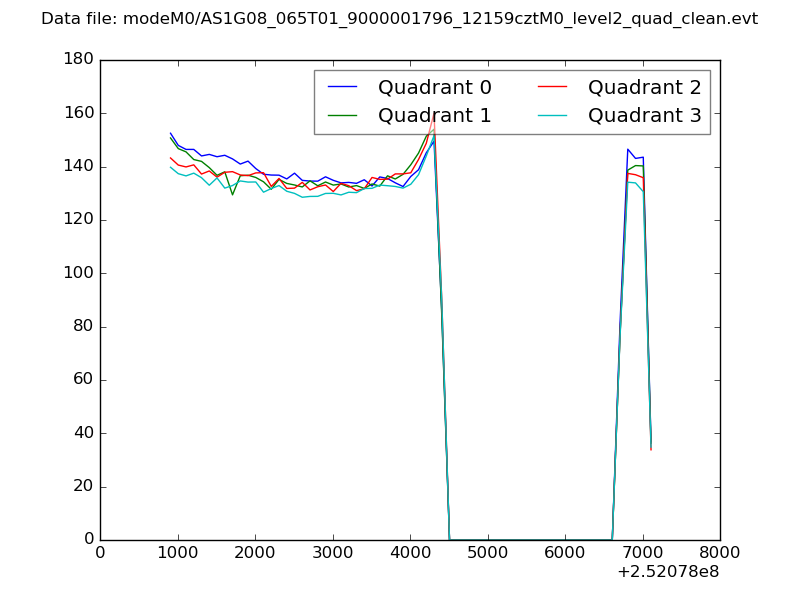 |
|
| Module-wise count rates for Quadrant A Data is divided into 100 sec bins |
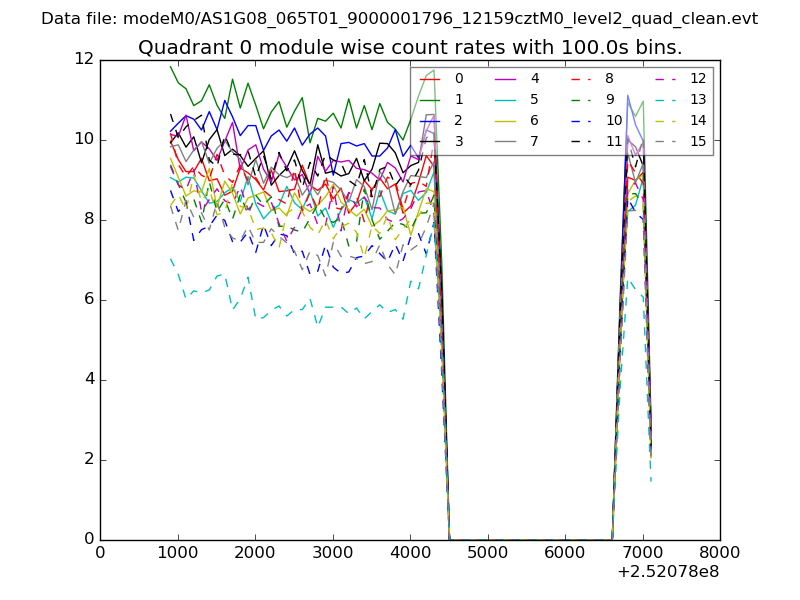 |
 |
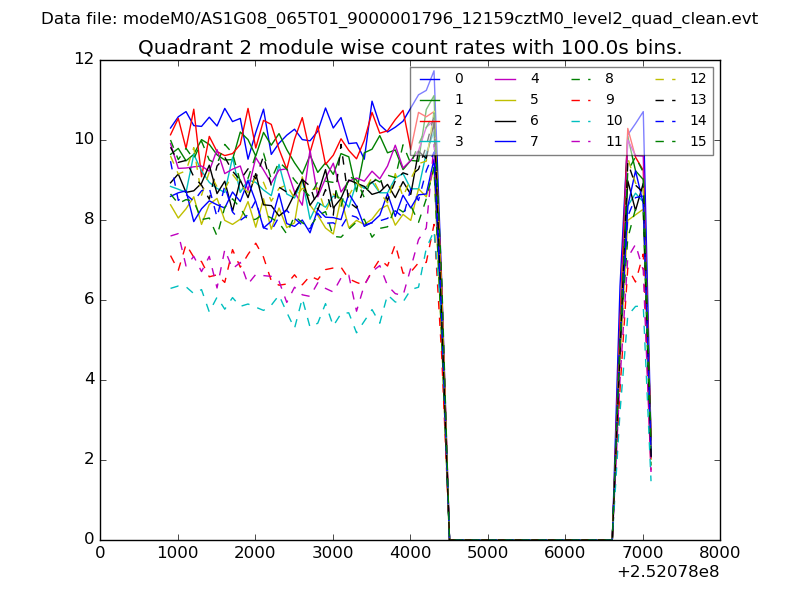
| Module-wise count rates for Quadrant B Data is divided into 100 sec bins |
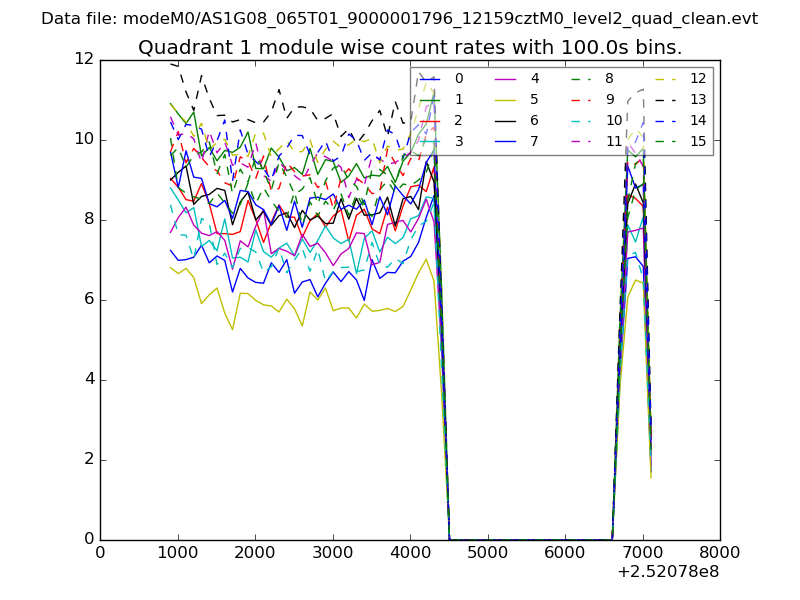 |
 |
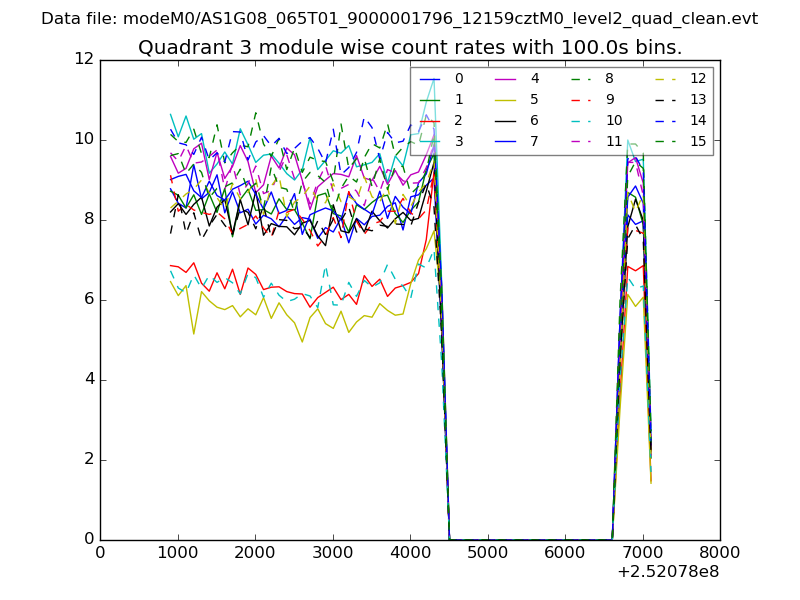
| Module-wise count rates for Quadrant C Data is divided into 100 sec bins |
 |
 |
| Module-wise count rates for Quadrant D Data is divided into 100 sec bins |
 |
 |
| Parameter | Plot |
|---|---|
| CZT HV Monitor | 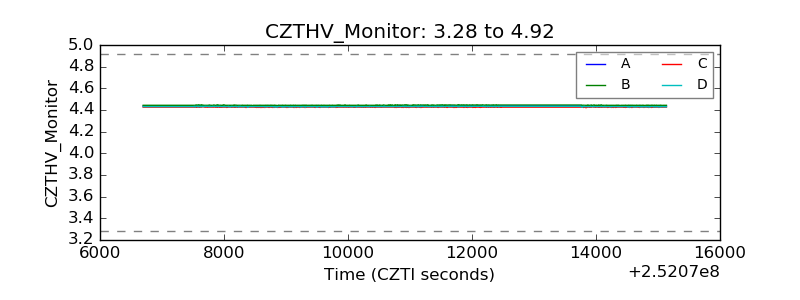 |
| D_VDD | 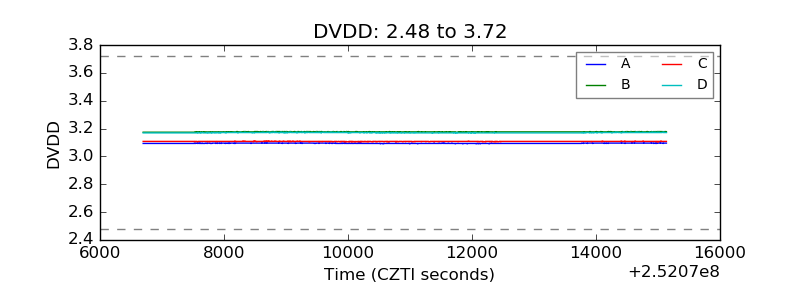 |
| Temperature 1 | 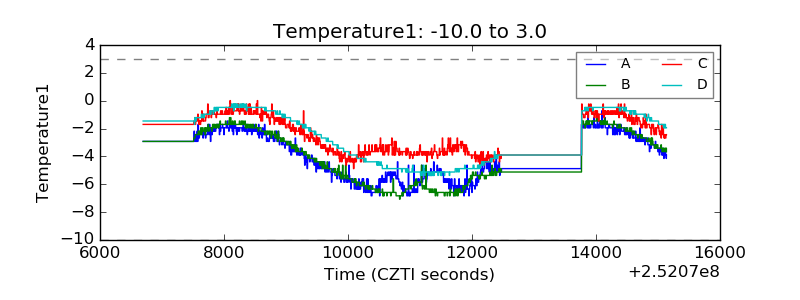 |
| Veto HV Monitor | 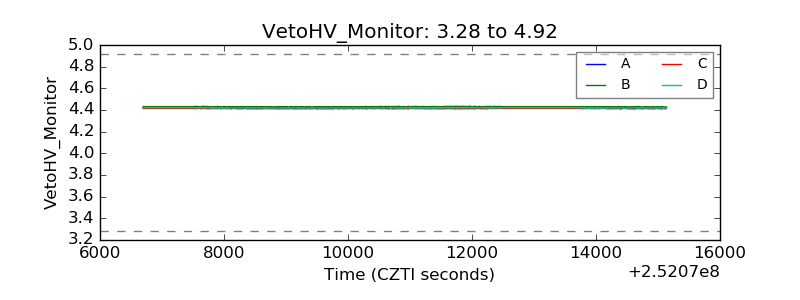 |
| Veto LLD |  |
| Alpha Counter | 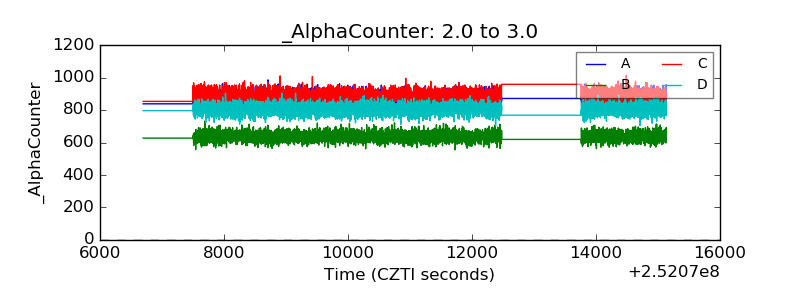 |
| _CPM_Rate | 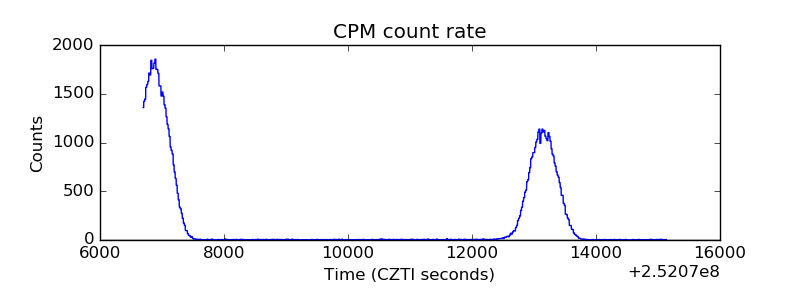 |
| CZT Counter | 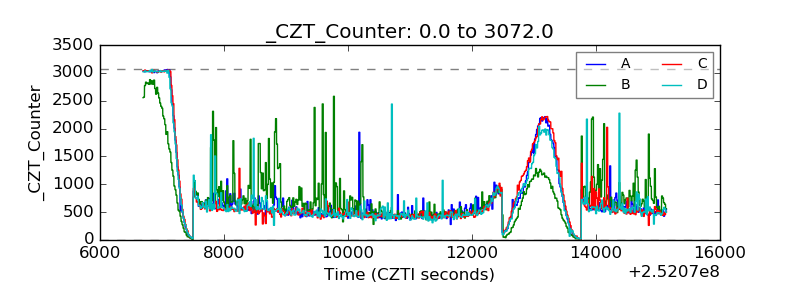 |
| +2.5 Volts monitor | 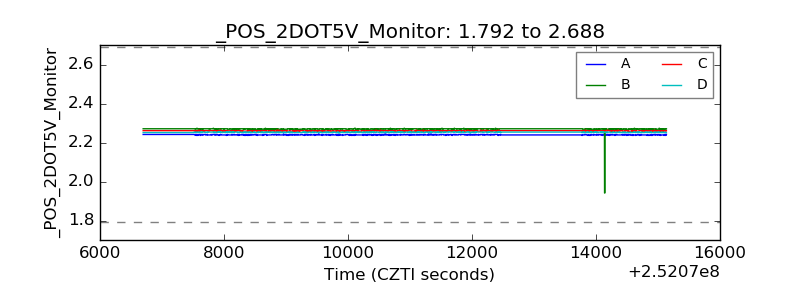 |
| +5 Volts monitor |  |
| _ROLL_ROT | 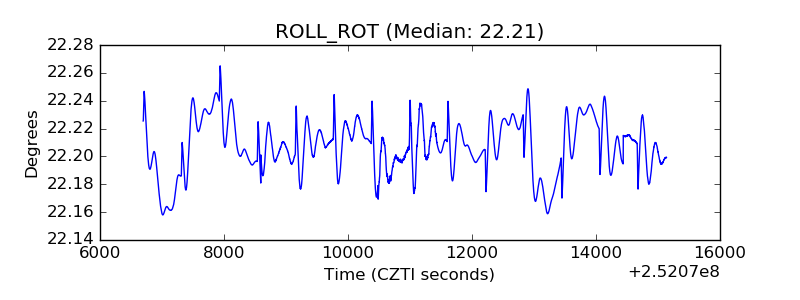 |
| _Roll_DEC | 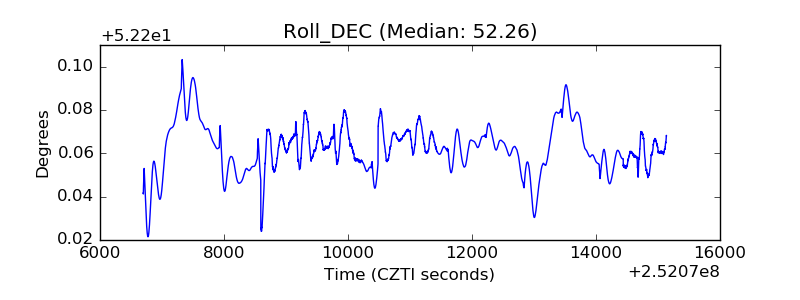 |
| _Roll_RA | 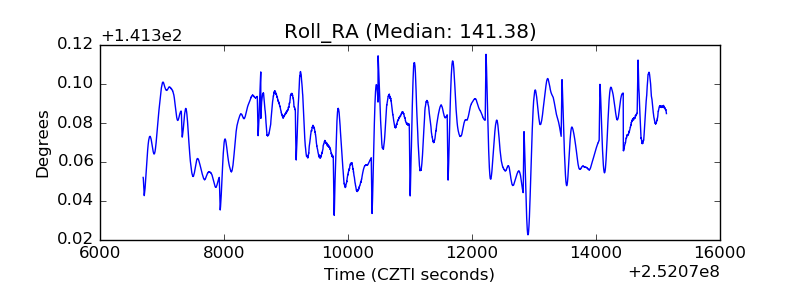 |
| Veto Counter | 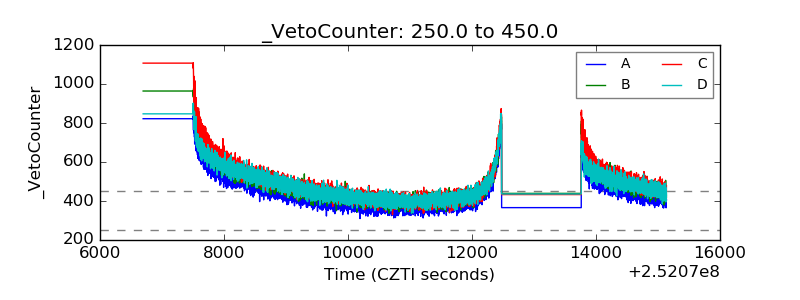 |