| Param | Original file | Final file |
|---|---|---|
| Filename | modeM0/AS1G08_065T01_9000001796_12161cztM0_level2.evt | modeM0/AS1G08_065T01_9000001796_12161cztM0_level2_quad_clean.evt |
| Size (bytes) | 563,650,560 | 108,544,320 |
| Size | 537.5 MB | 103.5 MB |
| Events in quadrant A | 3,687,619 | 710,175 |
| Events in quadrant B | 5,281,416 | 689,555 |
| Events in quadrant C | 3,499,077 | 700,524 |
| Events in quadrant D | 4,105,633 | 677,626 |
| Mode M0 | |||
|---|---|---|---|
| Quadrant | BADHDUFLAG | Total packets | Discarded packets |
| A | 0 | 15910 | 3 |
| B | 0 | 20703 | 2 |
| C | 0 | 15424 | 2 |
| D | 0 | 17228 | 2 |
| Mode M9 | |||
|---|---|---|---|
| Quadrant | BADHDUFLAG | Total packets | Discarded packets |
| A | 0 | 18 | 0 |
| B | 0 | 18 | 0 |
| C | 0 | 18 | 0 |
| D | 0 | 18 | 0 |
| Mode SS | |||
|---|---|---|---|
| Quadrant | BADHDUFLAG | Total packets | Discarded packets |
| A | 0 | 150 | 0 |
| B | 0 | 150 | 0 |
| C | 0 | 150 | 0 |
| D | 0 | 150 | 0 |
| Quadrant | Total seconds | Saturated seconds | Saturation percentage |
|---|---|---|---|
| A | 7319 | 140 | 1.912830% |
| B | 7319 | 500 | 6.831534% |
| C | 7319 | 80 | 1.093045% |
| D | 7319 | 161 | 2.199754% |
Noise dominated data is calculated using 1-second bins in cleaned event files. If a bin has >2000 counts, and if more than 50% of those come from <1% of pixels, then it is considered to be noise-dominated and hence unusable.
| Quadrant | # 1 sec bins | Bins with >0 counts | Bins with >2000 counts | High rate bins dominated by noise | Noise dominated (total time) | Noise dominated (detector-on time) | Marked lightcurve |
|---|---|---|---|---|---|---|---|
| A | 9155 | 7322 | 28 | 28 | 0.31% | 0.38% | 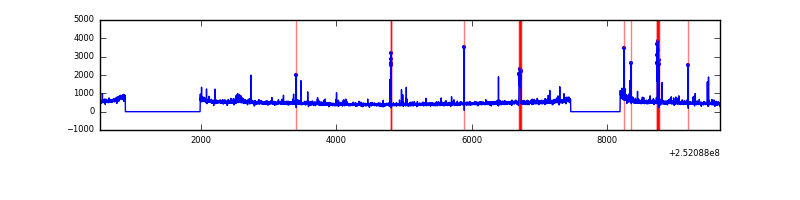 |
| B | 9155 | 7322 | 209 | 209 | 2.28% | 2.85% | 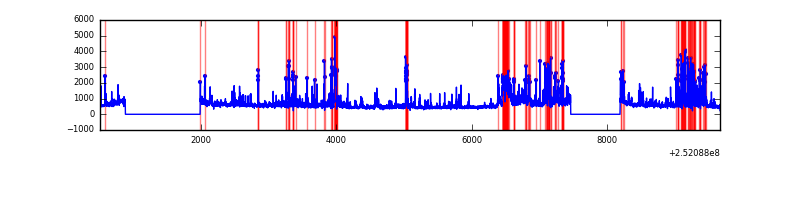 |
| C | 9155 | 7322 | 9 | 9 | 0.10% | 0.12% | 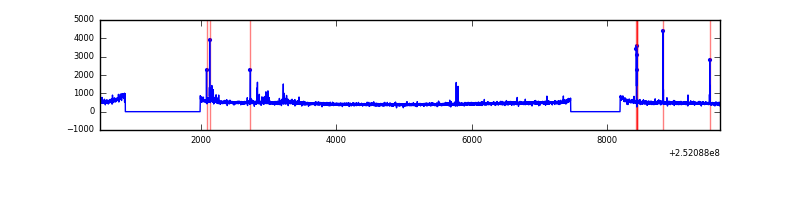 |
| D | 9155 | 7322 | 70 | 70 | 0.76% | 0.96% | 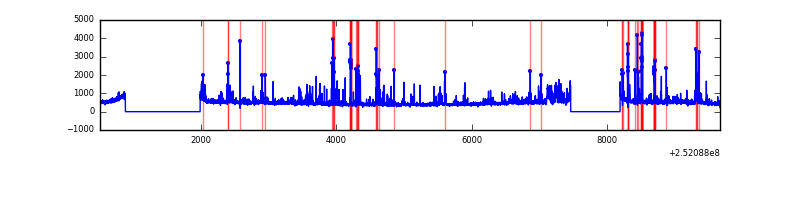 |
Top three noisy pixels from each quadrant. If the there are fewer than three noisy pixels in the level2.evt file, extra rows are filled as -1
| Pixel properties | Quadrant properties | ||||||
|---|---|---|---|---|---|---|---|
| Quadrant | DetID | PixID | Counts | Sigma | Mean | Median | Sigma |
| A | 9 | 143 | 81001 | 446.68 | 892 | 873 | 179.4 |
| A | 15 | 249 | 48846 | 267.43 | 892 | 873 | 179.4 |
| A | 1 | 162 | 41681 | 227.49 | 892 | 873 | 179.4 |
| B | 4 | 239 | 900079 | 5470.94 | 873 | 850 | 164.4 |
| B | 0 | 85 | 338115 | 2051.93 | 873 | 850 | 164.4 |
| B | 15 | 204 | 192716 | 1167.32 | 873 | 850 | 164.4 |
| C | 15 | 208 | 106117 | 529.07 | 868 | 873 | 198.9 |
| C | 13 | 61 | 6427 | 27.92 | 868 | 873 | 198.9 |
| C | 14 | 234 | 4468 | 18.07 | 868 | 873 | 198.9 |
| D | 1 | 52 | 298526 | 1437.53 | 865 | 841 | 207.1 |
| D | 10 | 199 | 260351 | 1253.18 | 865 | 841 | 207.1 |
| D | 5 | 222 | 98094 | 469.64 | 865 | 841 | 207.1 |
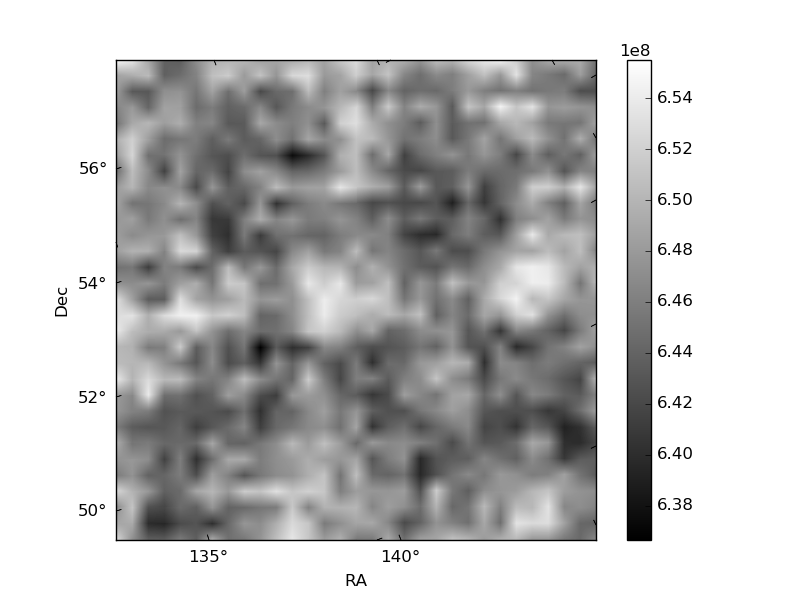
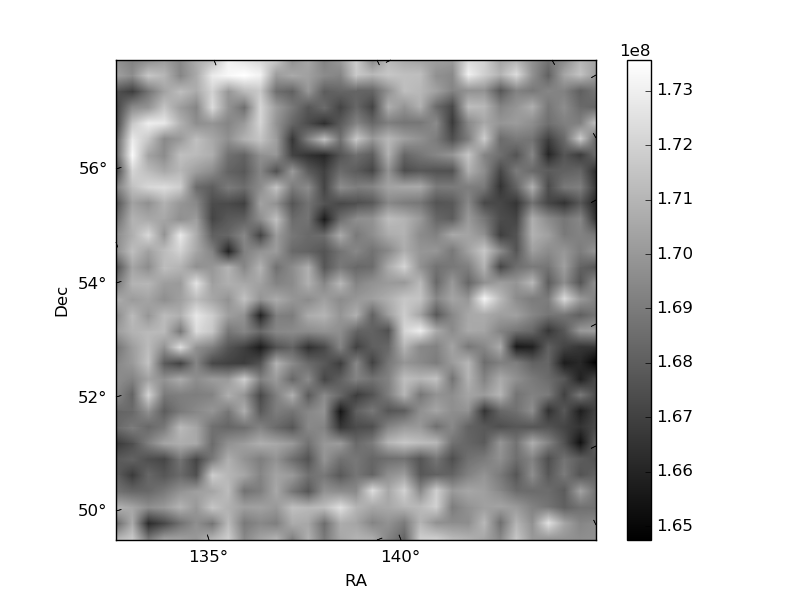
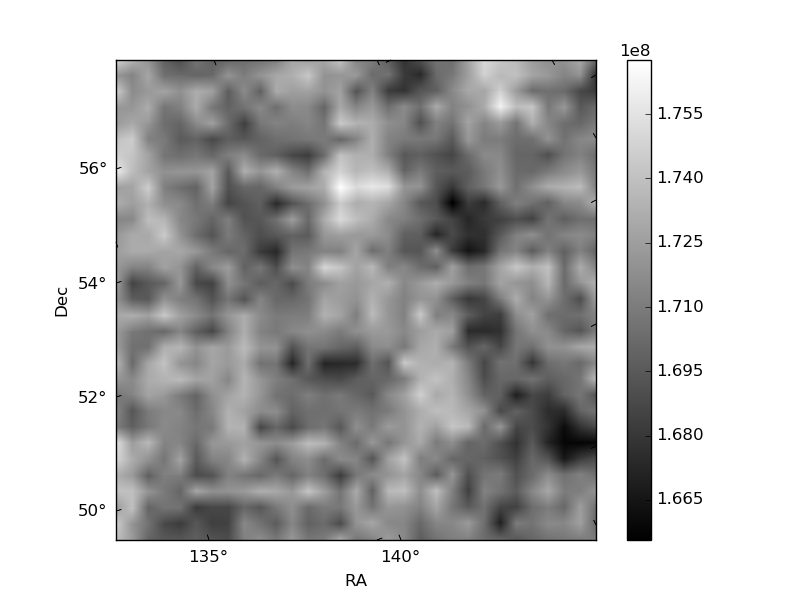
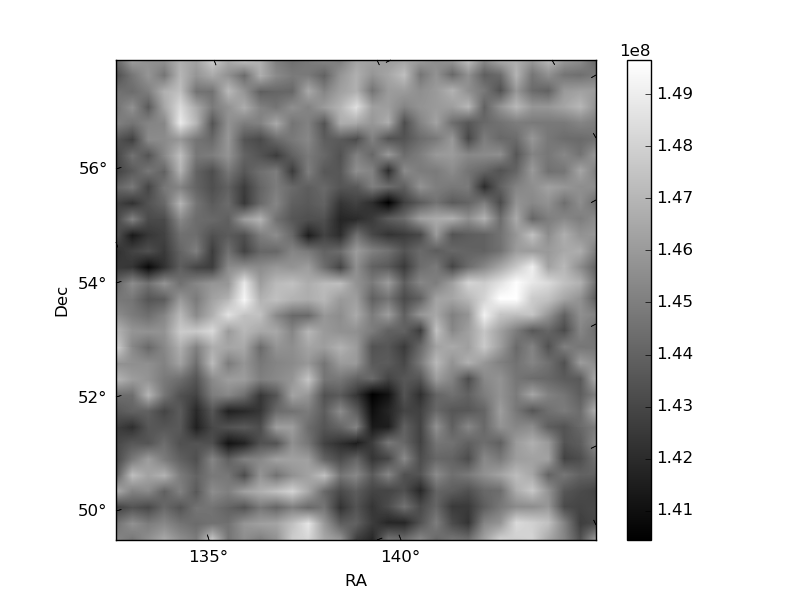
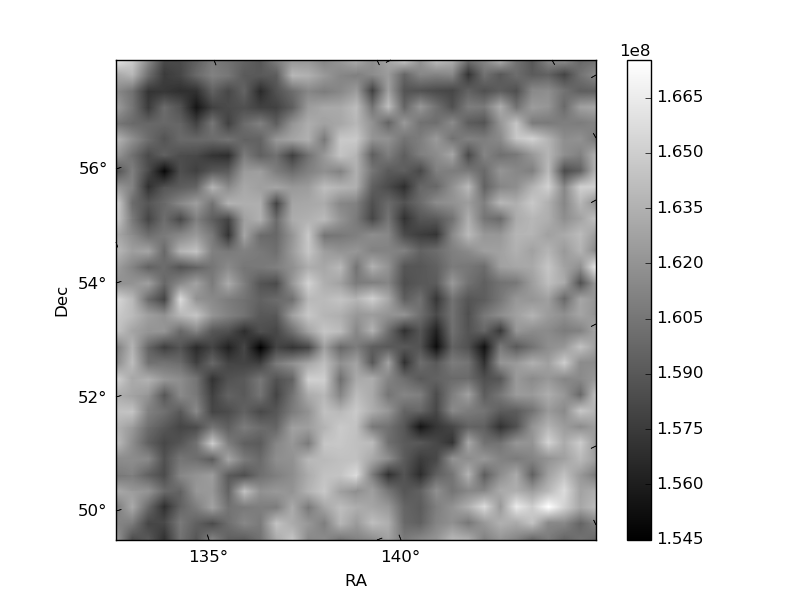
Histogram calculated using DETX and DETY for each event in the final _common_clean file
| Quadrant A | 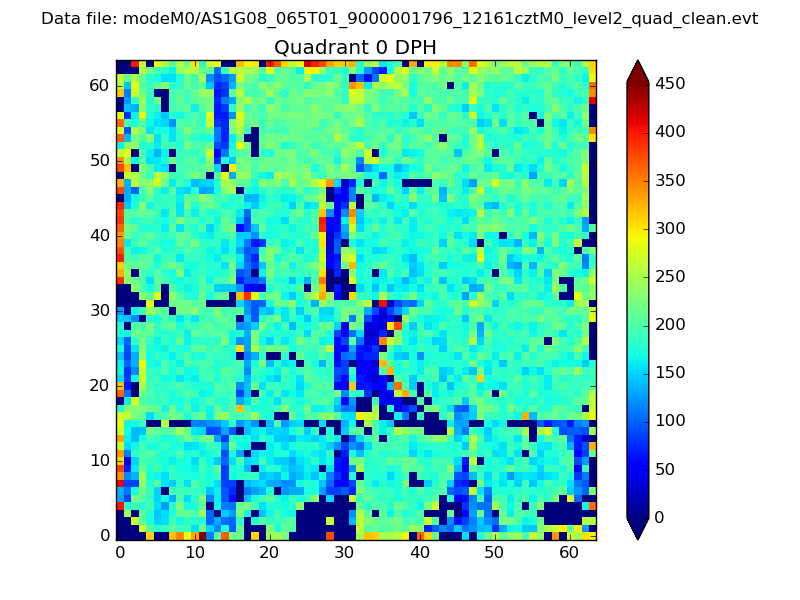 |
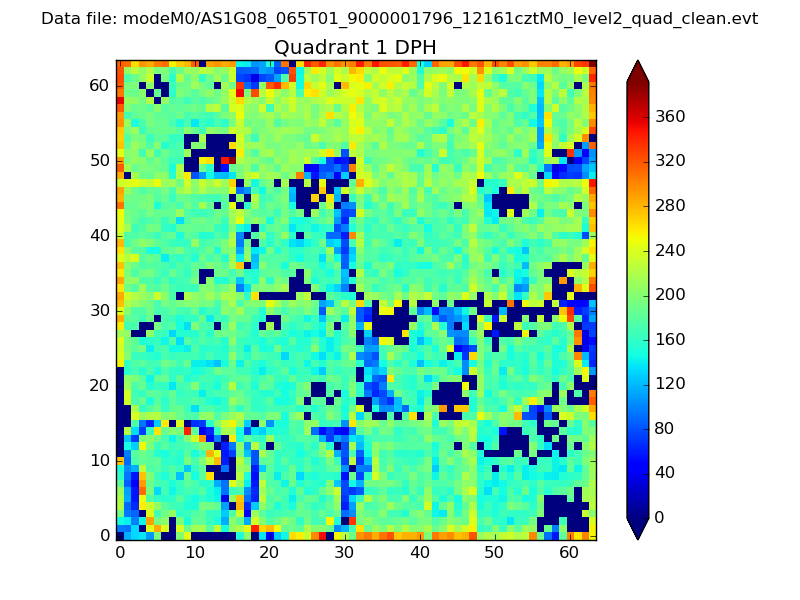 |
Quadrant B |
|---|---|---|---|
| Quadrant D | 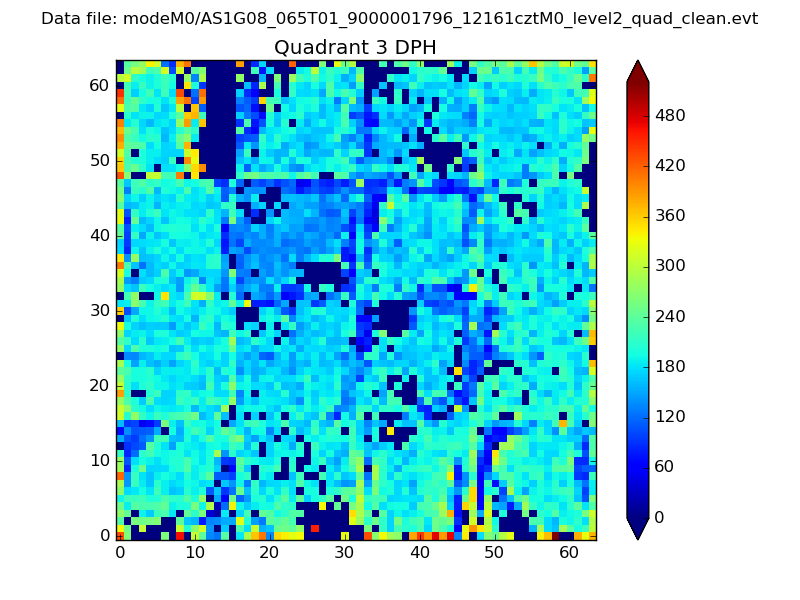 |
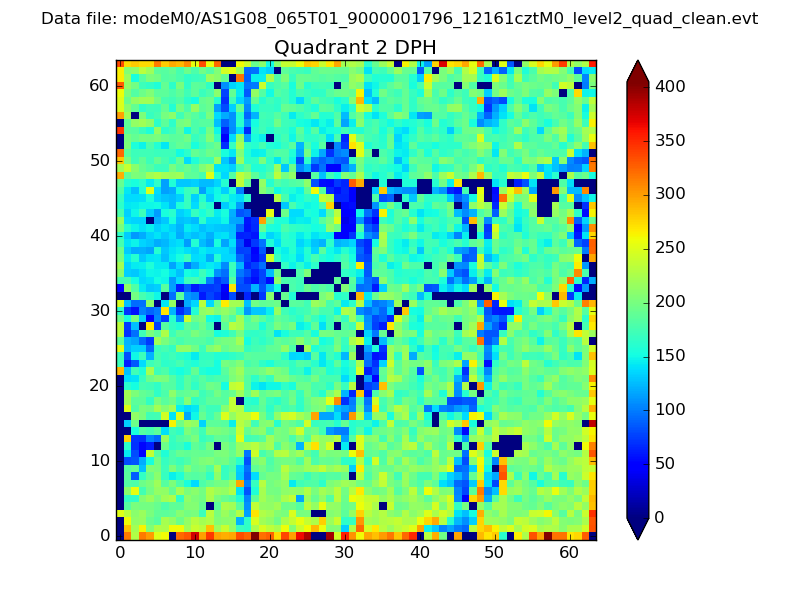 |
Quadrant C |
| Plot type | Count rate plots | Images |
|---|---|---|
| Comparison with Poisson distribution Blue bars denote a histogram of data divided into 1 sec bins. Red curve is a Poisson curve with rate = median count rate of data. |
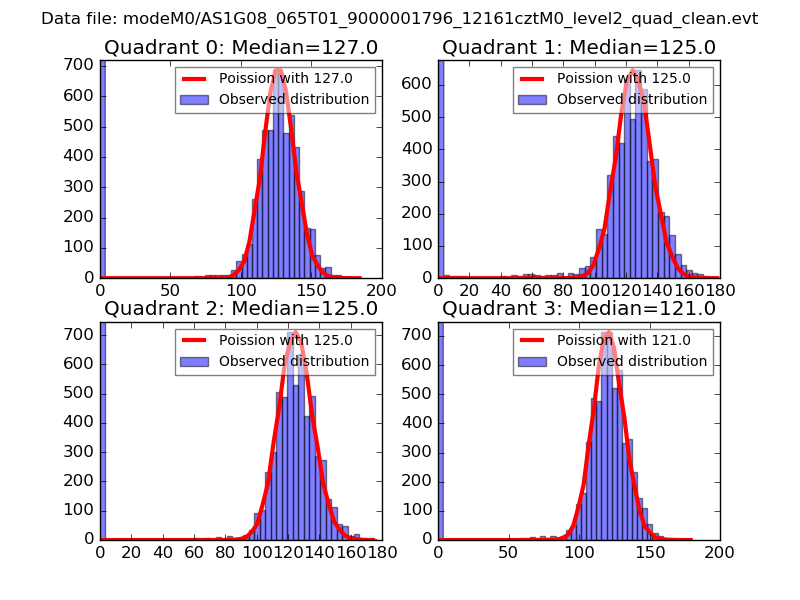 |
 |
| Quadrant-wise count rates Data is divided into 100 sec bins |
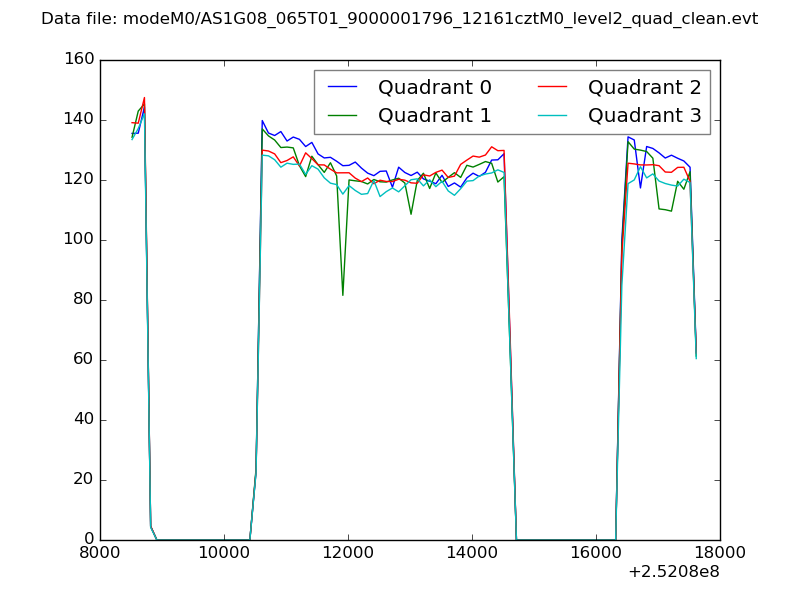 |
|
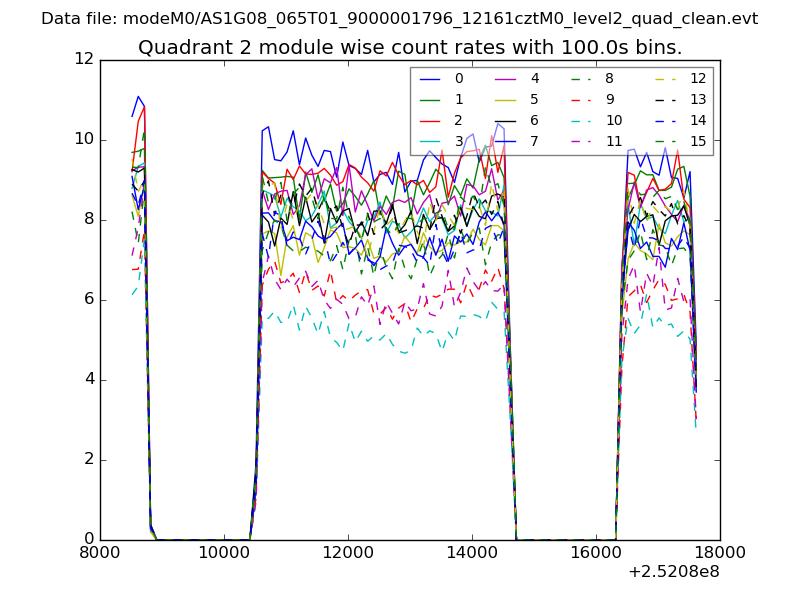
| Module-wise count rates for Quadrant A Data is divided into 100 sec bins |
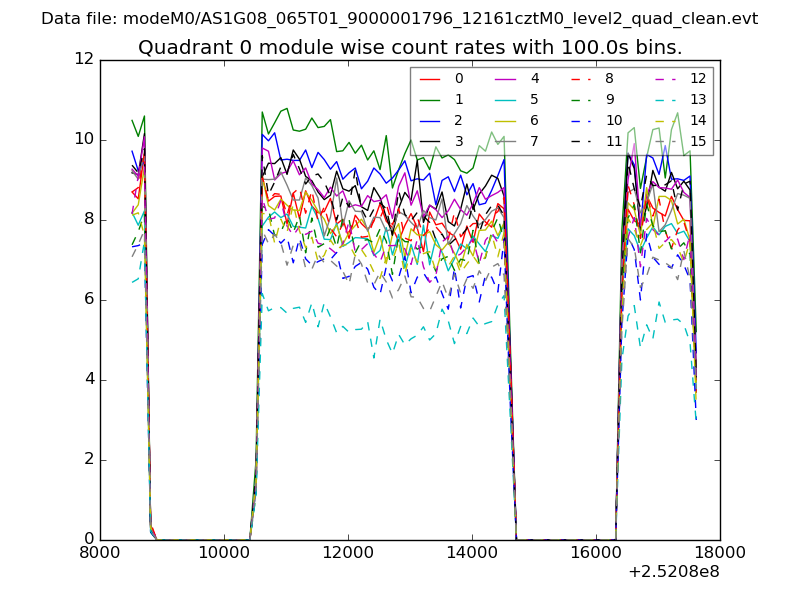 |
 |
| Module-wise count rates for Quadrant B Data is divided into 100 sec bins |
 |
 |
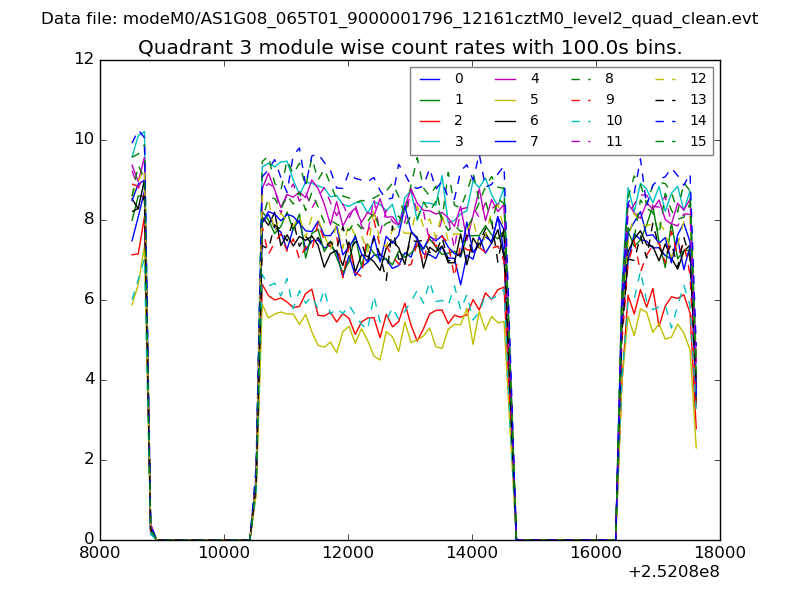
| Module-wise count rates for Quadrant C Data is divided into 100 sec bins |
 |
 |
| Module-wise count rates for Quadrant D Data is divided into 100 sec bins |
 |
 |
| Parameter | Plot |
|---|---|
| CZT HV Monitor | 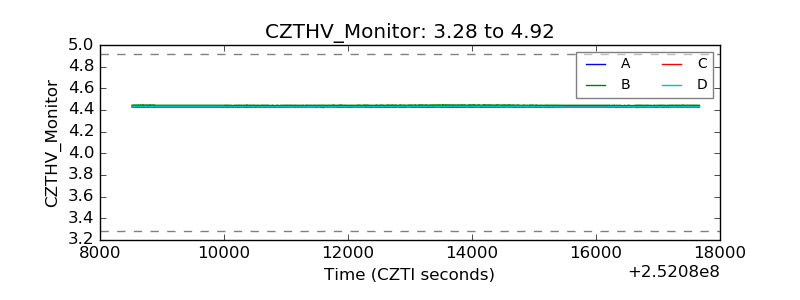 |
| D_VDD | 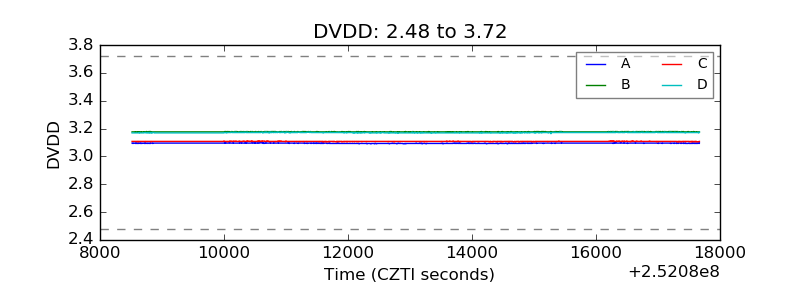 |
| Temperature 1 | 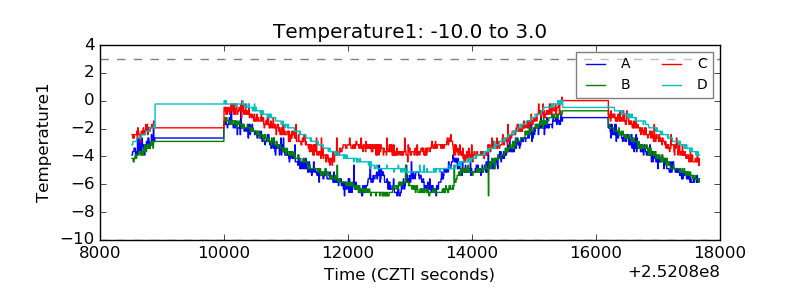 |
| Veto HV Monitor | 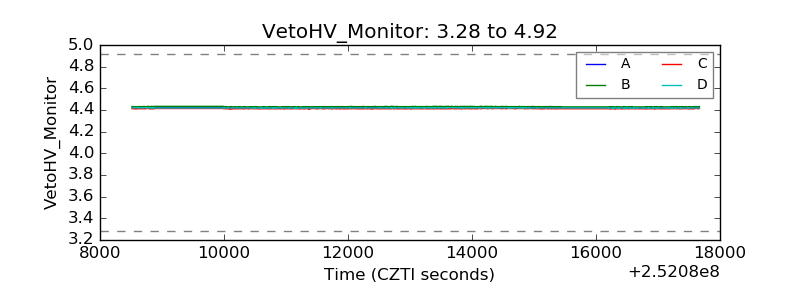 |
| Veto LLD | 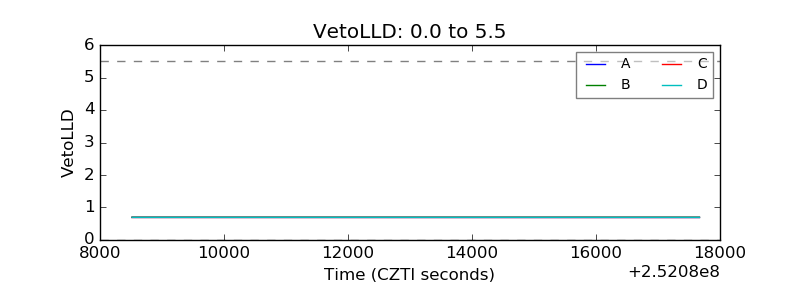 |
| Alpha Counter | 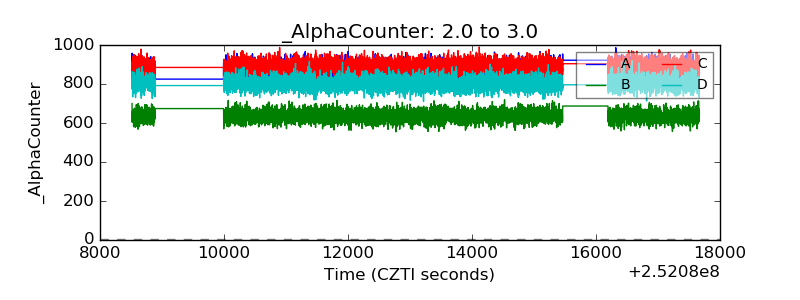 |
| _CPM_Rate |  |
| CZT Counter | 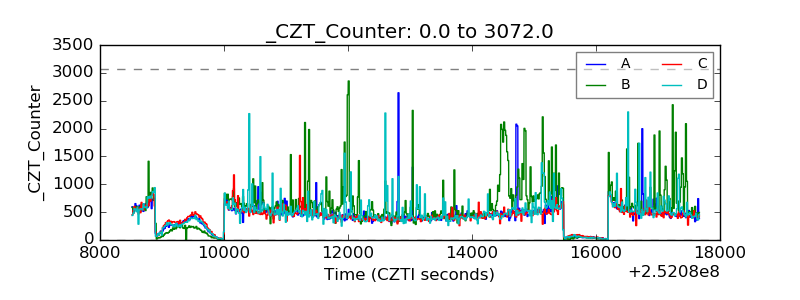 |
| +2.5 Volts monitor |  |
| +5 Volts monitor |  |
| _ROLL_ROT | 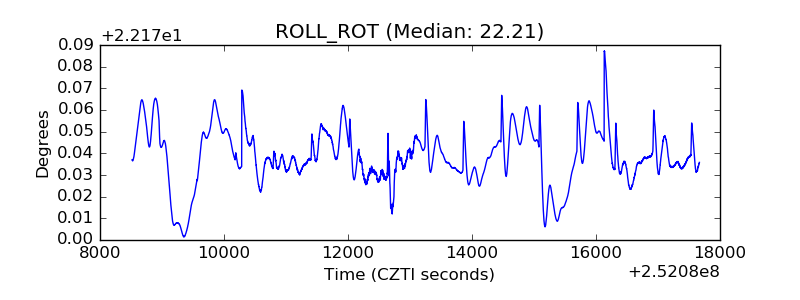 |
| _Roll_DEC |  |
| _Roll_RA | 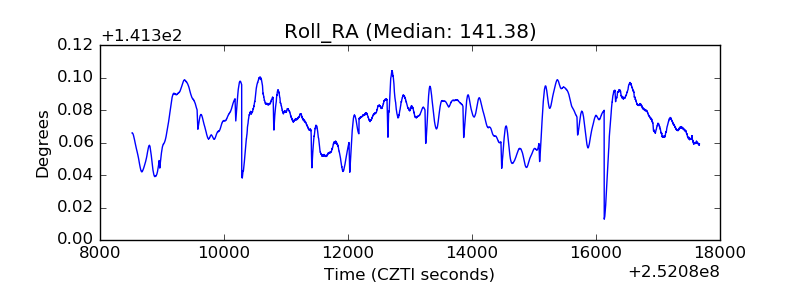 |
| Veto Counter | 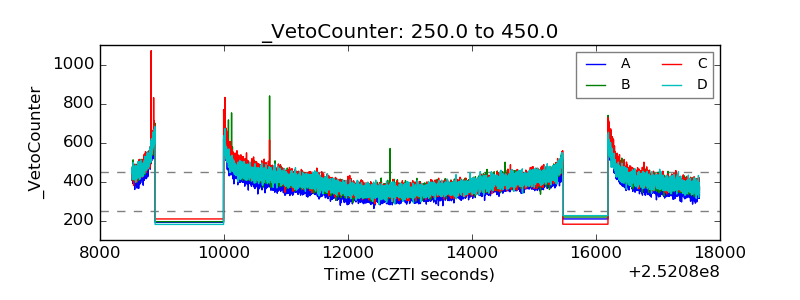 |