| Param | Original file | Final file |
|---|---|---|
| Filename | modeM0/AS1G08_065T01_9000001796_12162cztM0_level2.evt | modeM0/AS1G08_065T01_9000001796_12162cztM0_level2_quad_clean.evt |
| Size (bytes) | 605,885,760 | 107,363,520 |
| Size | 577.8 MB | 102.4 MB |
| Events in quadrant A | 4,032,355 | 692,726 |
| Events in quadrant B | 5,595,937 | 668,258 |
| Events in quadrant C | 3,669,317 | 681,617 |
| Events in quadrant D | 4,515,081 | 658,708 |
| Mode M0 | |||
|---|---|---|---|
| Quadrant | BADHDUFLAG | Total packets | Discarded packets |
| A | 0 | 17318 | 3 |
| B | 0 | 22173 | 2 |
| C | 0 | 16456 | 2 |
| D | 0 | 19038 | 2 |
| Mode M9 | |||
|---|---|---|---|
| Quadrant | BADHDUFLAG | Total packets | Discarded packets |
| A | 0 | 10 | 0 |
| B | 0 | 10 | 0 |
| C | 0 | 10 | 0 |
| D | 0 | 10 | 0 |
| Mode SS | |||
|---|---|---|---|
| Quadrant | BADHDUFLAG | Total packets | Discarded packets |
| A | 0 | 162 | 0 |
| B | 0 | 162 | 0 |
| C | 0 | 162 | 0 |
| D | 0 | 162 | 0 |
| Quadrant | Total seconds | Saturated seconds | Saturation percentage |
|---|---|---|---|
| A | 7914 | 81 | 1.023503% |
| B | 7914 | 586 | 7.404599% |
| C | 7914 | 49 | 0.619156% |
| D | 7914 | 195 | 2.463988% |
Noise dominated data is calculated using 1-second bins in cleaned event files. If a bin has >2000 counts, and if more than 50% of those come from <1% of pixels, then it is considered to be noise-dominated and hence unusable.
| Quadrant | # 1 sec bins | Bins with >0 counts | Bins with >2000 counts | High rate bins dominated by noise | Noise dominated (total time) | Noise dominated (detector-on time) | Marked lightcurve |
|---|---|---|---|---|---|---|---|
| A | 8960 | 7917 | 17 | 17 | 0.19% | 0.21% | 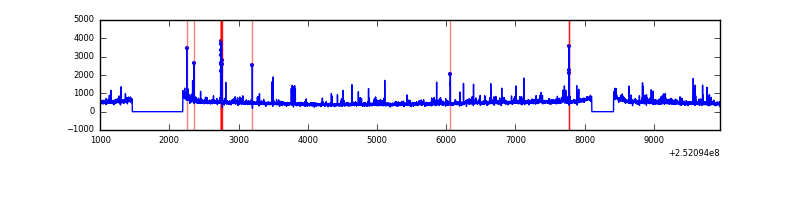 |
| B | 8960 | 7917 | 243 | 243 | 2.71% | 3.07% | 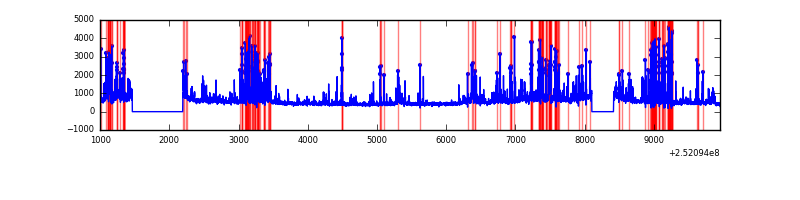 |
| C | 8960 | 7917 | 8 | 8 | 0.09% | 0.10% |  |
| D | 8960 | 7917 | 104 | 104 | 1.16% | 1.31% | 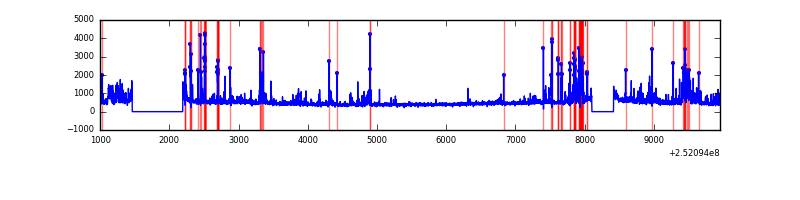 |
Top three noisy pixels from each quadrant. If the there are fewer than three noisy pixels in the level2.evt file, extra rows are filled as -1
| Pixel properties | Quadrant properties | ||||||
|---|---|---|---|---|---|---|---|
| Quadrant | DetID | PixID | Counts | Sigma | Mean | Median | Sigma |
| A | 1 | 162 | 106232 | 550.82 | 949 | 930 | 191.2 |
| A | 9 | 143 | 70010 | 361.35 | 949 | 930 | 191.2 |
| A | 1 | 178 | 42955 | 219.83 | 949 | 930 | 191.2 |
| B | 4 | 239 | 1260203 | 7207.75 | 923 | 899 | 174.7 |
| B | 3 | 64 | 168966 | 961.95 | 923 | 899 | 174.7 |
| B | 15 | 204 | 145105 | 825.38 | 923 | 899 | 174.7 |
| C | 15 | 208 | 69718 | 323.1 | 922 | 927 | 212.9 |
| C | 13 | 61 | 6838 | 27.76 | 922 | 927 | 212.9 |
| C | 12 | 4 | 2394 | 6.89 | 922 | 927 | 212.9 |
| D | 1 | 52 | 318006 | 1430.58 | 913 | 885 | 221.7 |
| D | 10 | 199 | 239282 | 1075.44 | 913 | 885 | 221.7 |
| D | 13 | 249 | 150467 | 674.78 | 913 | 885 | 221.7 |
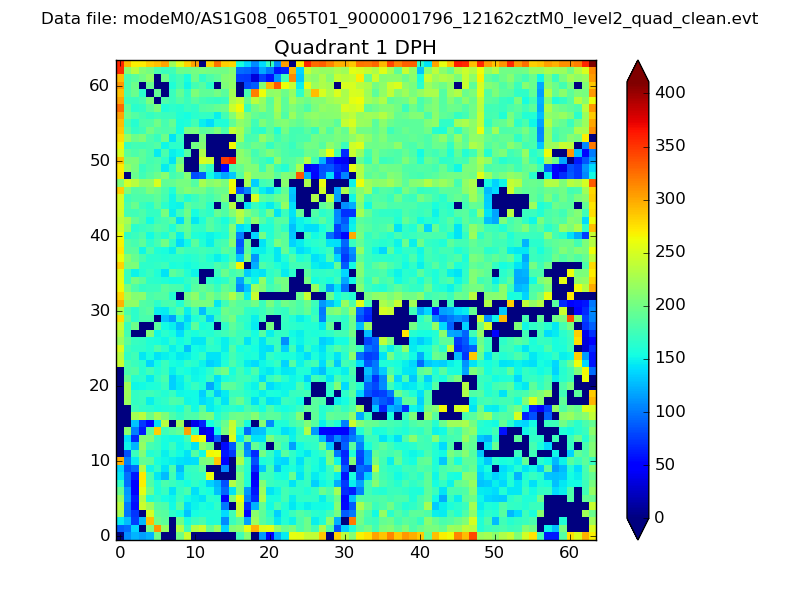
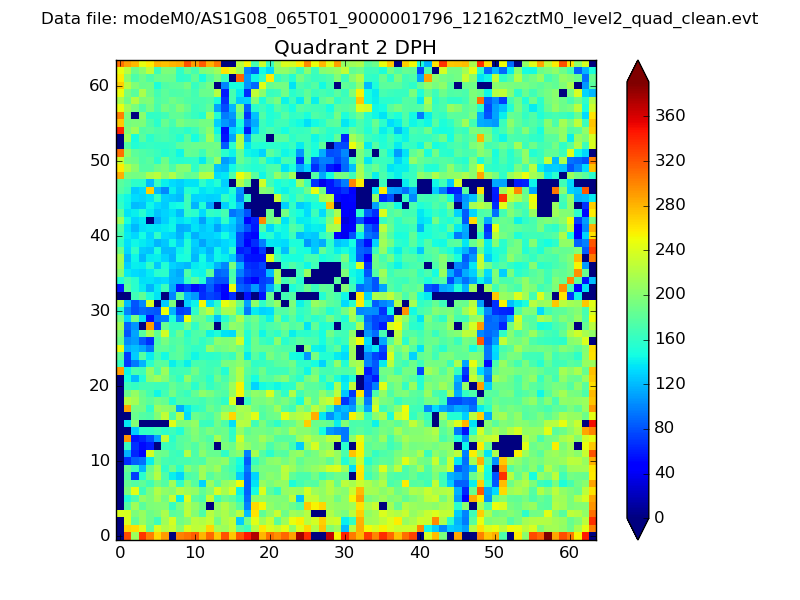
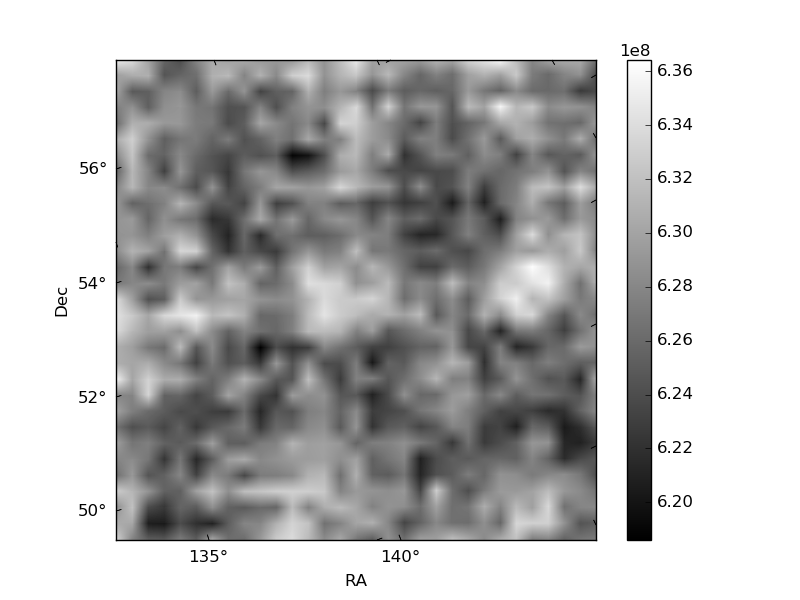
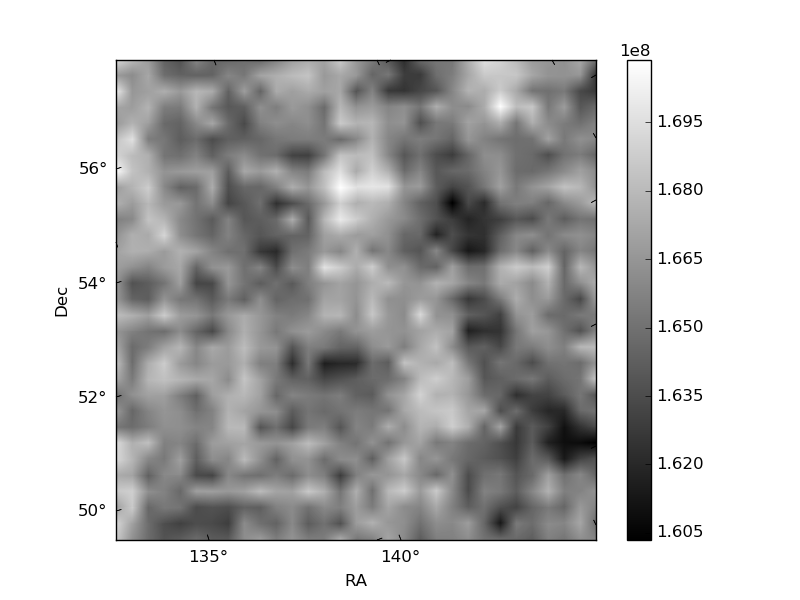
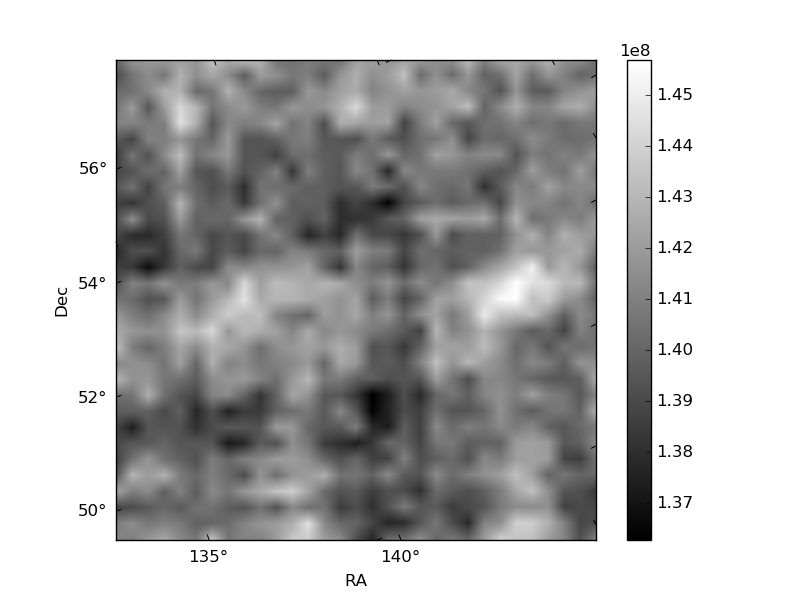
Histogram calculated using DETX and DETY for each event in the final _common_clean file
| Quadrant A | 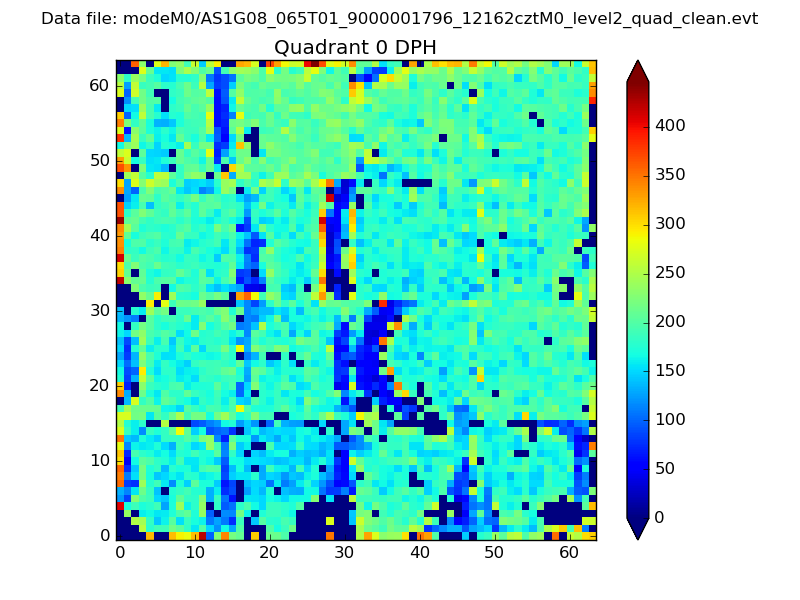 |
 |
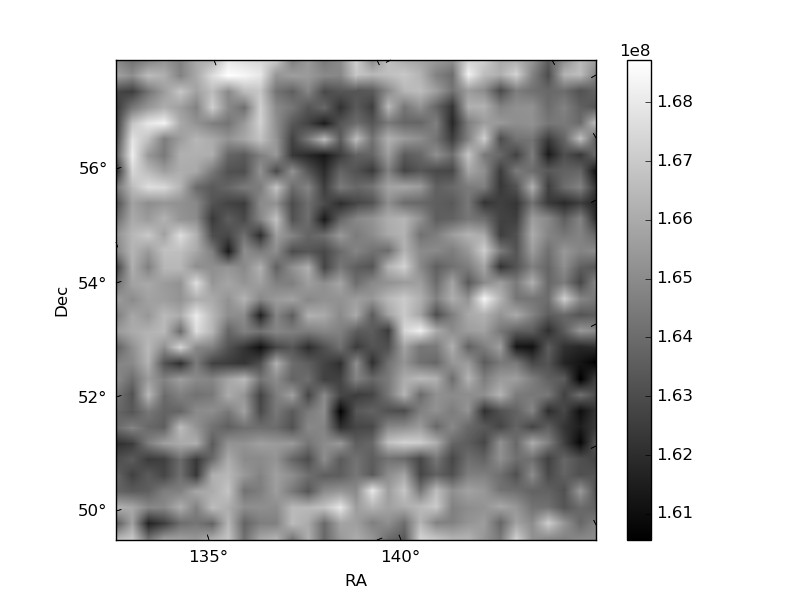
Quadrant B |
|---|---|---|---|
| Quadrant D | 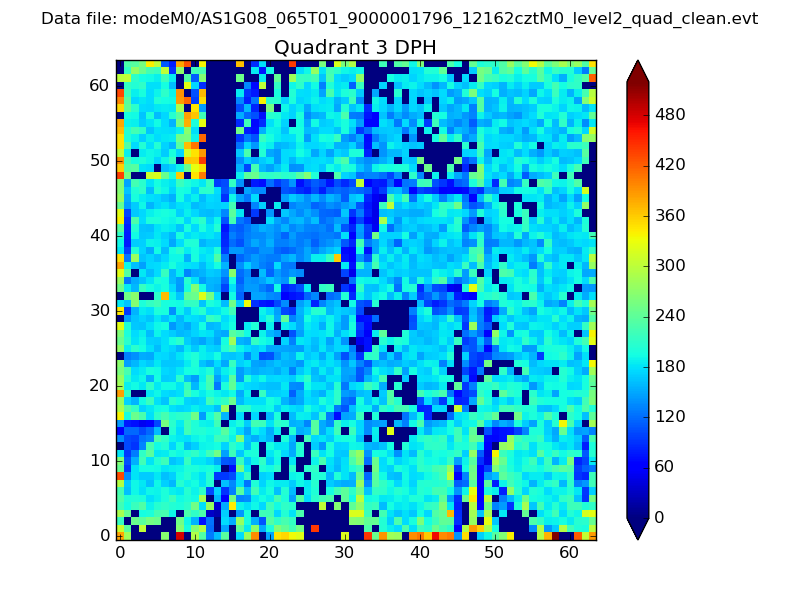 |
 |
Quadrant C |
| Plot type | Count rate plots | Images |
|---|---|---|
| Comparison with Poisson distribution Blue bars denote a histogram of data divided into 1 sec bins. Red curve is a Poisson curve with rate = median count rate of data. |
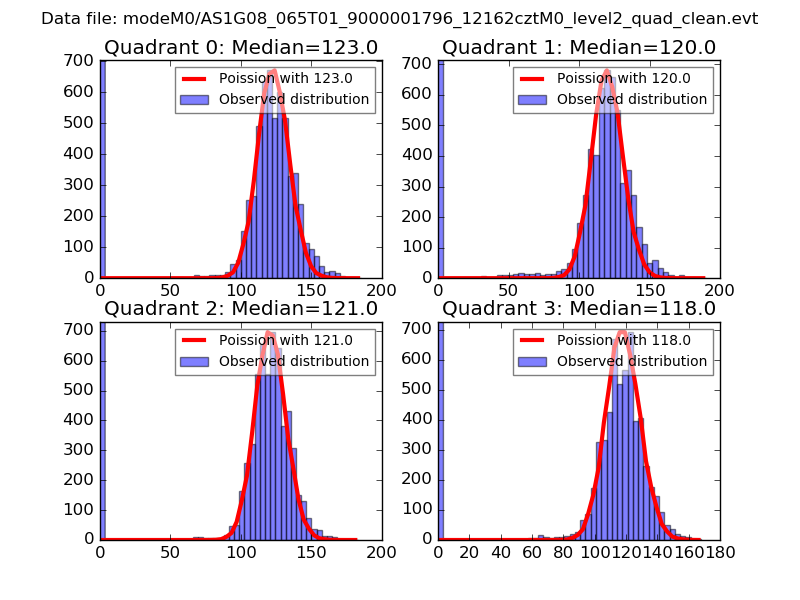 |
 |
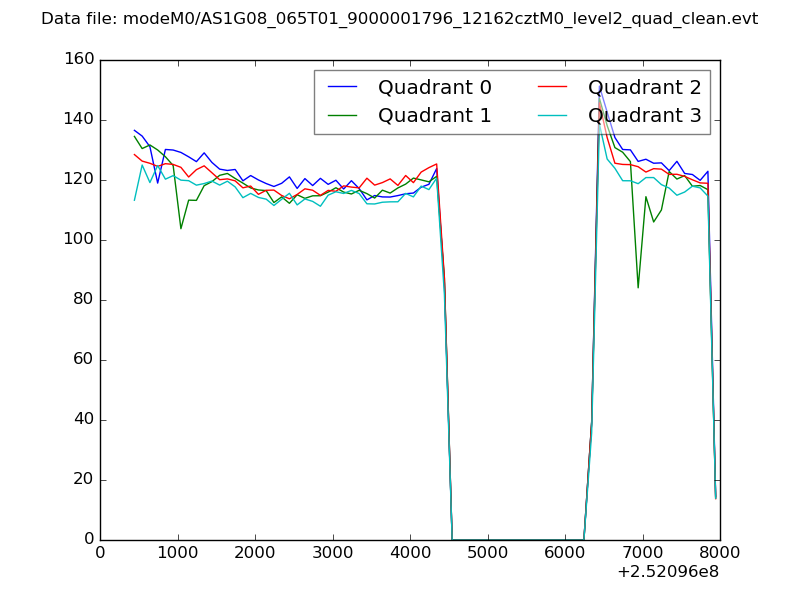
| Quadrant-wise count rates Data is divided into 100 sec bins |
 |
|
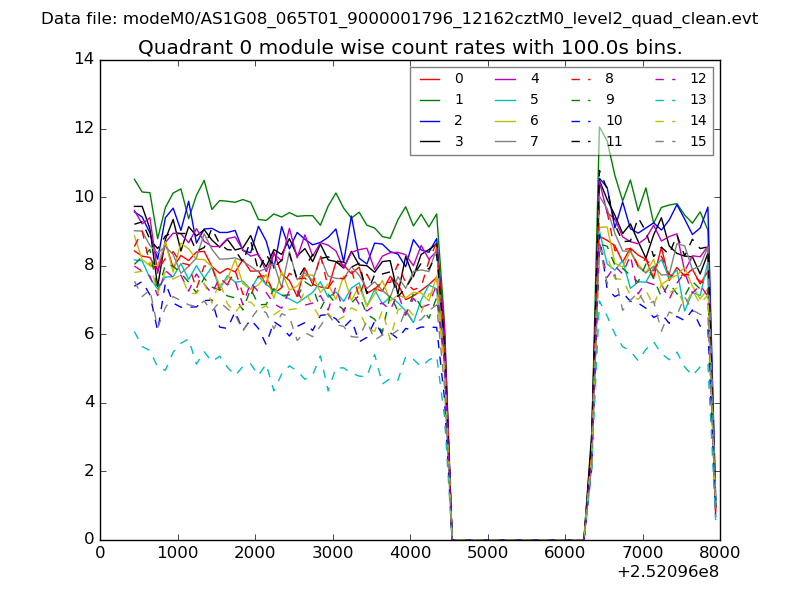
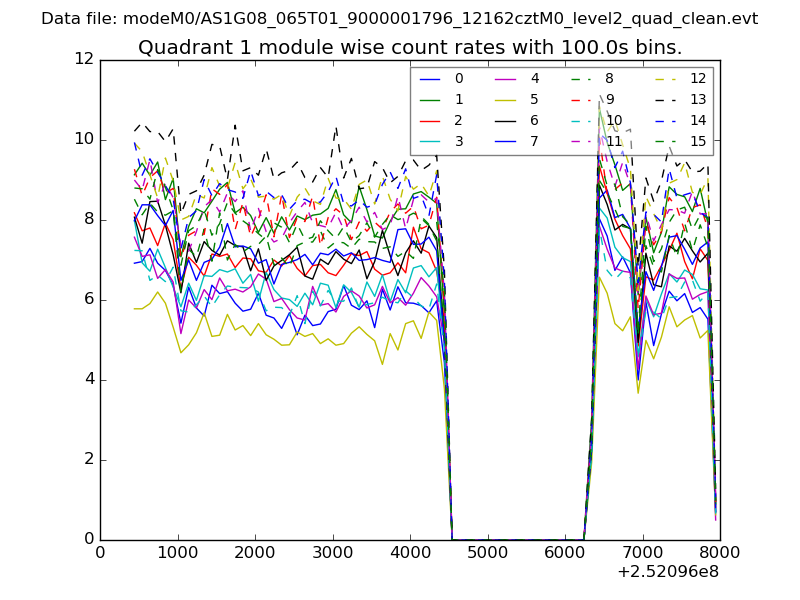
| Module-wise count rates for Quadrant A Data is divided into 100 sec bins |
 |
 |
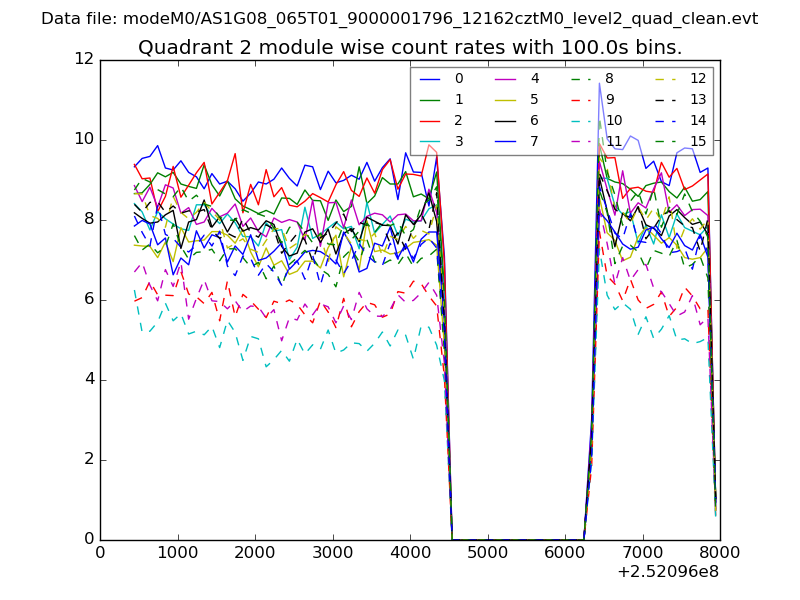
| Module-wise count rates for Quadrant B Data is divided into 100 sec bins |
 |
 |
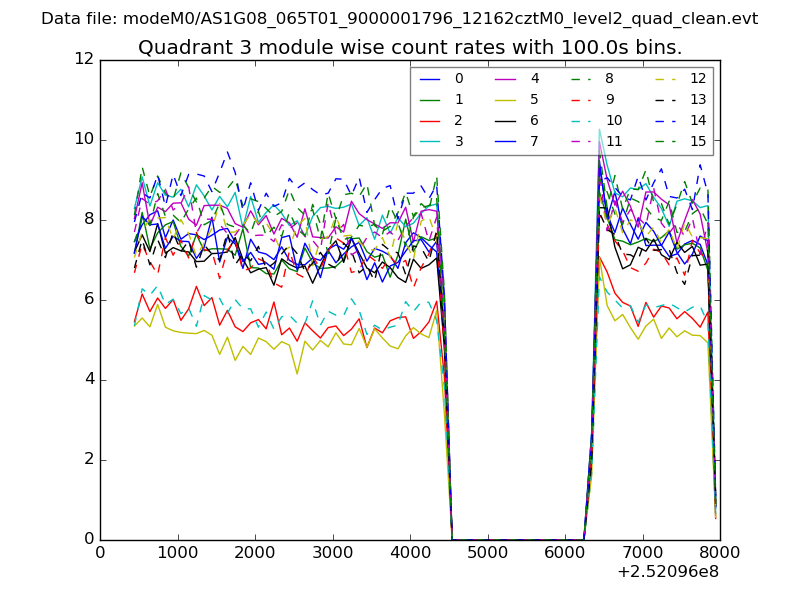
| Module-wise count rates for Quadrant C Data is divided into 100 sec bins |
 |
 |
| Module-wise count rates for Quadrant D Data is divided into 100 sec bins |
 |
 |
| Parameter | Plot |
|---|---|
| CZT HV Monitor | 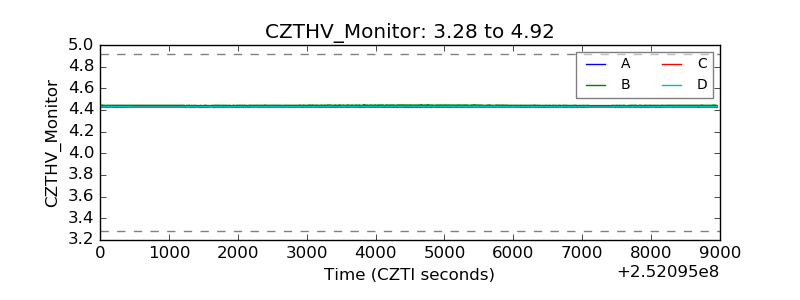 |
| D_VDD | 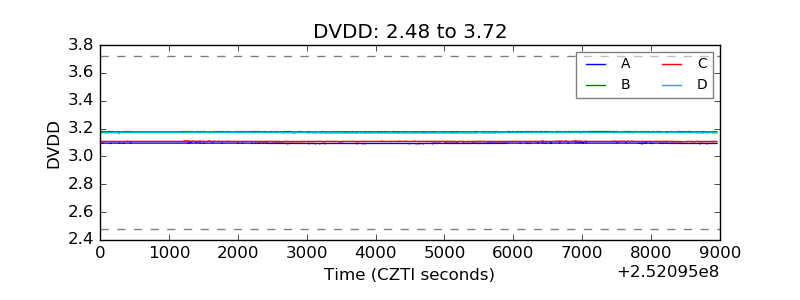 |
| Temperature 1 | 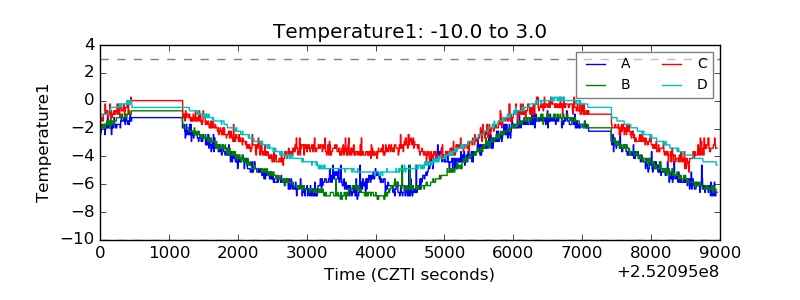 |
| Veto HV Monitor | 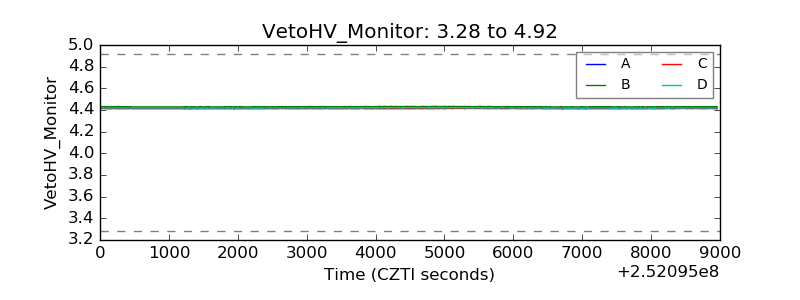 |
| Veto LLD | 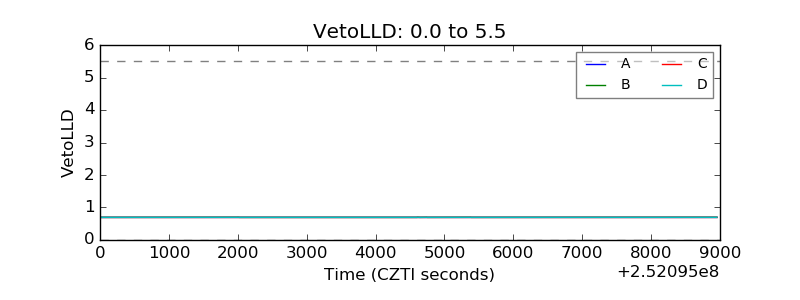 |
| Alpha Counter | 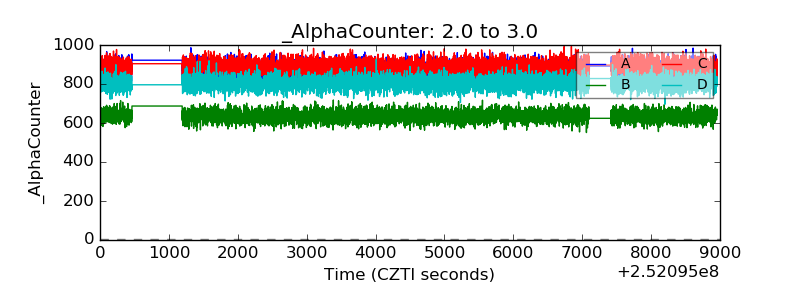 |
| _CPM_Rate | 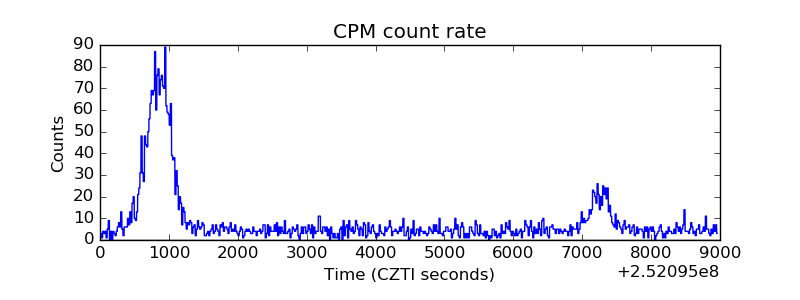 |
| CZT Counter | 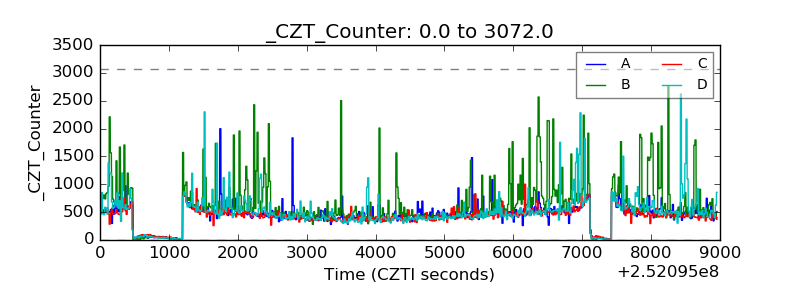 |
| +2.5 Volts monitor |  |
| +5 Volts monitor |  |
| _ROLL_ROT | 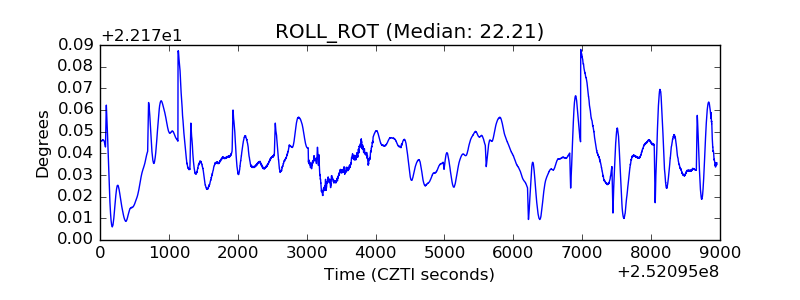 |
| _Roll_DEC | 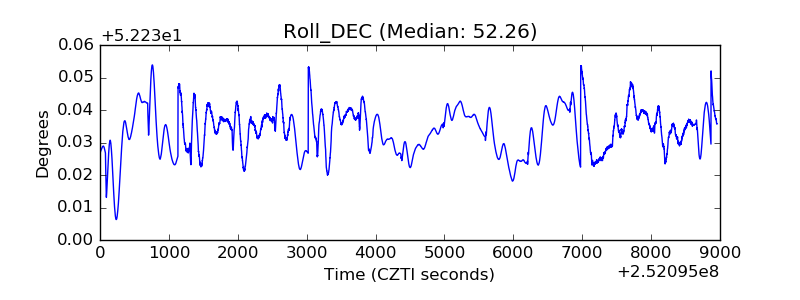 |
| _Roll_RA | 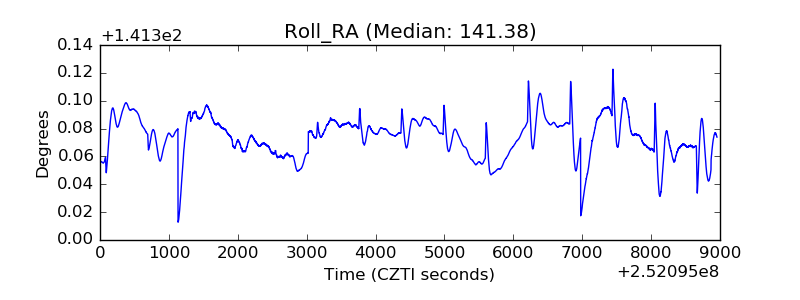 |
| Veto Counter | 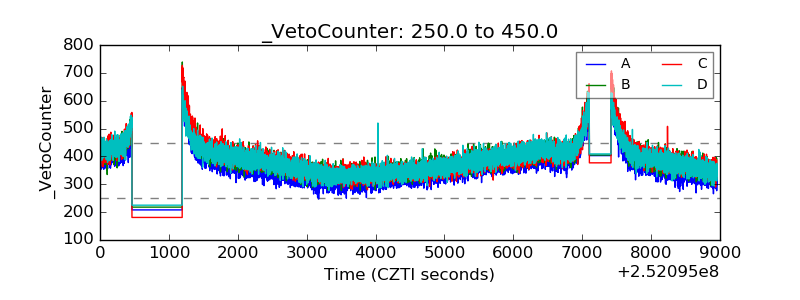 |