| Param | Original file | Final file |
|---|---|---|
| Filename | modeM0/AS1G08_065T01_9000001796_12163cztM0_level2.evt | modeM0/AS1G08_065T01_9000001796_12163cztM0_level2_quad_clean.evt |
| Size (bytes) | 651,954,240 | 113,483,520 |
| Size | 621.8 MB | 108.2 MB |
| Events in quadrant A | 4,091,754 | 737,969 |
| Events in quadrant B | 6,211,716 | 707,198 |
| Events in quadrant C | 3,772,212 | 728,307 |
| Events in quadrant D | 5,118,128 | 698,409 |
| Mode M0 | |||
|---|---|---|---|
| Quadrant | BADHDUFLAG | Total packets | Discarded packets |
| A | 0 | 17720 | 3 |
| B | 0 | 23985 | 2 |
| C | 0 | 17053 | 2 |
| D | 0 | 21046 | 2 |
| Mode M9 | |||
|---|---|---|---|
| Quadrant | BADHDUFLAG | Total packets | Discarded packets |
| A | 0 | 5 | 0 |
| B | 0 | 5 | 0 |
| C | 0 | 5 | 0 |
| D | 0 | 5 | 0 |
| Mode SS | |||
|---|---|---|---|
| Quadrant | BADHDUFLAG | Total packets | Discarded packets |
| A | 0 | 166 | 0 |
| B | 0 | 166 | 0 |
| C | 0 | 166 | 0 |
| D | 0 | 166 | 0 |
| Quadrant | Total seconds | Saturated seconds | Saturation percentage |
|---|---|---|---|
| A | 8127 | 116 | 1.427341% |
| B | 8127 | 885 | 10.889627% |
| C | 8127 | 69 | 0.849022% |
| D | 8127 | 270 | 3.322259% |
Noise dominated data is calculated using 1-second bins in cleaned event files. If a bin has >2000 counts, and if more than 50% of those come from <1% of pixels, then it is considered to be noise-dominated and hence unusable.
| Quadrant | # 1 sec bins | Bins with >0 counts | Bins with >2000 counts | High rate bins dominated by noise | Noise dominated (total time) | Noise dominated (detector-on time) | Marked lightcurve |
|---|---|---|---|---|---|---|---|
| A | 8573 | 8130 | 4 | 4 | 0.05% | 0.05% | 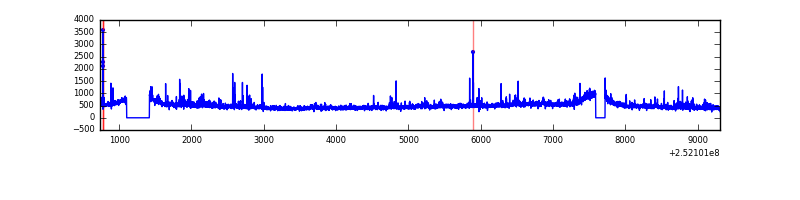 |
| B | 8573 | 8130 | 427 | 427 | 4.98% | 5.25% | 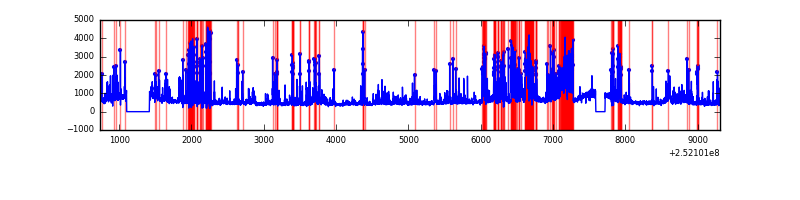 |
| C | 8573 | 8130 | 3 | 3 | 0.03% | 0.04% | 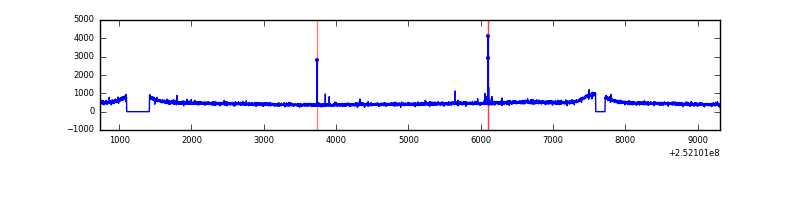 |
| D | 8573 | 8130 | 125 | 125 | 1.46% | 1.54% | 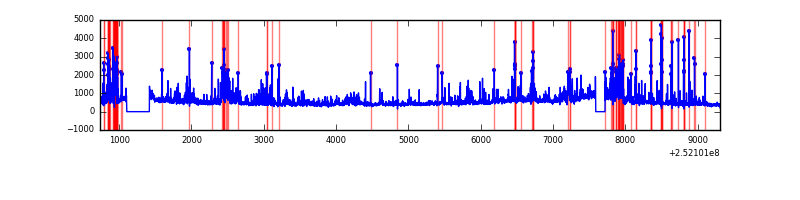 |
Top three noisy pixels from each quadrant. If the there are fewer than three noisy pixels in the level2.evt file, extra rows are filled as -1
| Pixel properties | Quadrant properties | ||||||
|---|---|---|---|---|---|---|---|
| Quadrant | DetID | PixID | Counts | Sigma | Mean | Median | Sigma |
| A | 8 | 15 | 101492 | 503.54 | 980 | 958 | 199.7 |
| A | 1 | 162 | 70120 | 346.41 | 980 | 958 | 199.7 |
| A | 1 | 178 | 31021 | 150.58 | 980 | 958 | 199.7 |
| B | 4 | 239 | 1467632 | 8080.17 | 939 | 914 | 181.5 |
| B | 0 | 85 | 524898 | 2886.63 | 939 | 914 | 181.5 |
| B | 15 | 204 | 132296 | 723.78 | 939 | 914 | 181.5 |
| C | 15 | 208 | 29931 | 130.06 | 957 | 960 | 222.8 |
| C | 13 | 61 | 7056 | 27.37 | 957 | 960 | 222.8 |
| C | 13 | 250 | 5706 | 21.31 | 957 | 960 | 222.8 |
| D | 1 | 52 | 921060 | 4018.69 | 942 | 913 | 229.0 |
| D | 13 | 249 | 191956 | 834.37 | 942 | 913 | 229.0 |
| D | 10 | 199 | 138391 | 600.43 | 942 | 913 | 229.0 |
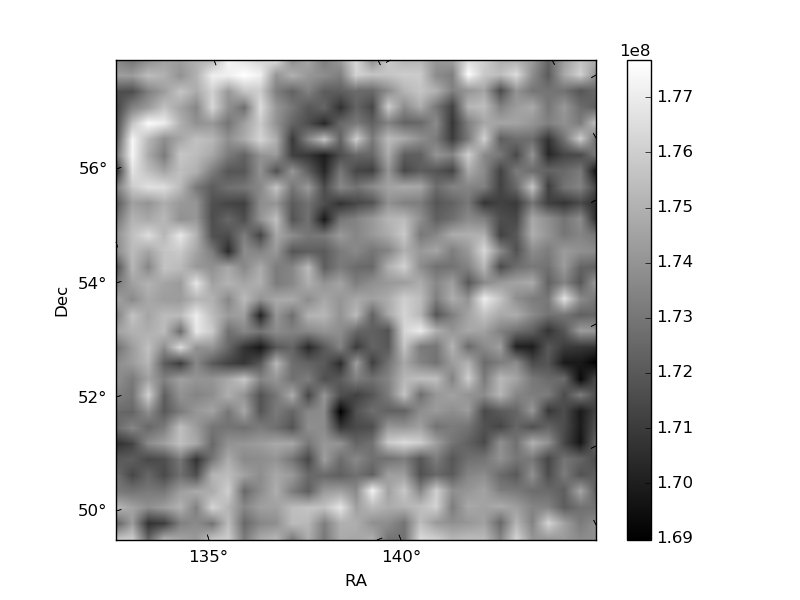
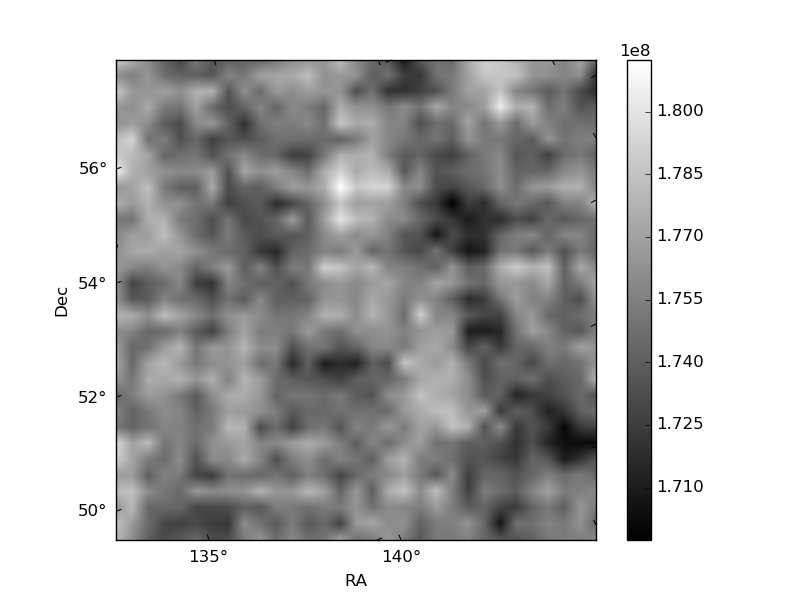
Histogram calculated using DETX and DETY for each event in the final _common_clean file
| Quadrant A |  |
 |
Quadrant B |
|---|---|---|---|
| Quadrant D | 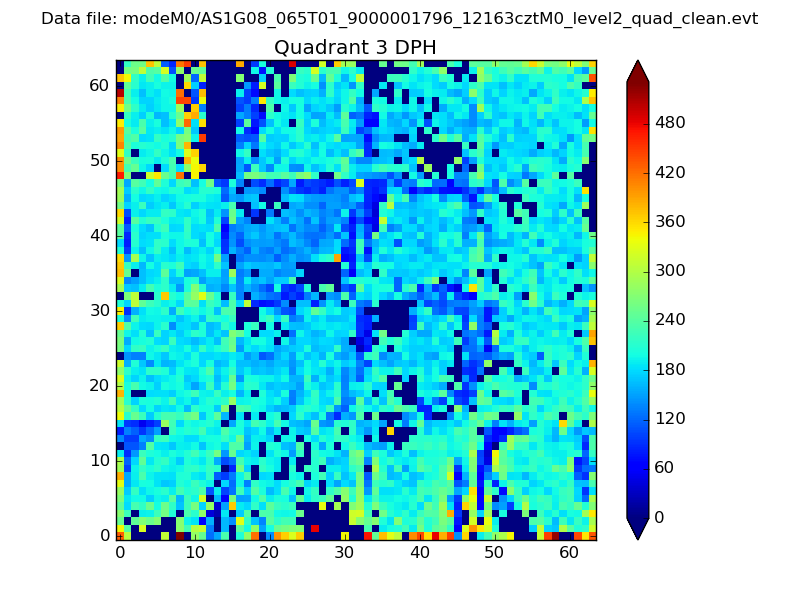 |
 |
Quadrant C |
| Plot type | Count rate plots | Images |
|---|---|---|
| Comparison with Poisson distribution Blue bars denote a histogram of data divided into 1 sec bins. Red curve is a Poisson curve with rate = median count rate of data. |
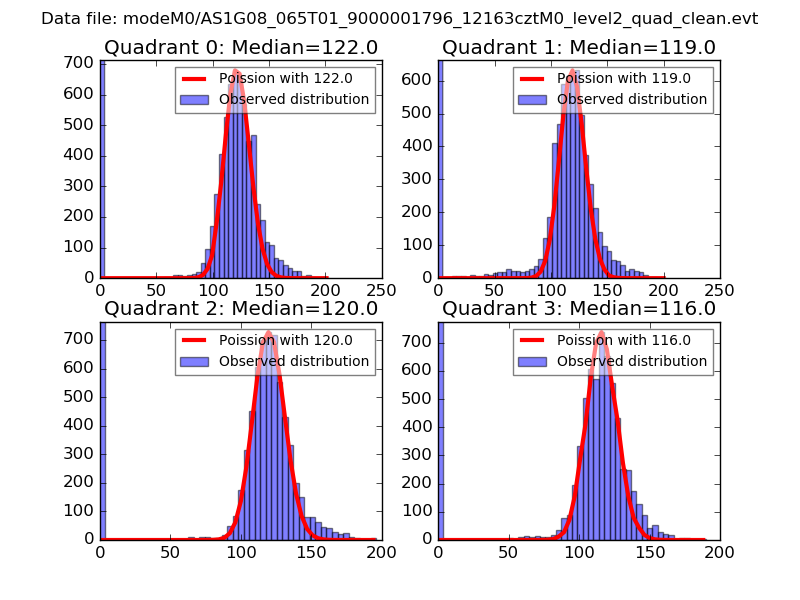 |
 |
| Quadrant-wise count rates Data is divided into 100 sec bins |
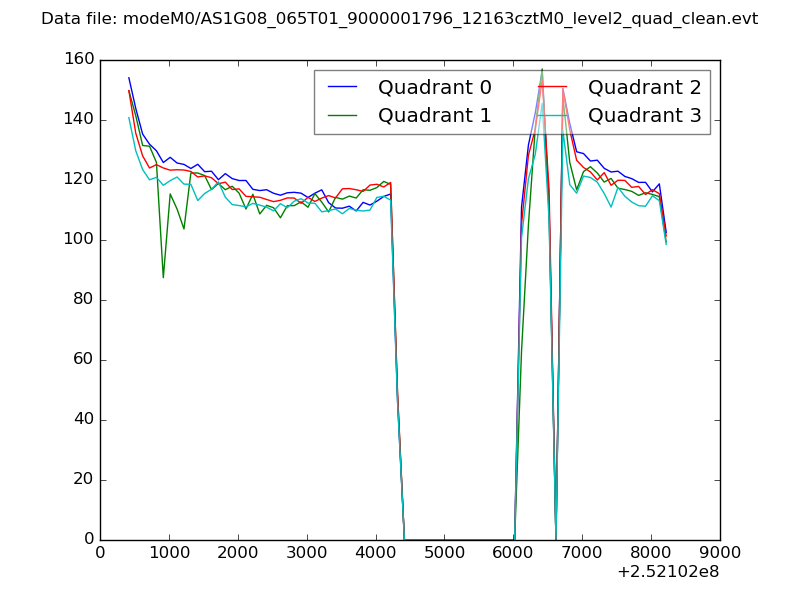 |
|
| Module-wise count rates for Quadrant A Data is divided into 100 sec bins |
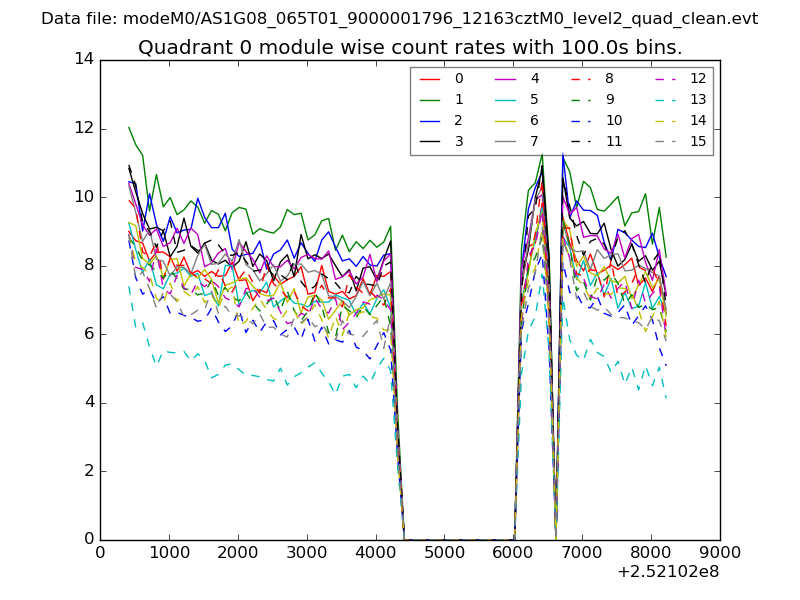 |
 |
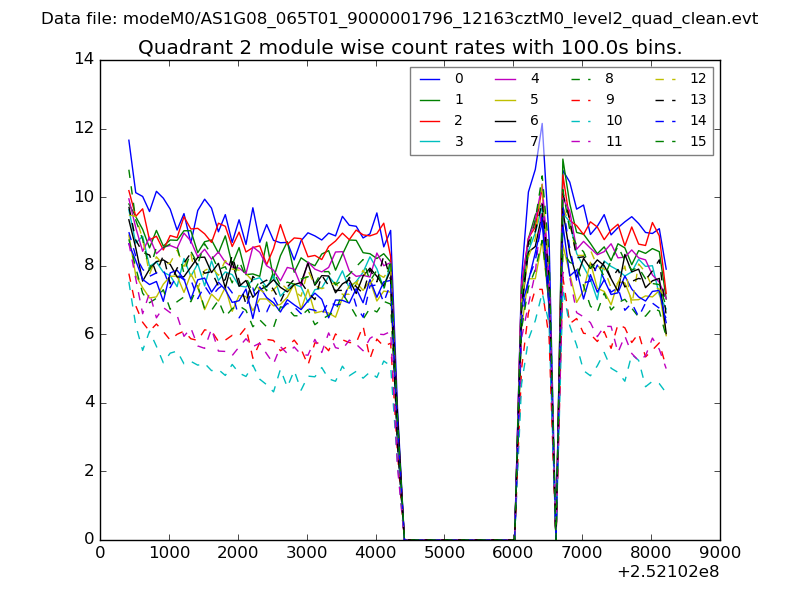
| Module-wise count rates for Quadrant B Data is divided into 100 sec bins |
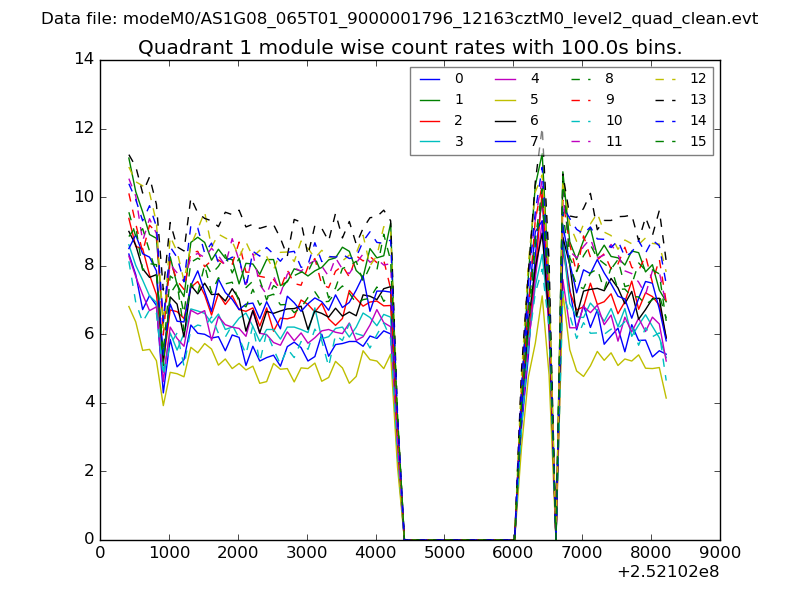 |
 |
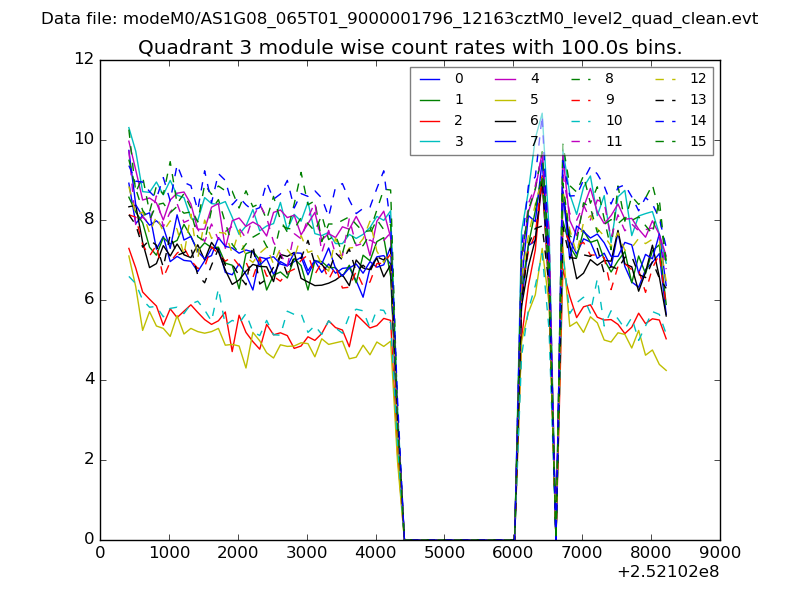
| Module-wise count rates for Quadrant C Data is divided into 100 sec bins |
 |
 |
| Module-wise count rates for Quadrant D Data is divided into 100 sec bins |
 |
 |
| Parameter | Plot |
|---|---|
| CZT HV Monitor |  |
| D_VDD | 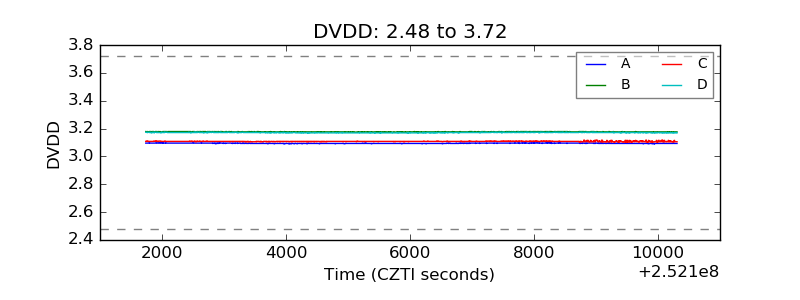 |
| Temperature 1 | 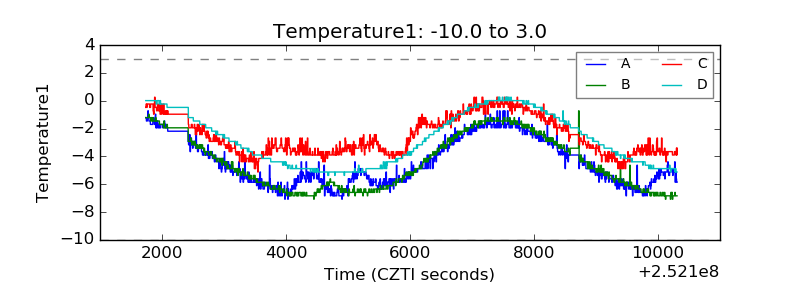 |
| Veto HV Monitor | 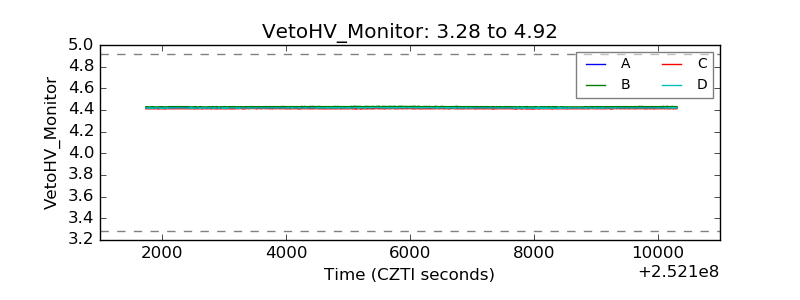 |
| Veto LLD | 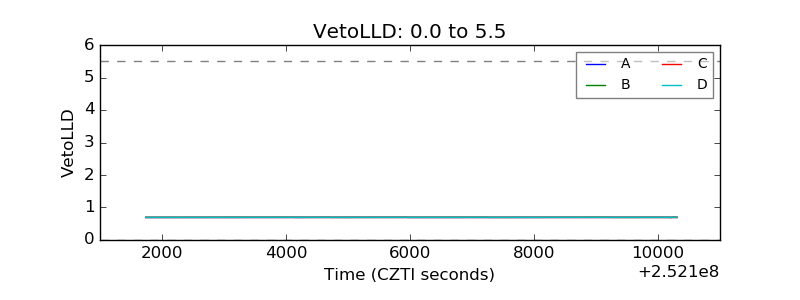 |
| Alpha Counter |  |
| _CPM_Rate | 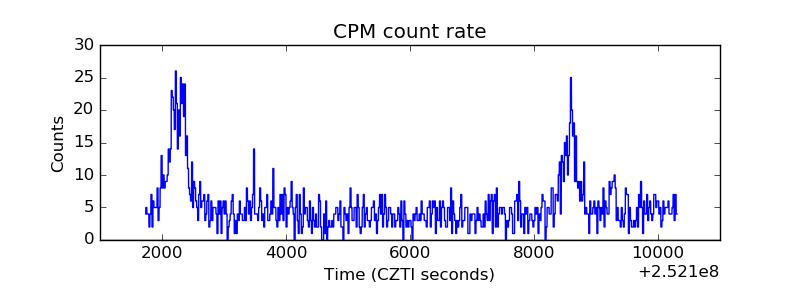 |
| CZT Counter | 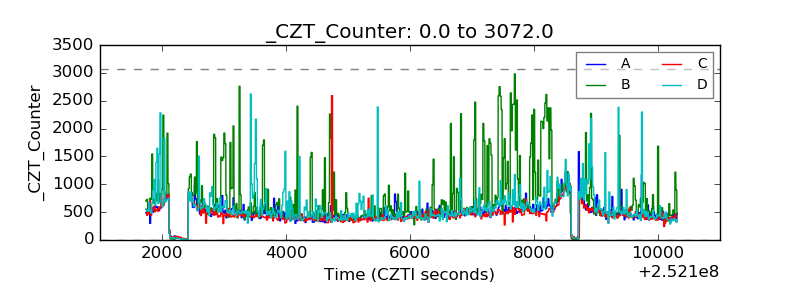 |
| +2.5 Volts monitor |  |
| +5 Volts monitor |  |
| _ROLL_ROT | 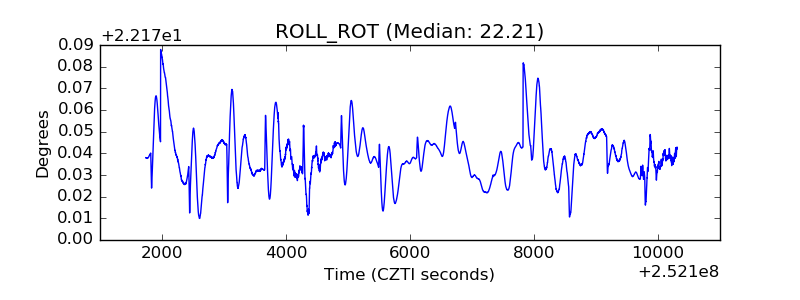 |
| _Roll_DEC | 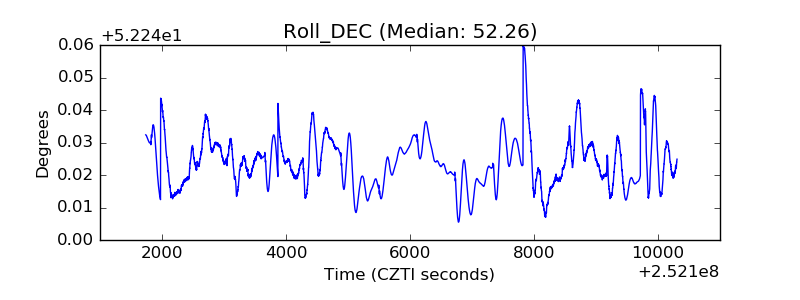 |
| _Roll_RA | 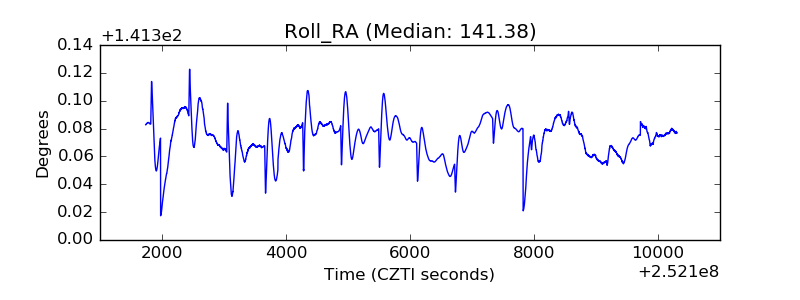 |
| Veto Counter | 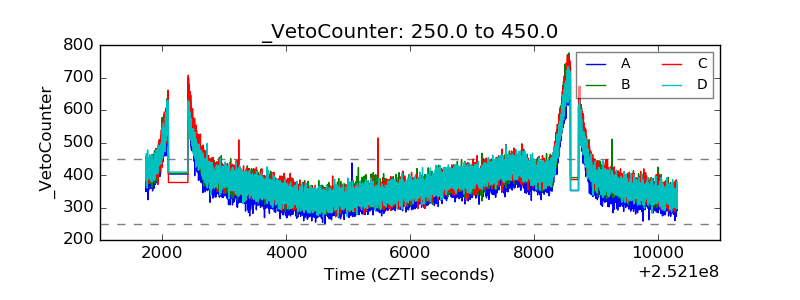 |