| Param | Original file | Final file |
|---|---|---|
| Filename | modeM0/AS1G08_065T01_9000001796_12164cztM0_level2.evt | modeM0/AS1G08_065T01_9000001796_12164cztM0_level2_quad_clean.evt |
| Size (bytes) | 695,790,720 | 117,907,200 |
| Size | 663.6 MB | 112.4 MB |
| Events in quadrant A | 4,150,949 | 774,441 |
| Events in quadrant B | 5,993,549 | 745,311 |
| Events in quadrant C | 4,274,695 | 758,031 |
| Events in quadrant D | 6,098,550 | 723,908 |
| Mode M0 | |||
|---|---|---|---|
| Quadrant | BADHDUFLAG | Total packets | Discarded packets |
| A | 0 | 17915 | 3 |
| B | 0 | 23489 | 2 |
| C | 0 | 18568 | 2 |
| D | 0 | 24083 | 2 |
| Mode M9 | |||
|---|---|---|---|
| Quadrant | BADHDUFLAG | Total packets | Discarded packets |
| A | 0 | 6 | 0 |
| B | 0 | 6 | 0 |
| C | 0 | 6 | 0 |
| D | 0 | 6 | 0 |
| Mode SS | |||
|---|---|---|---|
| Quadrant | BADHDUFLAG | Total packets | Discarded packets |
| A | 0 | 164 | 0 |
| B | 0 | 164 | 0 |
| C | 0 | 164 | 0 |
| D | 0 | 164 | 0 |
| Quadrant | Total seconds | Saturated seconds | Saturation percentage |
|---|---|---|---|
| A | 8198 | 124 | 1.512564% |
| B | 8198 | 689 | 8.404489% |
| C | 8198 | 170 | 2.073677% |
| D | 8198 | 781 | 9.526714% |
Noise dominated data is calculated using 1-second bins in cleaned event files. If a bin has >2000 counts, and if more than 50% of those come from <1% of pixels, then it is considered to be noise-dominated and hence unusable.
| Quadrant | # 1 sec bins | Bins with >0 counts | Bins with >2000 counts | High rate bins dominated by noise | Noise dominated (total time) | Noise dominated (detector-on time) | Marked lightcurve |
|---|---|---|---|---|---|---|---|
| A | 8659 | 8201 | 2 | 2 | 0.02% | 0.02% | 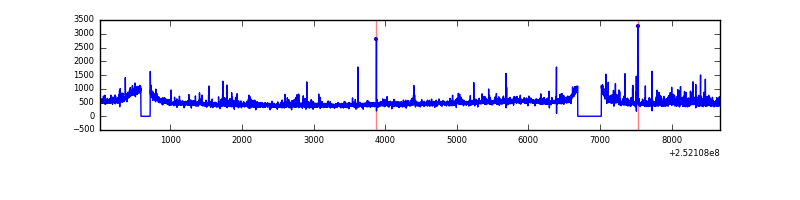 |
| B | 8659 | 8201 | 322 | 322 | 3.72% | 3.93% |  |
| C | 8659 | 8201 | 57 | 57 | 0.66% | 0.70% | 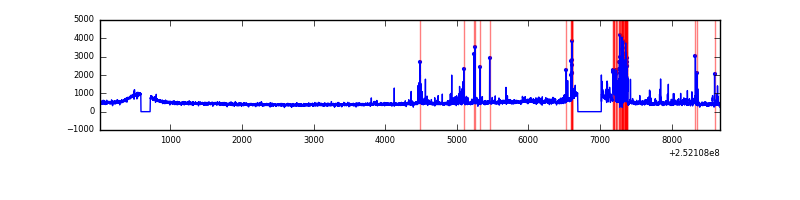 |
| D | 8659 | 8201 | 488 | 488 | 5.64% | 5.95% | 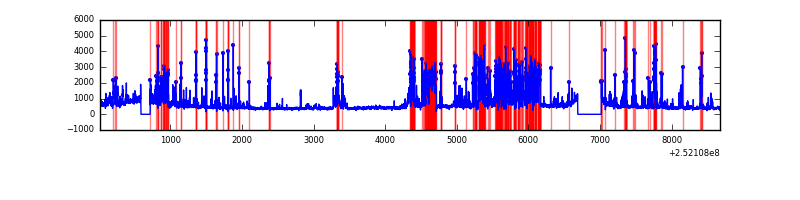 |
Top three noisy pixels from each quadrant. If the there are fewer than three noisy pixels in the level2.evt file, extra rows are filled as -1
| Pixel properties | Quadrant properties | ||||||
|---|---|---|---|---|---|---|---|
| Quadrant | DetID | PixID | Counts | Sigma | Mean | Median | Sigma |
| A | 8 | 15 | 107486 | 530.85 | 978 | 954 | 200.7 |
| A | 1 | 162 | 101331 | 500.18 | 978 | 954 | 200.7 |
| A | 1 | 178 | 54964 | 269.13 | 978 | 954 | 200.7 |
| B | 4 | 239 | 1042987 | 5674.11 | 958 | 931 | 183.7 |
| B | 0 | 85 | 643373 | 3498.17 | 958 | 931 | 183.7 |
| B | 10 | 16 | 223210 | 1210.33 | 958 | 931 | 183.7 |
| C | 15 | 208 | 461894 | 2074.96 | 952 | 956 | 222.1 |
| C | 3 | 233 | 60246 | 266.9 | 952 | 956 | 222.1 |
| C | 14 | 234 | 24756 | 107.14 | 952 | 956 | 222.1 |
| D | 4 | 95 | 887588 | 4012.32 | 910 | 882 | 221.0 |
| D | 1 | 52 | 630525 | 2849.12 | 910 | 882 | 221.0 |
| D | 13 | 61 | 182089 | 819.96 | 910 | 882 | 221.0 |
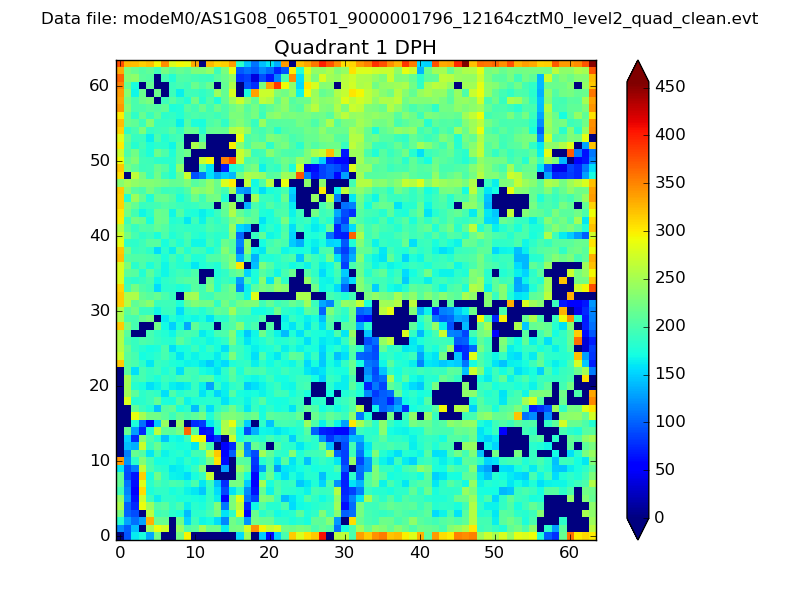
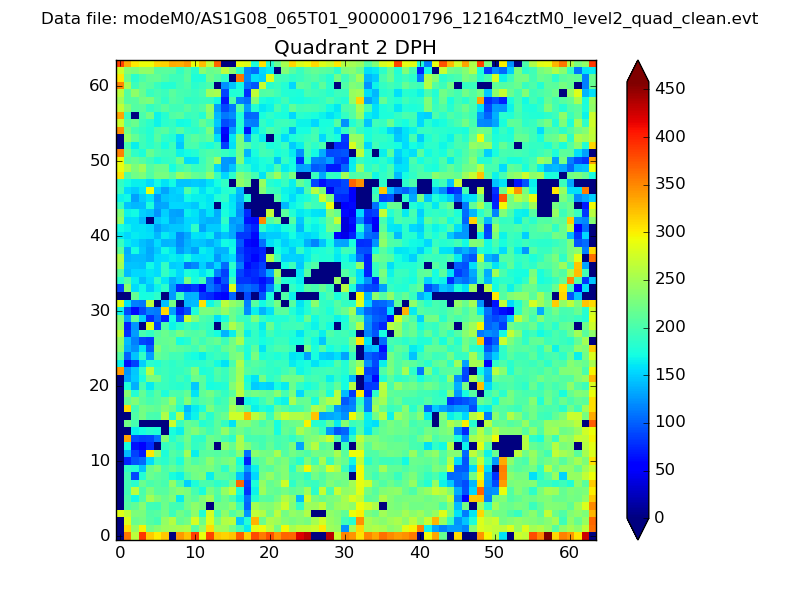
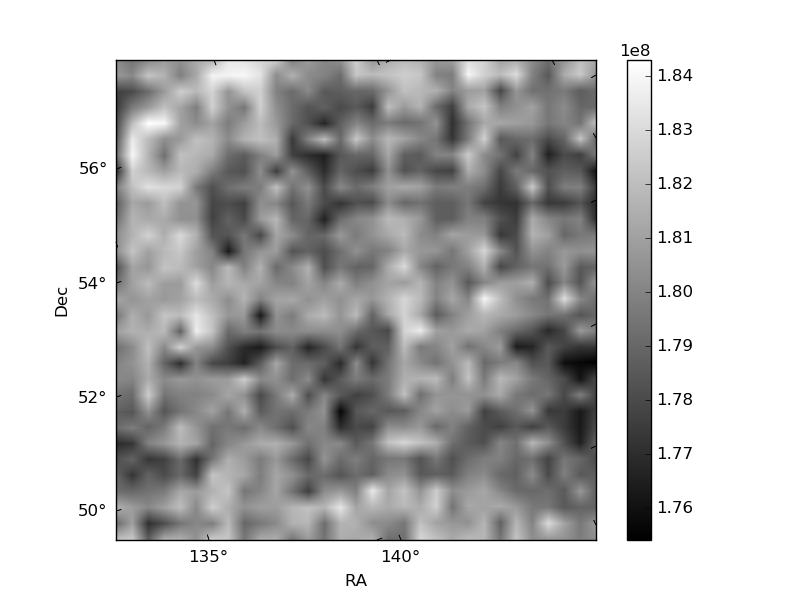
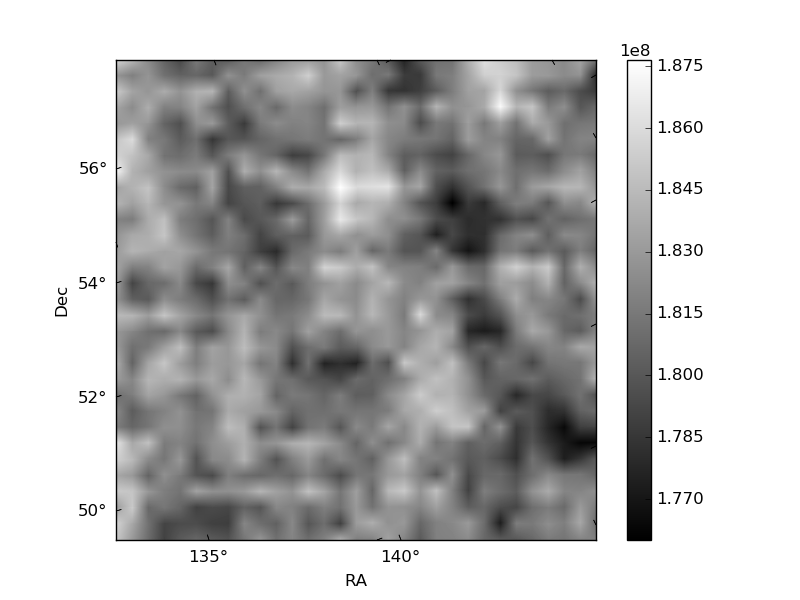
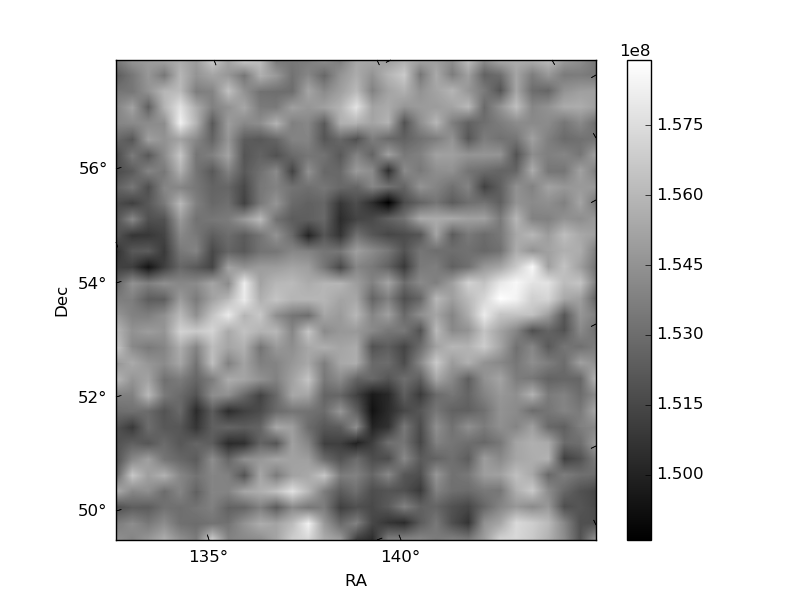
Histogram calculated using DETX and DETY for each event in the final _common_clean file
| Quadrant A | 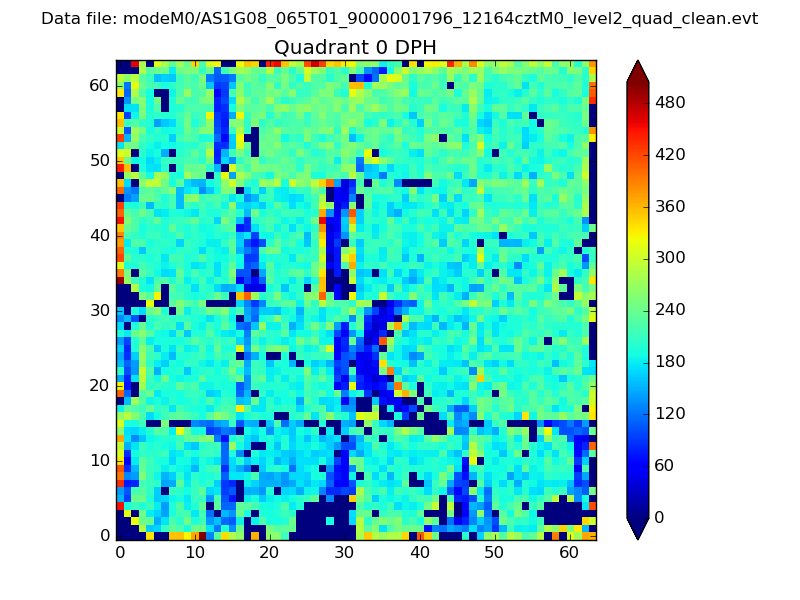 |
 |
Quadrant B |
|---|---|---|---|
| Quadrant D | 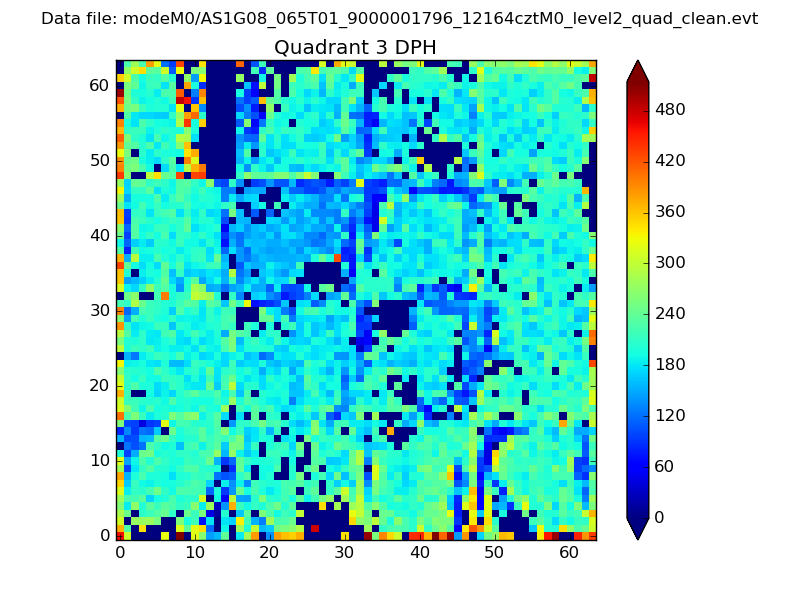 |
 |
Quadrant C |
| Plot type | Count rate plots | Images |
|---|---|---|
| Comparison with Poisson distribution Blue bars denote a histogram of data divided into 1 sec bins. Red curve is a Poisson curve with rate = median count rate of data. |
 |
 |
| Quadrant-wise count rates Data is divided into 100 sec bins |
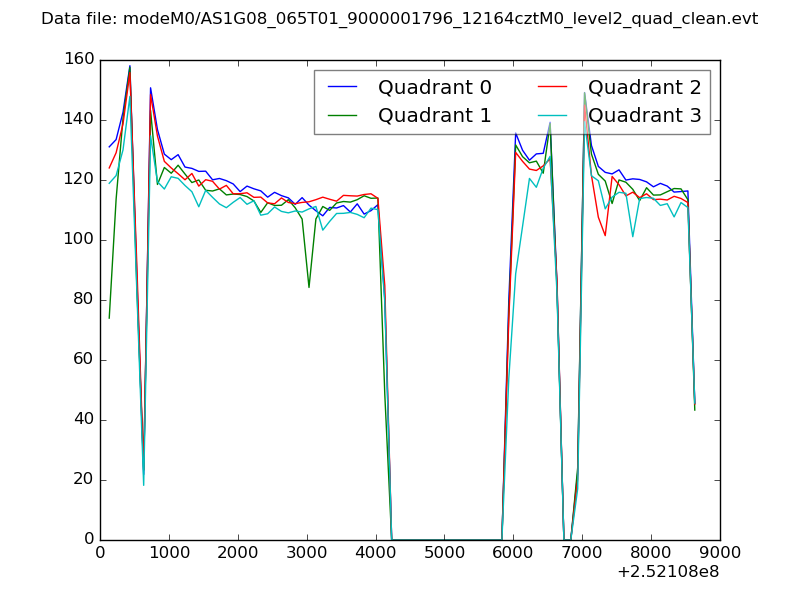 |
|
| Module-wise count rates for Quadrant A Data is divided into 100 sec bins |
 |
 |
| Module-wise count rates for Quadrant B Data is divided into 100 sec bins |
 |
 |
| Module-wise count rates for Quadrant C Data is divided into 100 sec bins |
 |
 |
| Module-wise count rates for Quadrant D Data is divided into 100 sec bins |
 |
 |
| Parameter | Plot |
|---|---|
| CZT HV Monitor |  |
| D_VDD | 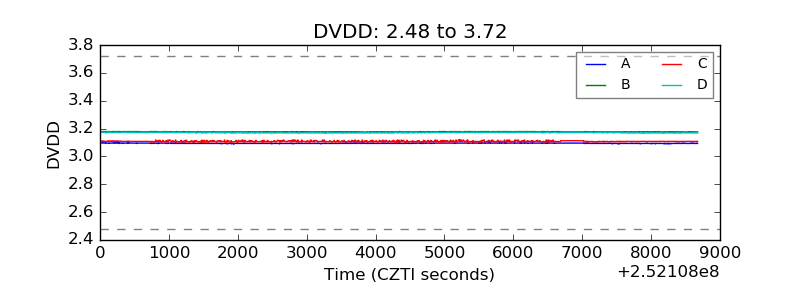 |
| Temperature 1 | 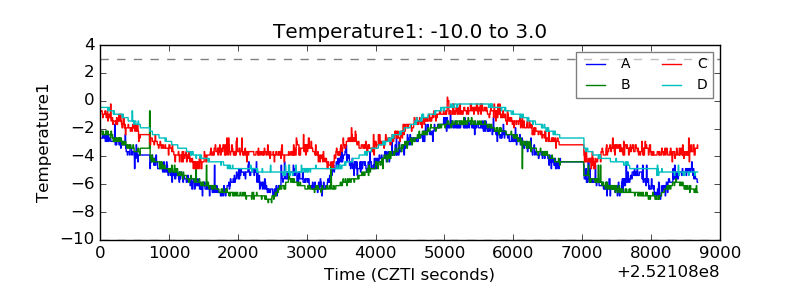 |
| Veto HV Monitor | 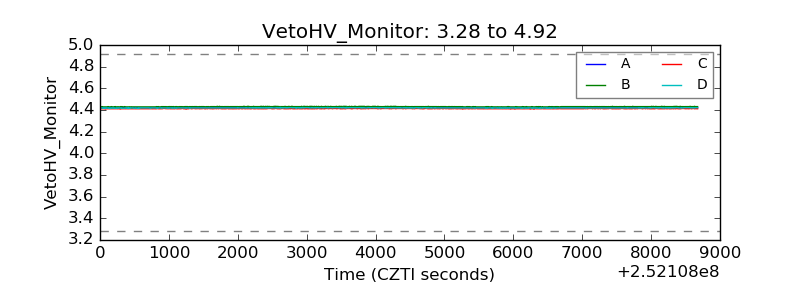 |
| Veto LLD | 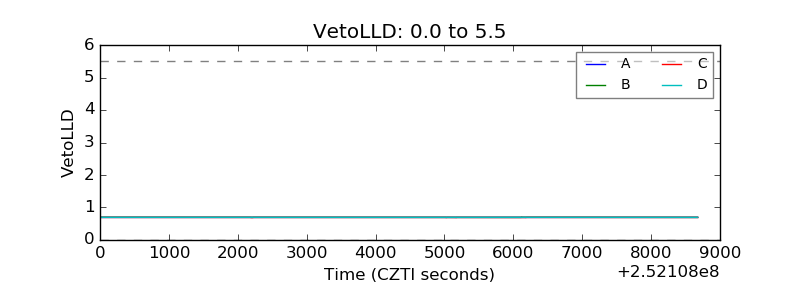 |
| Alpha Counter | 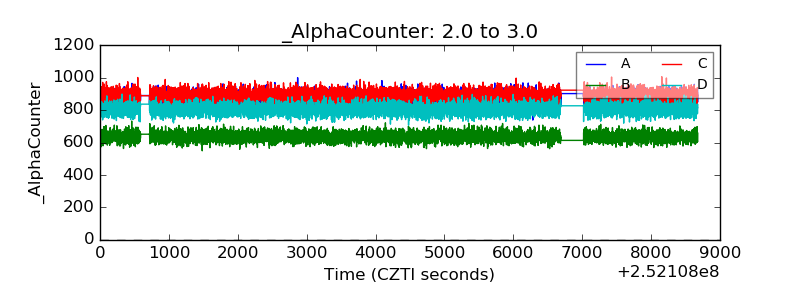 |
| _CPM_Rate | 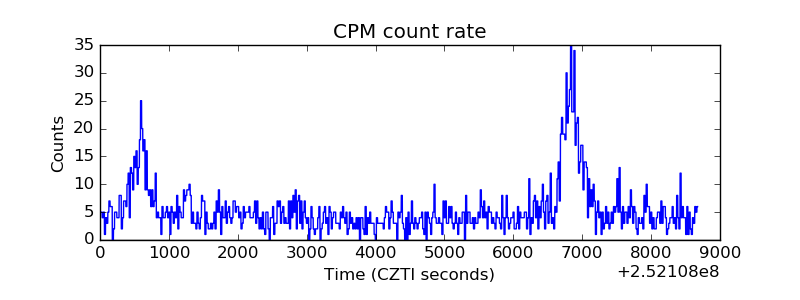 |
| CZT Counter | 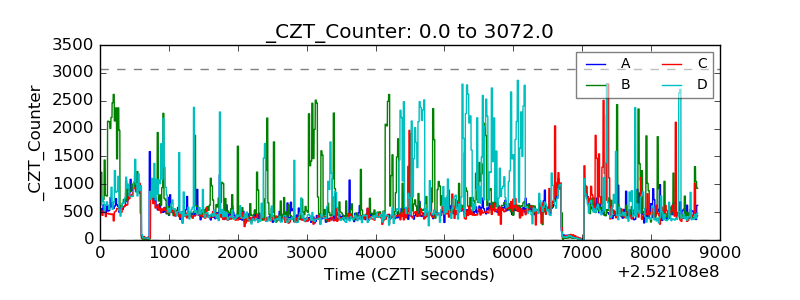 |
| +2.5 Volts monitor | 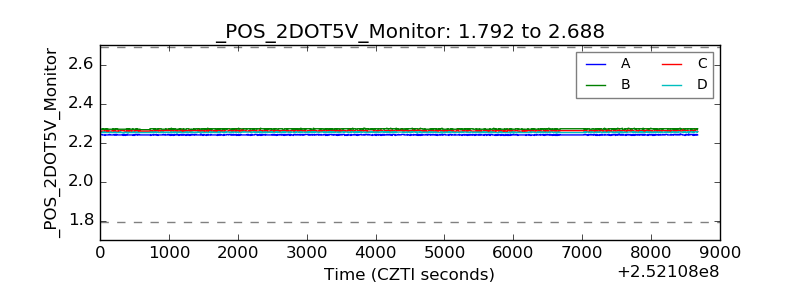 |
| +5 Volts monitor |  |
| _ROLL_ROT | 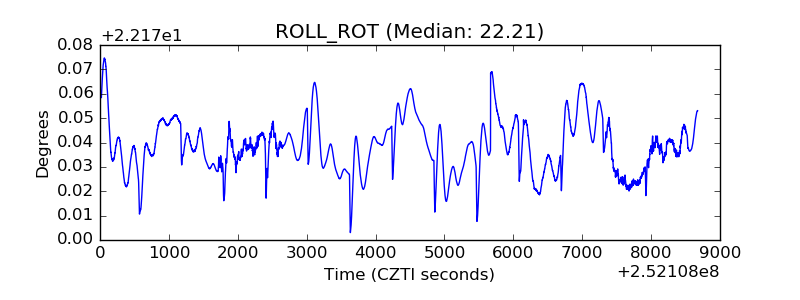 |
| _Roll_DEC | 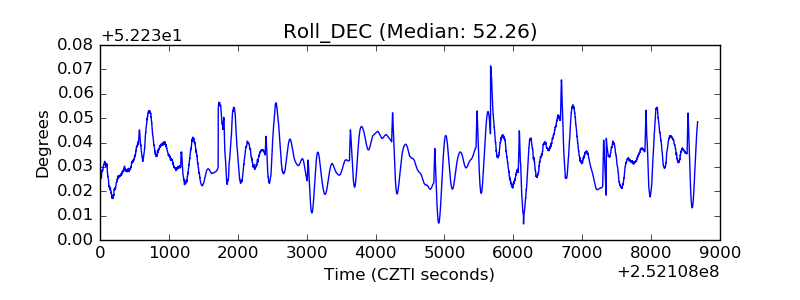 |
| _Roll_RA | 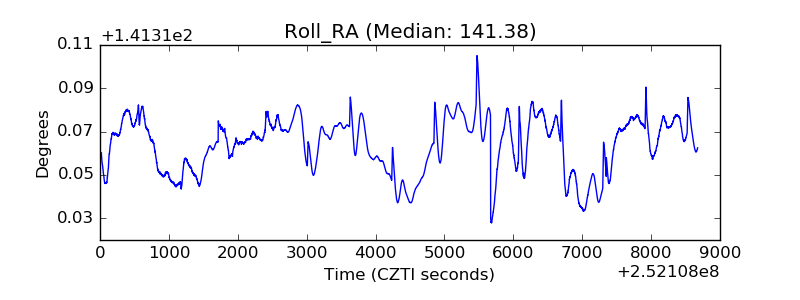 |
| Veto Counter |  |