| Param | Original file | Final file |
|---|---|---|
| Filename | modeM0/AS1G08_065T01_9000001796_12170cztM0_level2.evt | modeM0/AS1G08_065T01_9000001796_12170cztM0_level2_quad_clean.evt |
| Size (bytes) | 469,555,200 | 79,505,280 |
| Size | 447.8 MB | 75.8 MB |
| Events in quadrant A | 3,283,642 | 504,717 |
| Events in quadrant B | 4,027,379 | 499,046 |
| Events in quadrant C | 3,060,994 | 494,362 |
| Events in quadrant D | 3,429,584 | 478,622 |
| Mode M0 | |||
|---|---|---|---|
| Quadrant | BADHDUFLAG | Total packets | Discarded packets |
| A | 0 | 13667 | 2 |
| B | 0 | 15959 | 1 |
| C | 0 | 13207 | 1 |
| D | 0 | 14113 | 1 |
| Mode M9 | |||
|---|---|---|---|
| Quadrant | BADHDUFLAG | Total packets | Discarded packets |
| A | 0 | 12 | 0 |
| B | 0 | 12 | 0 |
| C | 0 | 12 | 0 |
| D | 0 | 12 | 0 |
| Mode SS | |||
|---|---|---|---|
| Quadrant | BADHDUFLAG | Total packets | Discarded packets |
| A | 0 | 124 | 0 |
| B | 0 | 124 | 0 |
| C | 0 | 124 | 0 |
| D | 0 | 124 | 0 |
| Quadrant | Total seconds | Saturated seconds | Saturation percentage |
|---|---|---|---|
| A | 6175 | 78 | 1.263158% |
| B | 6175 | 262 | 4.242915% |
| C | 6175 | 68 | 1.101215% |
| D | 6175 | 106 | 1.716599% |
Noise dominated data is calculated using 1-second bins in cleaned event files. If a bin has >2000 counts, and if more than 50% of those come from <1% of pixels, then it is considered to be noise-dominated and hence unusable.
| Quadrant | # 1 sec bins | Bins with >0 counts | Bins with >2000 counts | High rate bins dominated by noise | Noise dominated (total time) | Noise dominated (detector-on time) | Marked lightcurve |
|---|---|---|---|---|---|---|---|
| A | 7331 | 6176 | 4 | 4 | 0.05% | 0.06% | 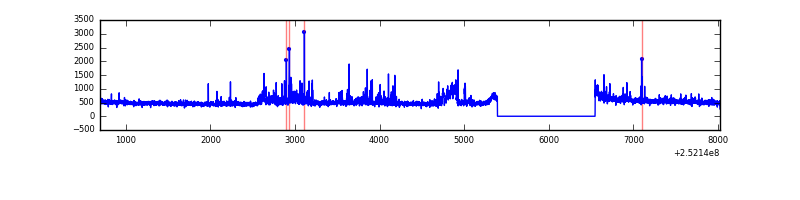 |
| B | 7331 | 6176 | 124 | 124 | 1.69% | 2.01% | 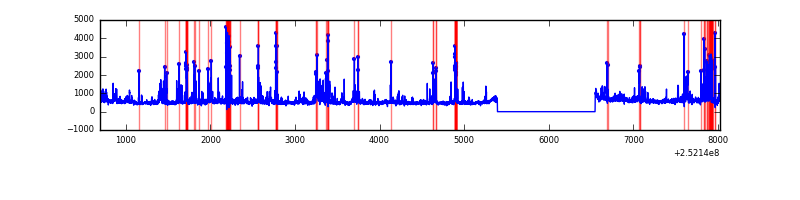 |
| C | 7331 | 6177 | 15 | 15 | 0.20% | 0.24% | 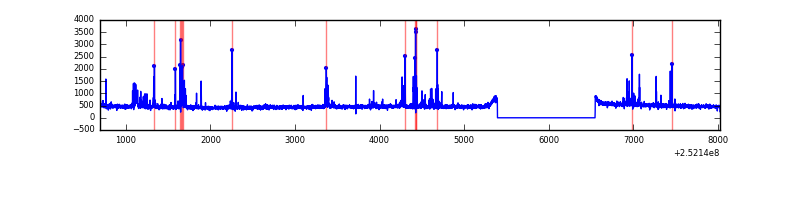 |
| D | 7331 | 6177 | 70 | 70 | 0.95% | 1.13% | 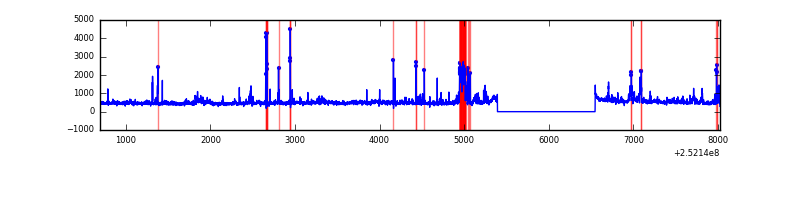 |
Top three noisy pixels from each quadrant. If the there are fewer than three noisy pixels in the level2.evt file, extra rows are filled as -1
| Pixel properties | Quadrant properties | ||||||
|---|---|---|---|---|---|---|---|
| Quadrant | DetID | PixID | Counts | Sigma | Mean | Median | Sigma |
| A | 8 | 15 | 130435 | 835.17 | 763 | 748 | 155.3 |
| A | 13 | 248 | 74102 | 472.39 | 763 | 748 | 155.3 |
| A | 1 | 162 | 40151 | 253.75 | 763 | 748 | 155.3 |
| B | 4 | 239 | 779417 | 5539.98 | 743 | 725 | 140.6 |
| B | 11 | 51 | 125419 | 887.13 | 743 | 725 | 140.6 |
| B | 0 | 214 | 107768 | 761.55 | 743 | 725 | 140.6 |
| C | 15 | 208 | 212758 | 1270.35 | 725 | 728 | 166.9 |
| C | 14 | 234 | 15109 | 86.16 | 725 | 728 | 166.9 |
| C | 13 | 61 | 5415 | 28.08 | 725 | 728 | 166.9 |
| D | 1 | 52 | 353191 | 2053.45 | 731 | 713 | 171.7 |
| D | 2 | 33 | 56375 | 324.27 | 731 | 713 | 171.7 |
| D | 8 | 195 | 54119 | 311.13 | 731 | 713 | 171.7 |
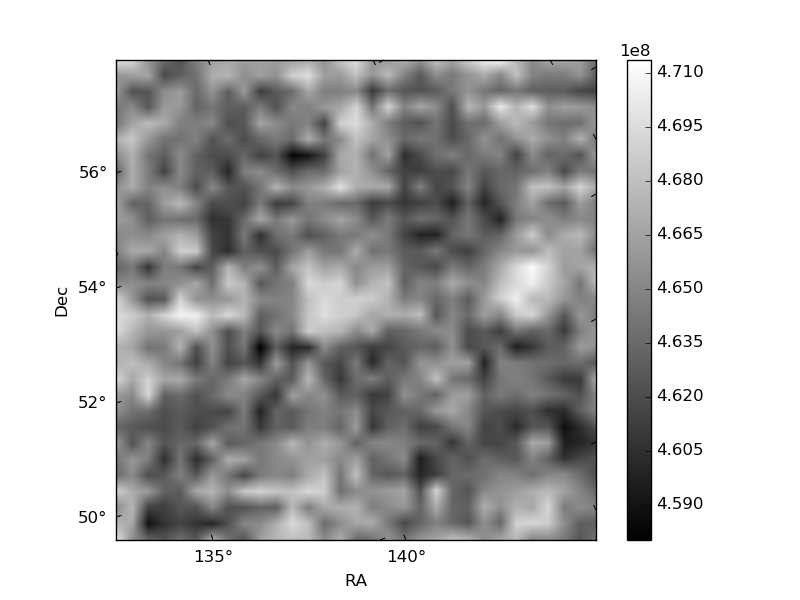
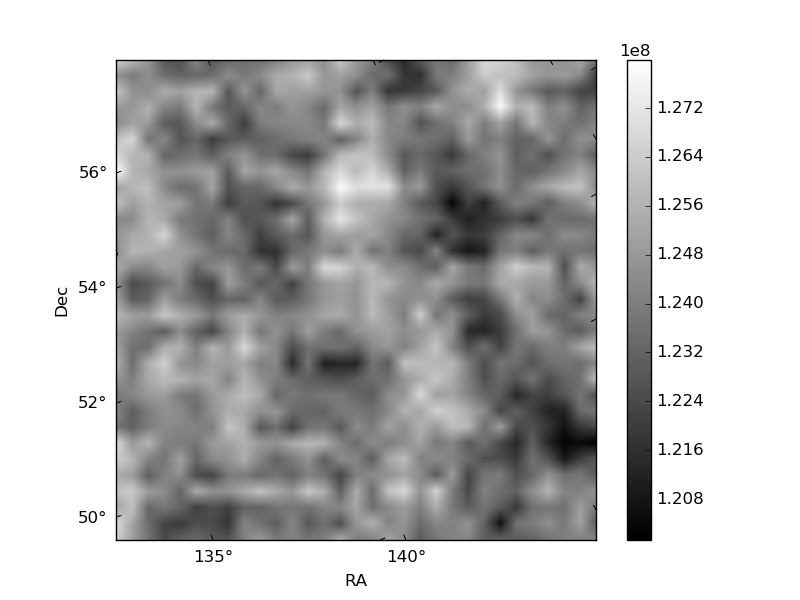
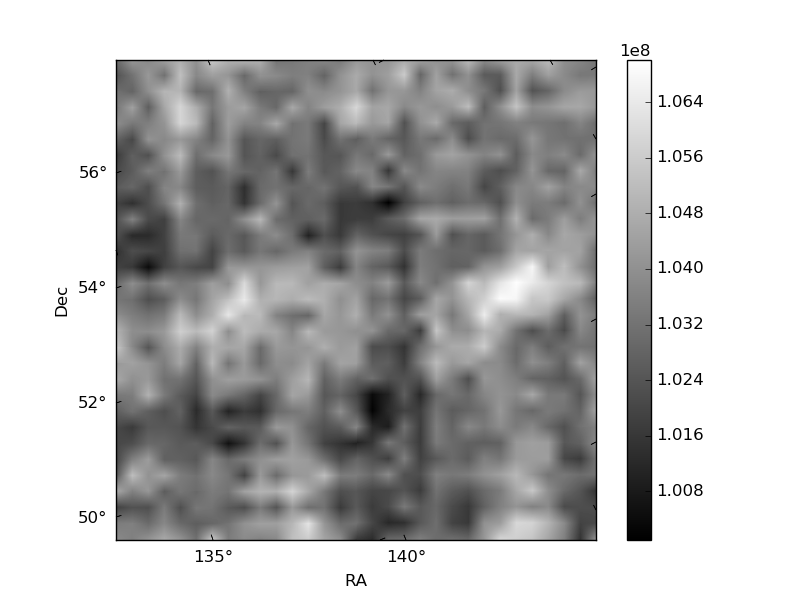
Histogram calculated using DETX and DETY for each event in the final _common_clean file
| Quadrant A | 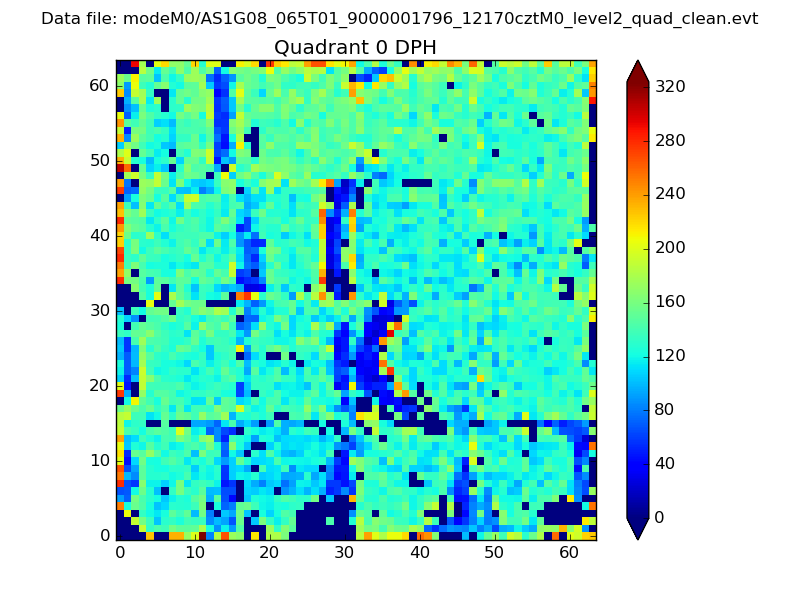 |
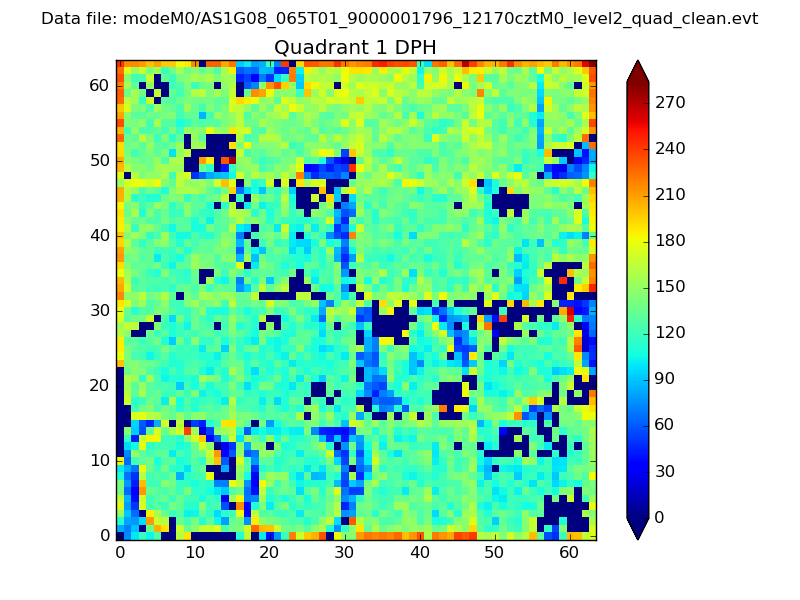 |
Quadrant B |
|---|---|---|---|
| Quadrant D | 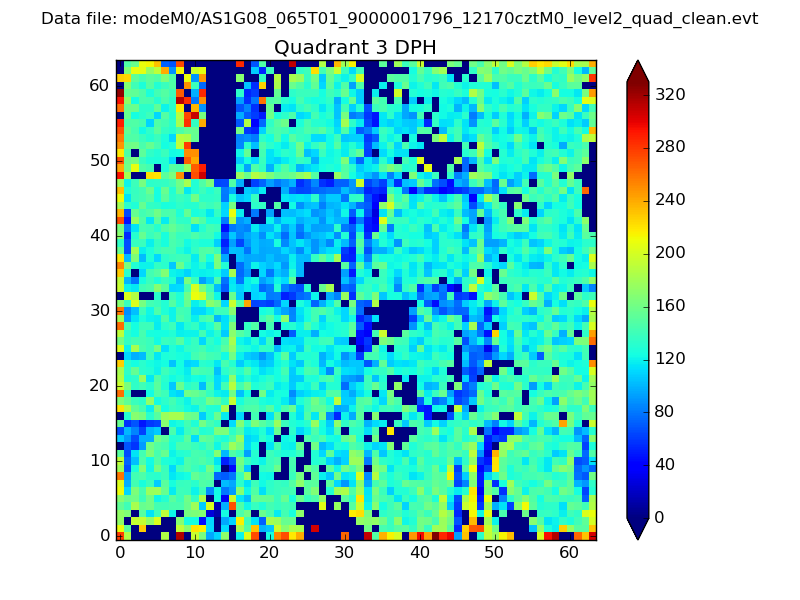 |
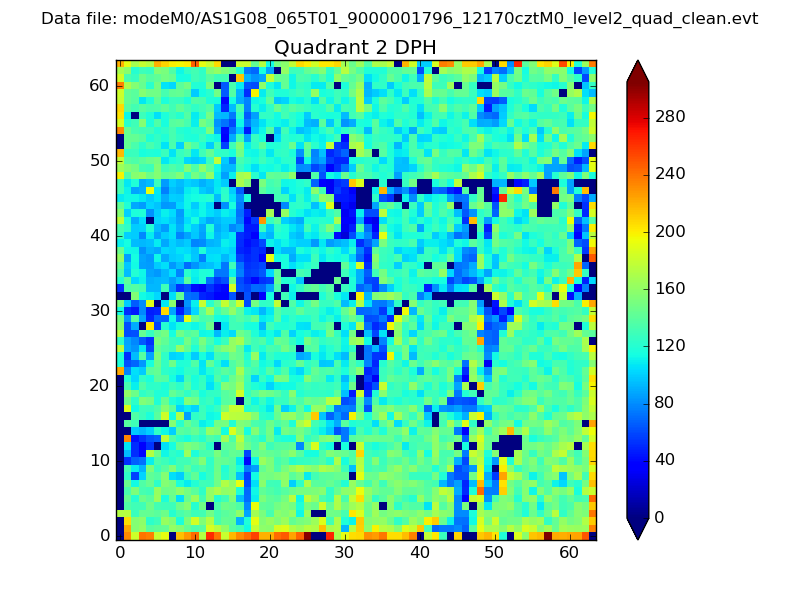 |
Quadrant C |
| Plot type | Count rate plots | Images |
|---|---|---|
| Comparison with Poisson distribution Blue bars denote a histogram of data divided into 1 sec bins. Red curve is a Poisson curve with rate = median count rate of data. |
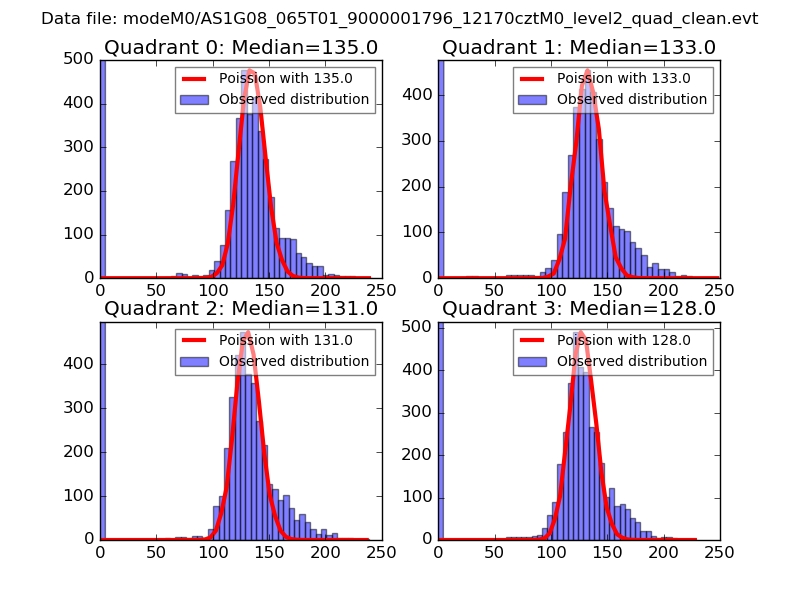 |
 |
| Quadrant-wise count rates Data is divided into 100 sec bins |
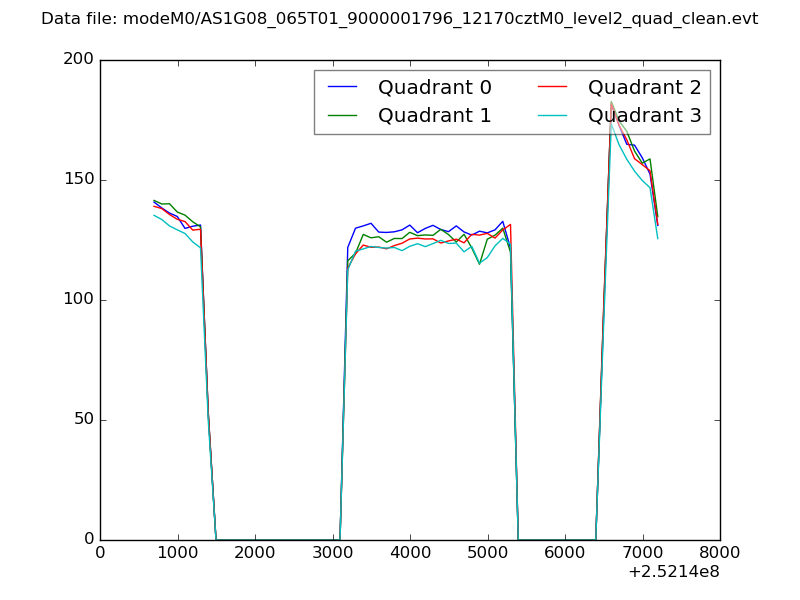 |
|
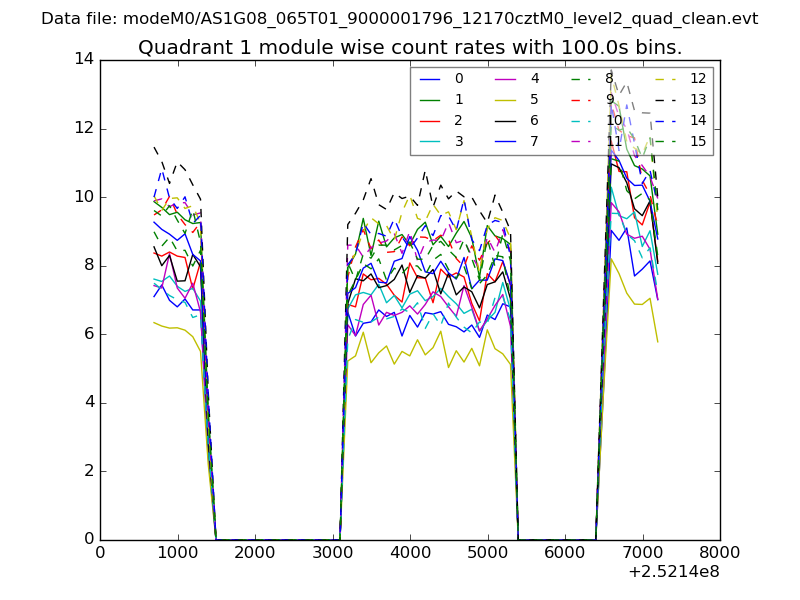
| Module-wise count rates for Quadrant A Data is divided into 100 sec bins |
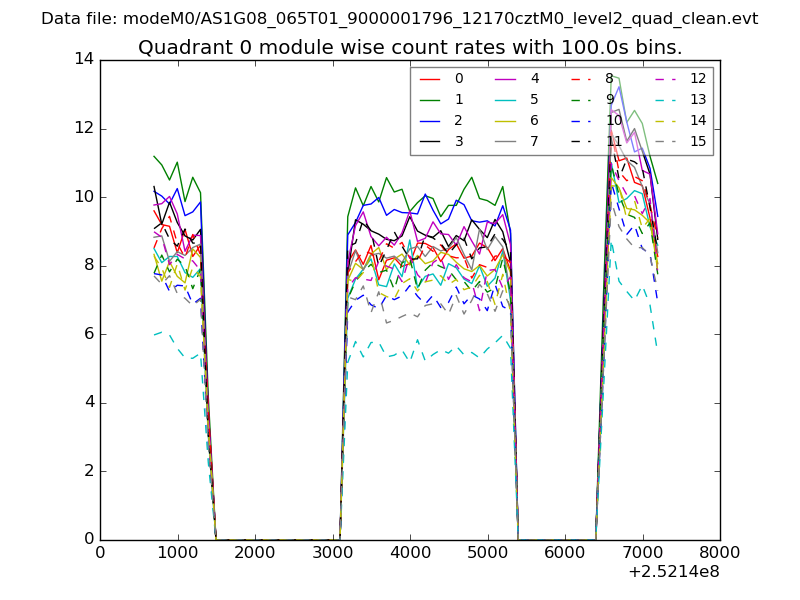 |
 |
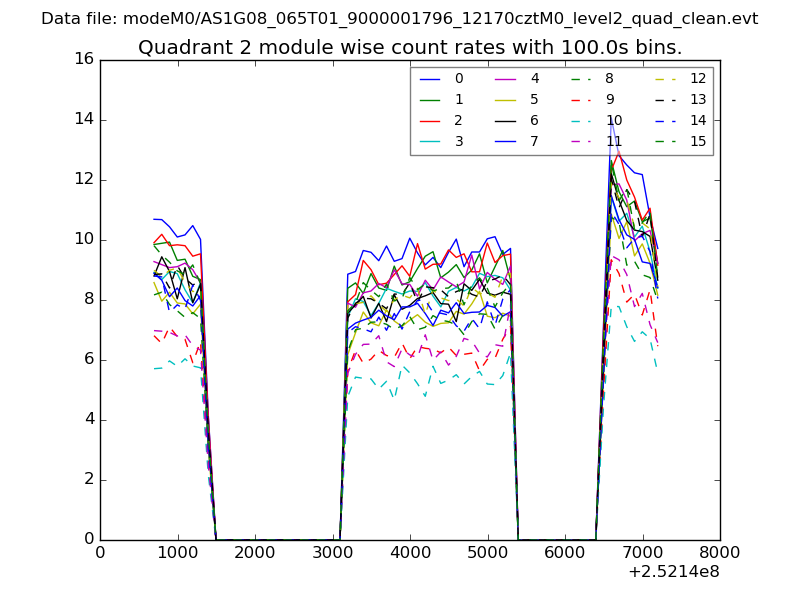
| Module-wise count rates for Quadrant B Data is divided into 100 sec bins |
 |
 |
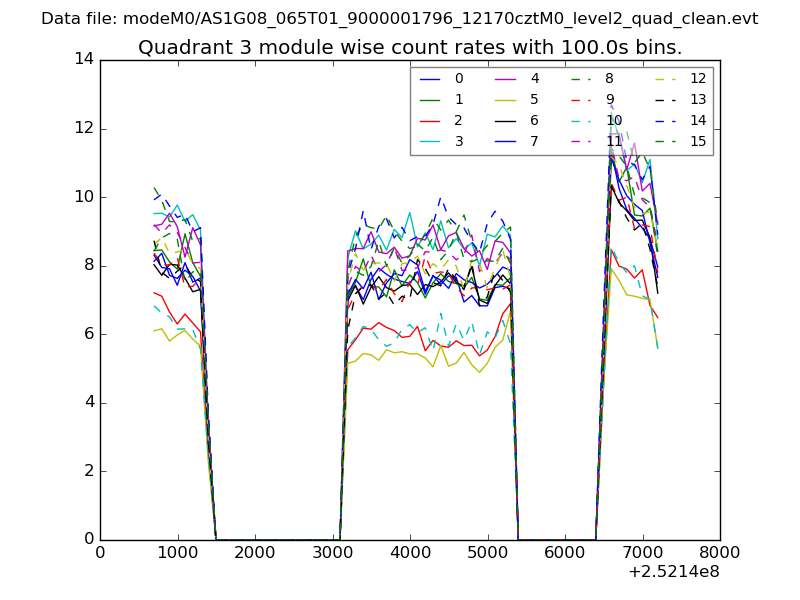
| Module-wise count rates for Quadrant C Data is divided into 100 sec bins |
 |
 |
| Module-wise count rates for Quadrant D Data is divided into 100 sec bins |
 |
 |
| Parameter | Plot |
|---|---|
| CZT HV Monitor | 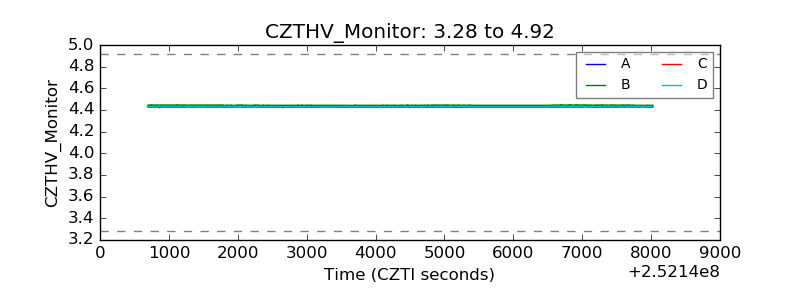 |
| D_VDD | 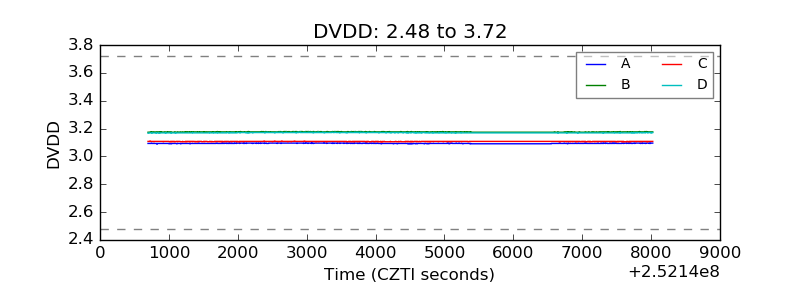 |
| Temperature 1 | 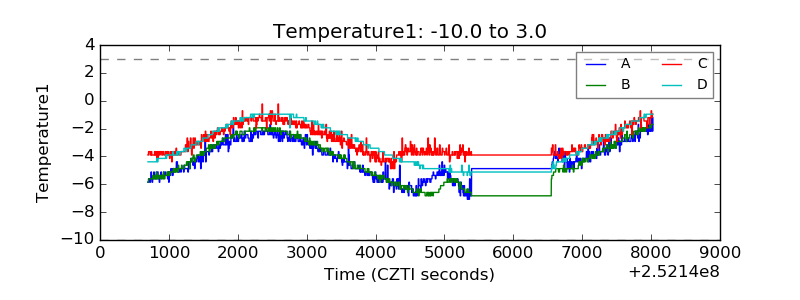 |
| Veto HV Monitor | 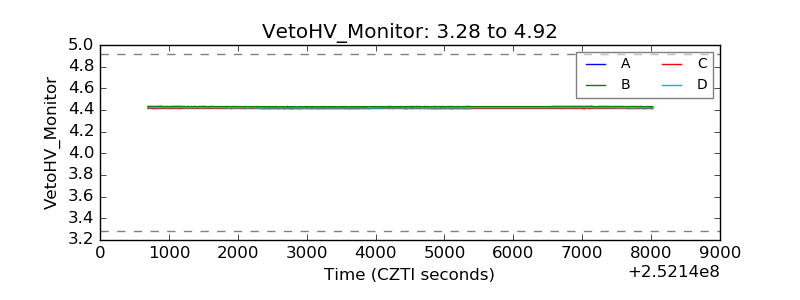 |
| Veto LLD |  |
| Alpha Counter | 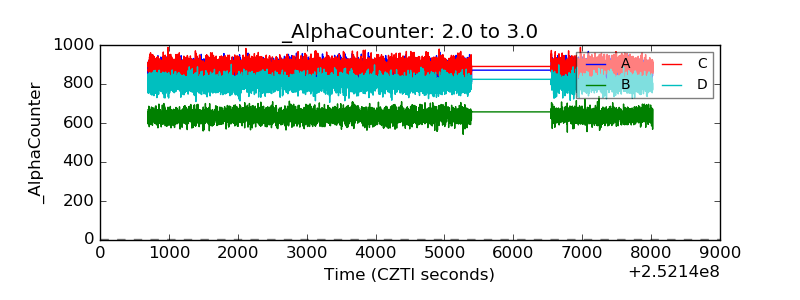 |
| _CPM_Rate | 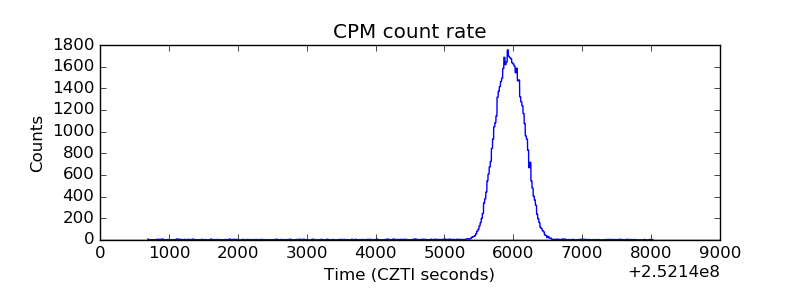 |
| CZT Counter | 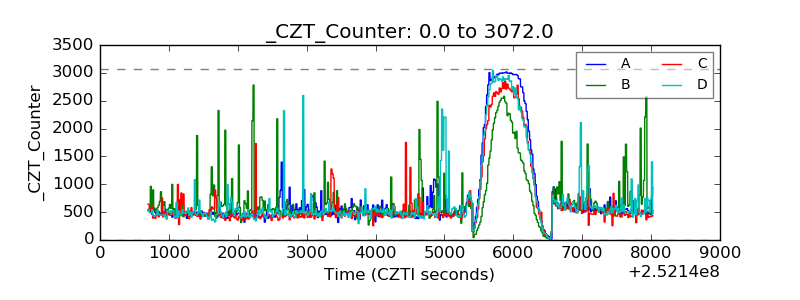 |
| +2.5 Volts monitor |  |
| +5 Volts monitor |  |
| _ROLL_ROT | 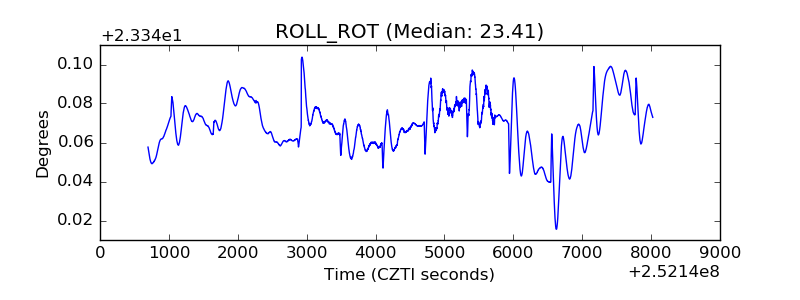 |
| _Roll_DEC | 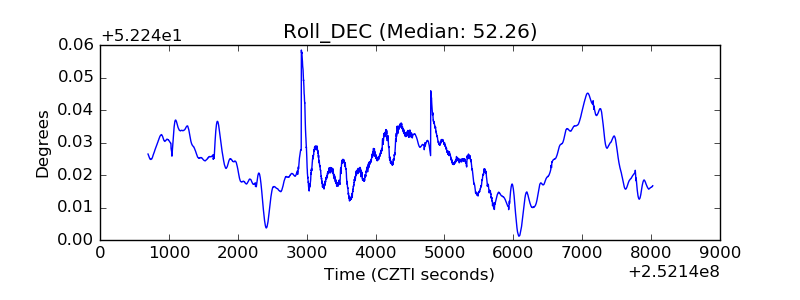 |
| _Roll_RA | 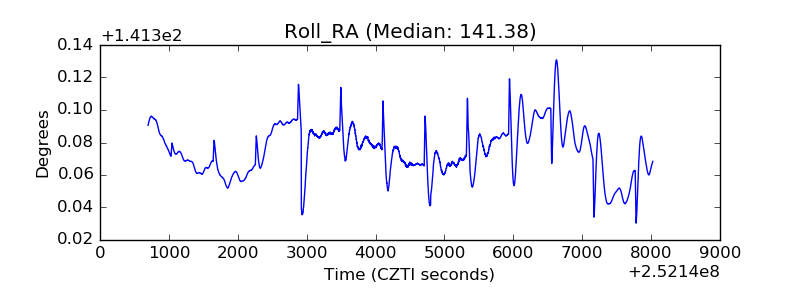 |
| Veto Counter | 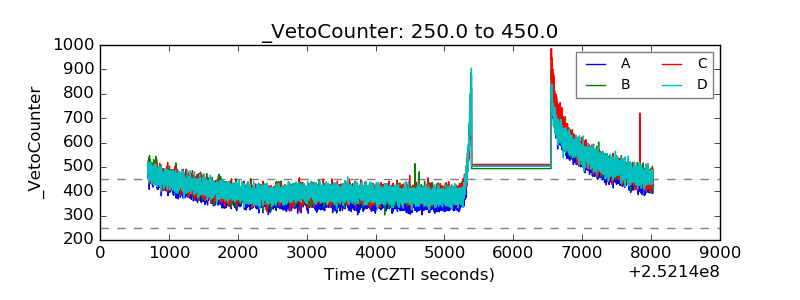 |