| Param | Original file | Final file |
|---|---|---|
| Filename | modeM0/AS1G08_065T01_9000001796_12172cztM0_level2.evt | modeM0/AS1G08_065T01_9000001796_12172cztM0_level2_quad_clean.evt |
| Size (bytes) | 558,218,880 | 73,408,320 |
| Size | 532.4 MB | 70.0 MB |
| Events in quadrant A | 3,787,837 | 457,709 |
| Events in quadrant B | 5,355,698 | 429,370 |
| Events in quadrant C | 3,484,344 | 447,844 |
| Events in quadrant D | 3,841,044 | 437,989 |
| Mode M0 | |||
|---|---|---|---|
| Quadrant | BADHDUFLAG | Total packets | Discarded packets |
| A | 0 | 15566 | 3 |
| B | 0 | 20399 | 2 |
| C | 0 | 14337 | 2 |
| D | 0 | 15621 | 2 |
| Mode M9 | |||
|---|---|---|---|
| Quadrant | BADHDUFLAG | Total packets | Discarded packets |
| A | 0 | 17 | 0 |
| B | 0 | 17 | 0 |
| C | 0 | 17 | 0 |
| D | 0 | 18 | 0 |
| Mode SS | |||
|---|---|---|---|
| Quadrant | BADHDUFLAG | Total packets | Discarded packets |
| A | 0 | 132 | 0 |
| B | 0 | 132 | 0 |
| C | 0 | 132 | 0 |
| D | 0 | 132 | 0 |
| Quadrant | Total seconds | Saturated seconds | Saturation percentage |
|---|---|---|---|
| A | 6442 | 143 | 2.219808% |
| B | 6442 | 681 | 10.571251% |
| C | 6442 | 85 | 1.319466% |
| D | 6442 | 109 | 1.692021% |
Noise dominated data is calculated using 1-second bins in cleaned event files. If a bin has >2000 counts, and if more than 50% of those come from <1% of pixels, then it is considered to be noise-dominated and hence unusable.
| Quadrant | # 1 sec bins | Bins with >0 counts | Bins with >2000 counts | High rate bins dominated by noise | Noise dominated (total time) | Noise dominated (detector-on time) | Marked lightcurve |
|---|---|---|---|---|---|---|---|
| A | 7783 | 6444 | 7 | 7 | 0.09% | 0.11% | 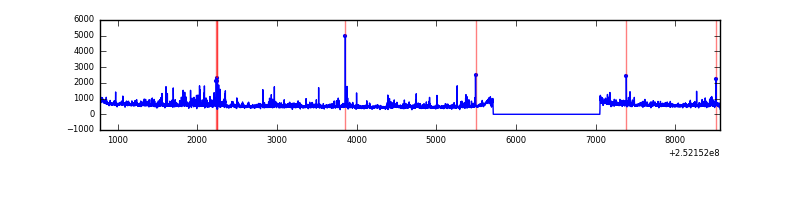 |
| B | 7783 | 6444 | 352 | 352 | 4.52% | 5.46% | 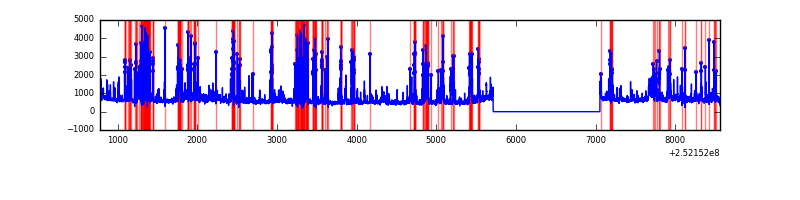 |
| C | 7783 | 6444 | 11 | 11 | 0.14% | 0.17% | 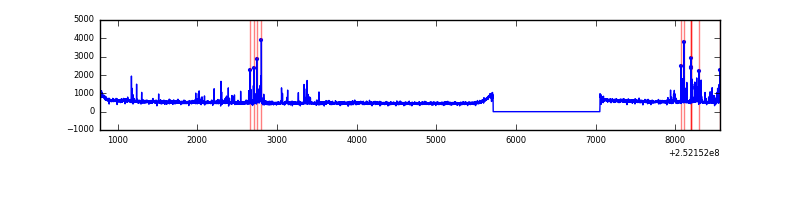 |
| D | 7783 | 6444 | 29 | 29 | 0.37% | 0.45% | 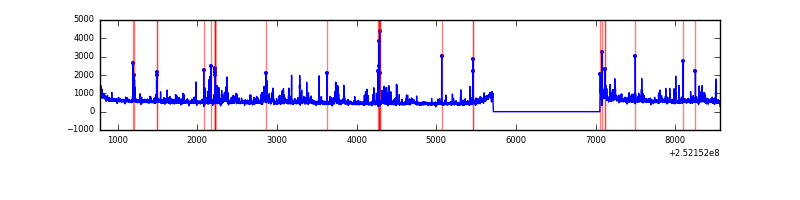 |
Top three noisy pixels from each quadrant. If the there are fewer than three noisy pixels in the level2.evt file, extra rows are filled as -1
| Pixel properties | Quadrant properties | ||||||
|---|---|---|---|---|---|---|---|
| Quadrant | DetID | PixID | Counts | Sigma | Mean | Median | Sigma |
| A | 1 | 162 | 144395 | 827.12 | 870 | 854 | 173.5 |
| A | 1 | 178 | 71706 | 408.27 | 870 | 854 | 173.5 |
| A | 1 | 161 | 63634 | 361.75 | 870 | 854 | 173.5 |
| B | 4 | 239 | 1449944 | 9445.68 | 821 | 805 | 153.4 |
| B | 10 | 16 | 213882 | 1388.86 | 821 | 805 | 153.4 |
| B | 11 | 51 | 144236 | 934.9 | 821 | 805 | 153.4 |
| C | 15 | 208 | 214569 | 1134.56 | 833 | 839 | 188.4 |
| C | 3 | 233 | 6286 | 28.91 | 833 | 839 | 188.4 |
| C | 13 | 61 | 6182 | 28.36 | 833 | 839 | 188.4 |
| D | 1 | 52 | 252637 | 1272.41 | 840 | 819 | 197.9 |
| D | 13 | 104 | 100385 | 503.1 | 840 | 819 | 197.9 |
| D | 12 | 221 | 55600 | 276.8 | 840 | 819 | 197.9 |
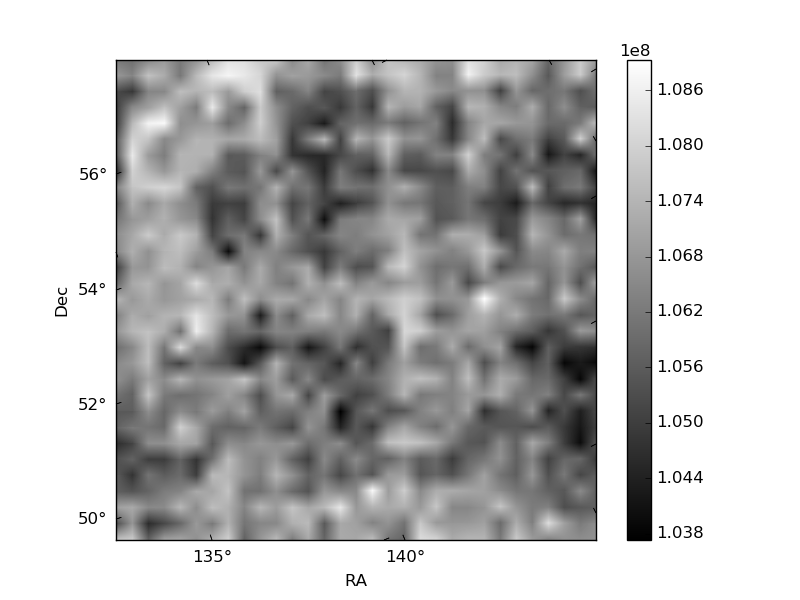
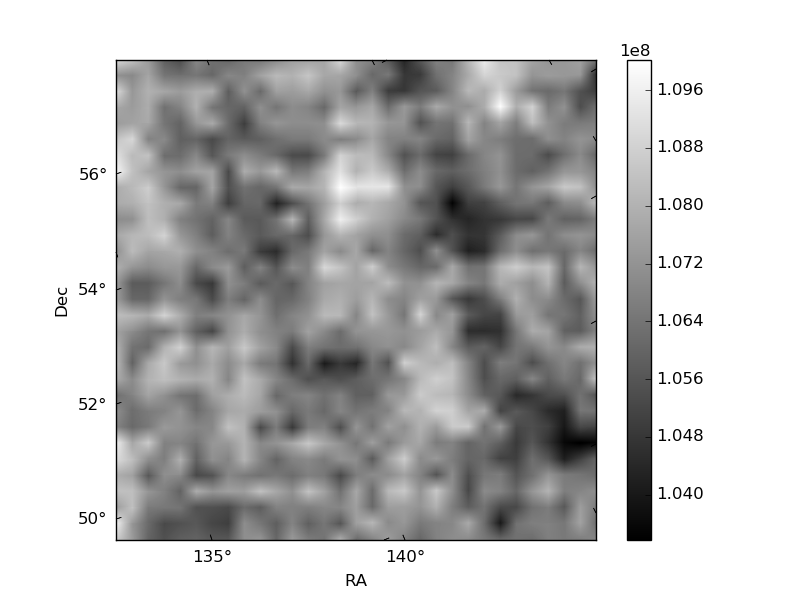
Histogram calculated using DETX and DETY for each event in the final _common_clean file
| Quadrant A |  |
 |
Quadrant B |
|---|---|---|---|
| Quadrant D |  |
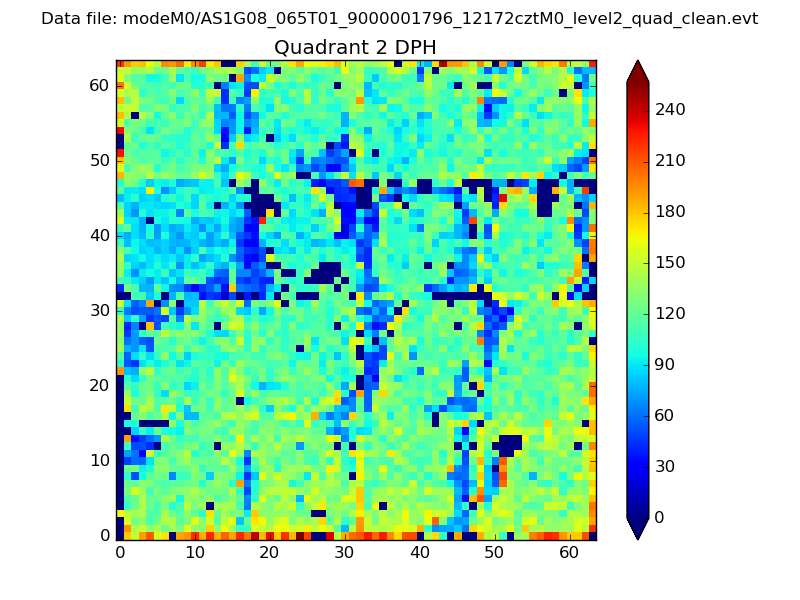 |
Quadrant C |
| Plot type | Count rate plots | Images |
|---|---|---|
| Comparison with Poisson distribution Blue bars denote a histogram of data divided into 1 sec bins. Red curve is a Poisson curve with rate = median count rate of data. |
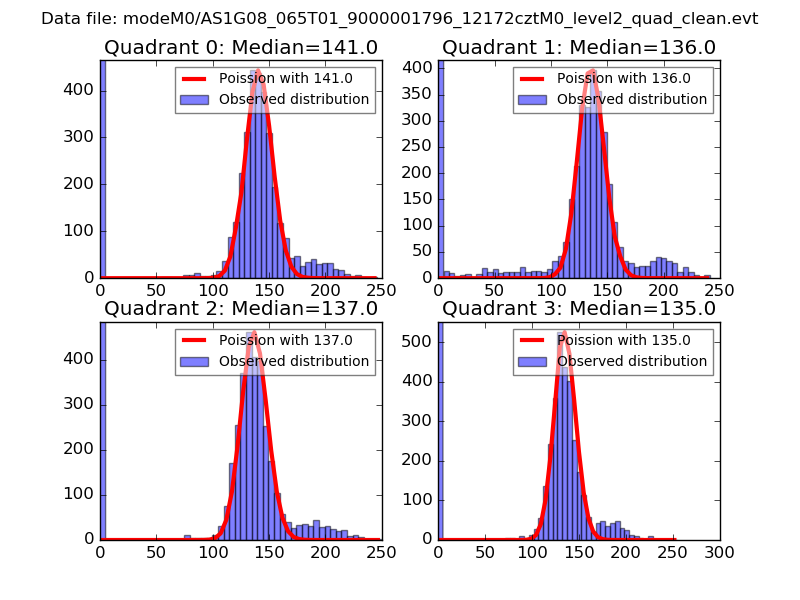 |
 |
| Quadrant-wise count rates Data is divided into 100 sec bins |
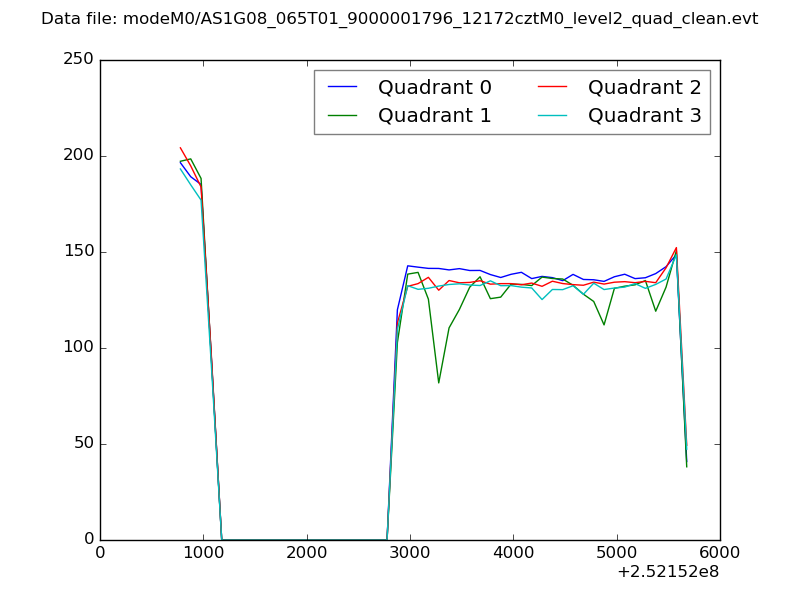 |
|
| Module-wise count rates for Quadrant A Data is divided into 100 sec bins |
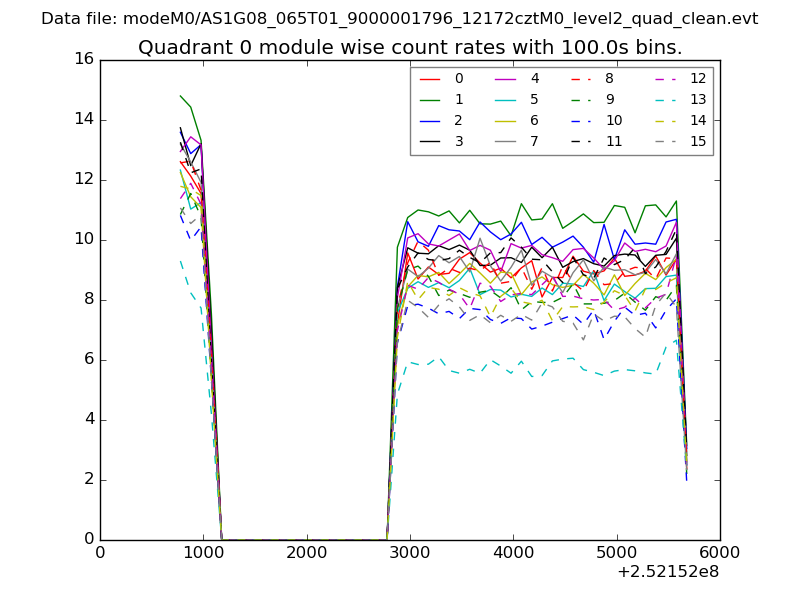 |
 |
| Module-wise count rates for Quadrant B Data is divided into 100 sec bins |
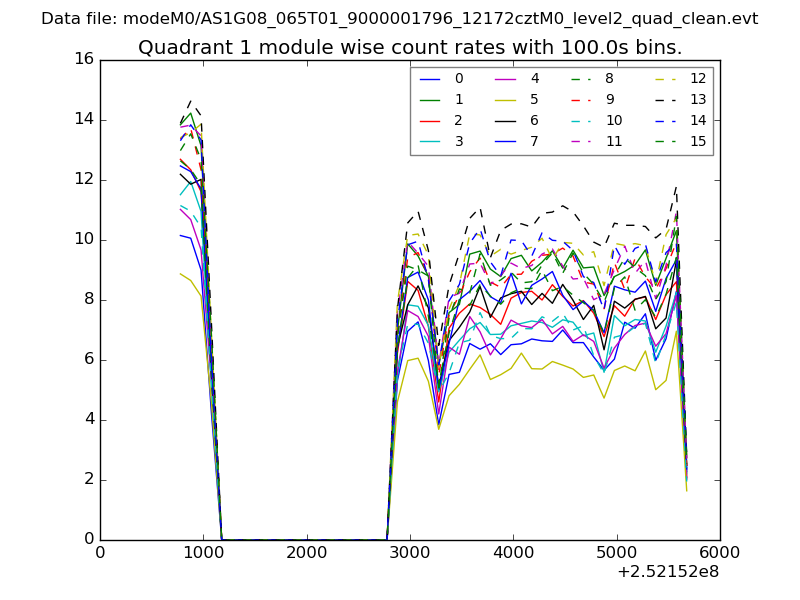 |
 |
| Module-wise count rates for Quadrant C Data is divided into 100 sec bins |
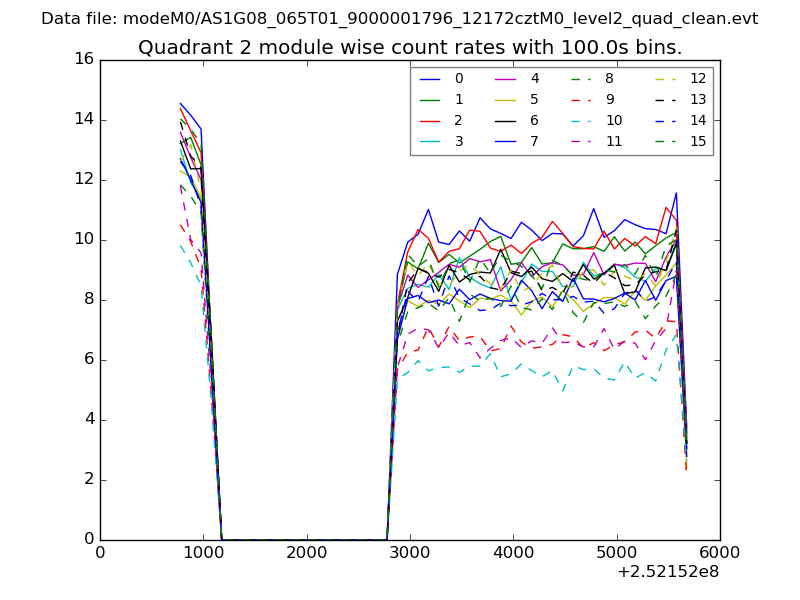 |
 |
| Module-wise count rates for Quadrant D Data is divided into 100 sec bins |
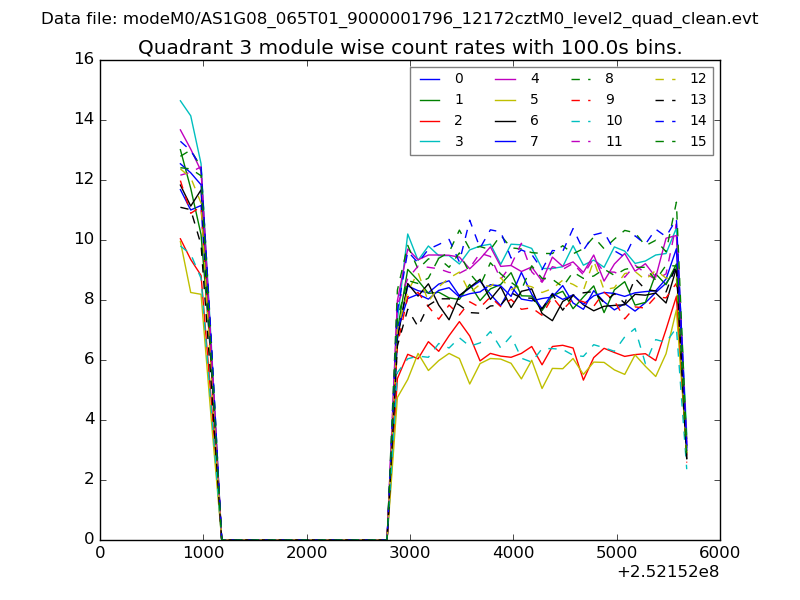 |
 |
| Parameter | Plot |
|---|---|
| CZT HV Monitor | 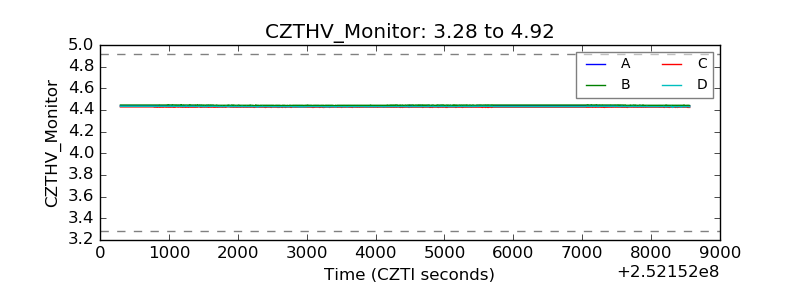 |
| D_VDD | 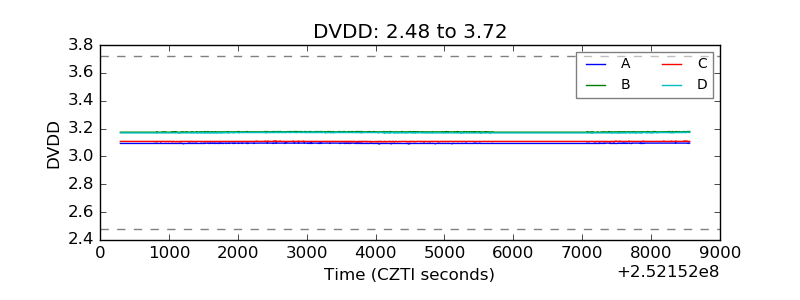 |
| Temperature 1 | 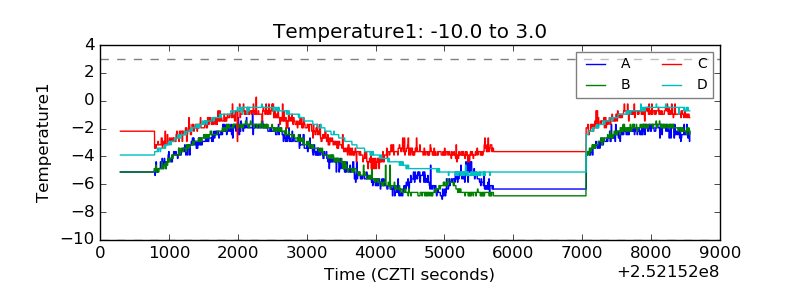 |
| Veto HV Monitor | 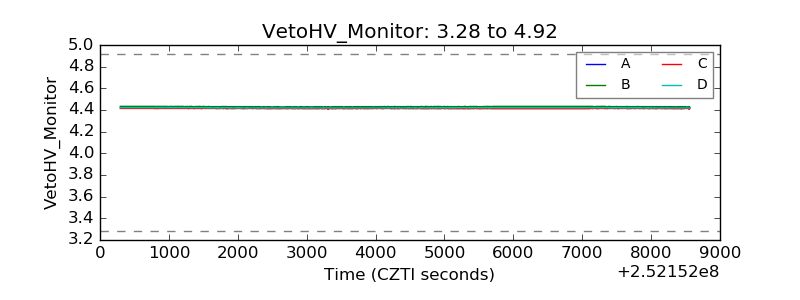 |
| Veto LLD | 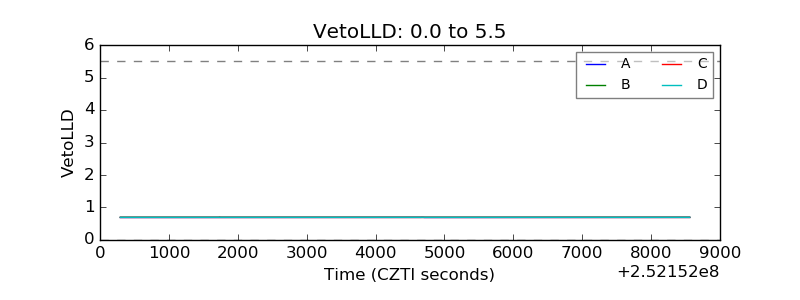 |
| Alpha Counter | 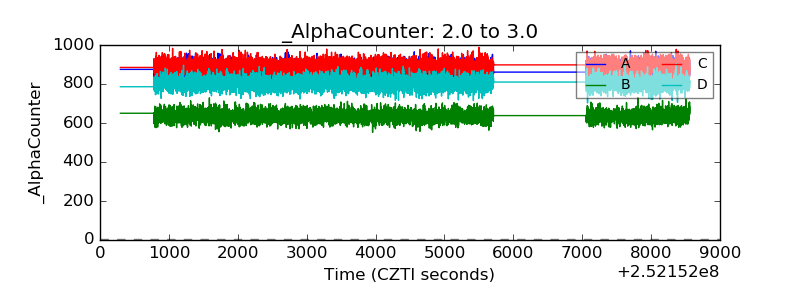 |
| _CPM_Rate | 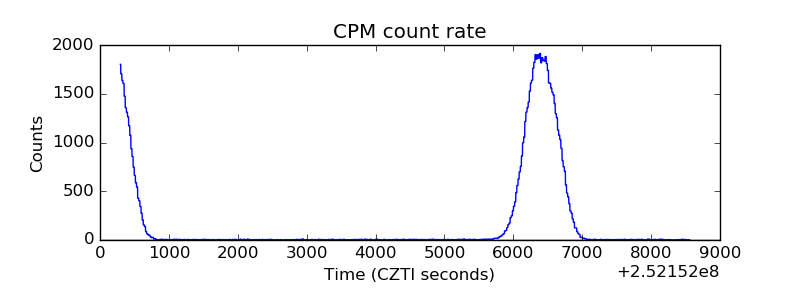 |
| CZT Counter | 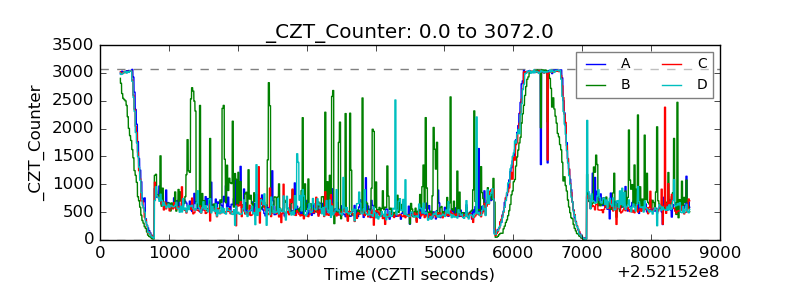 |
| +2.5 Volts monitor |  |
| +5 Volts monitor | 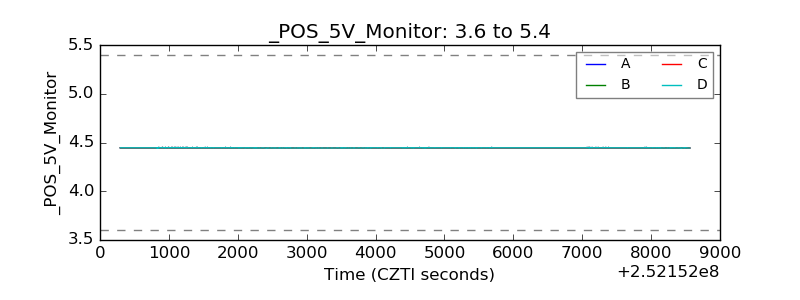 |
| _ROLL_ROT | 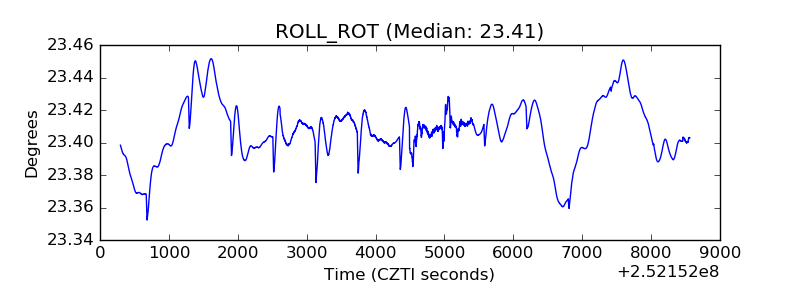 |
| _Roll_DEC | 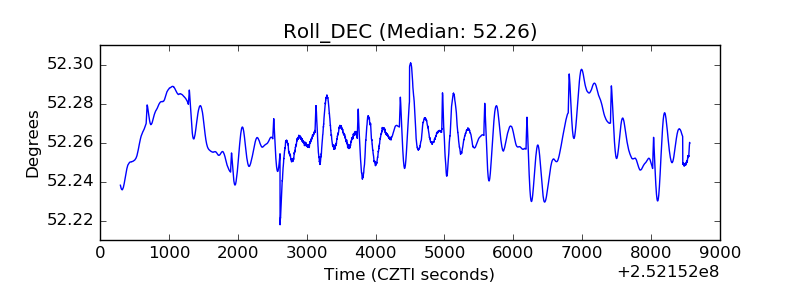 |
| _Roll_RA | 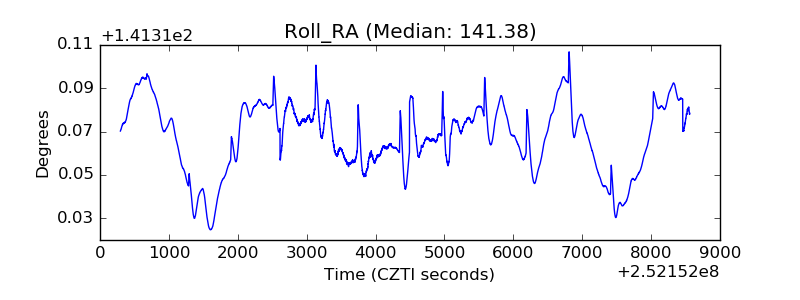 |
| Veto Counter | 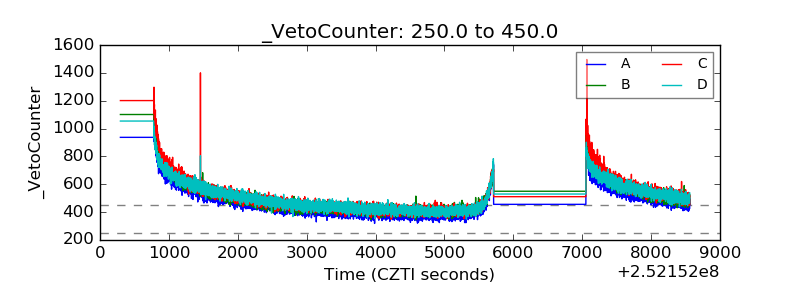 |