| Param | Original file | Final file |
|---|---|---|
| Filename | modeM0/AS1G08_065T01_9000001796_12173cztM0_level2.evt | modeM0/AS1G08_065T01_9000001796_12173cztM0_level2_quad_clean.evt |
| Size (bytes) | 556,191,360 | 73,978,560 |
| Size | 530.4 MB | 70.6 MB |
| Events in quadrant A | 3,606,954 | 474,080 |
| Events in quadrant B | 5,405,009 | 410,186 |
| Events in quadrant C | 3,572,727 | 459,738 |
| Events in quadrant D | 3,828,109 | 451,530 |
| Mode M0 | |||
|---|---|---|---|
| Quadrant | BADHDUFLAG | Total packets | Discarded packets |
| A | 0 | 14868 | 3 |
| B | 0 | 20517 | 2 |
| C | 0 | 14609 | 2 |
| D | 0 | 15443 | 2 |
| Mode M9 | |||
|---|---|---|---|
| Quadrant | BADHDUFLAG | Total packets | Discarded packets |
| A | 0 | 17 | 0 |
| B | 0 | 17 | 0 |
| C | 0 | 17 | 0 |
| D | 0 | 18 | 0 |
| Mode SS | |||
|---|---|---|---|
| Quadrant | BADHDUFLAG | Total packets | Discarded packets |
| A | 0 | 130 | 0 |
| B | 0 | 130 | 0 |
| C | 0 | 130 | 0 |
| D | 0 | 130 | 0 |
| Quadrant | Total seconds | Saturated seconds | Saturation percentage |
|---|---|---|---|
| A | 6363 | 129 | 2.027346% |
| B | 6363 | 743 | 11.676882% |
| C | 6363 | 107 | 1.681597% |
| D | 6363 | 141 | 2.215936% |
Noise dominated data is calculated using 1-second bins in cleaned event files. If a bin has >2000 counts, and if more than 50% of those come from <1% of pixels, then it is considered to be noise-dominated and hence unusable.
| Quadrant | # 1 sec bins | Bins with >0 counts | Bins with >2000 counts | High rate bins dominated by noise | Noise dominated (total time) | Noise dominated (detector-on time) | Marked lightcurve |
|---|---|---|---|---|---|---|---|
| A | 7694 | 6365 | 6 | 6 | 0.08% | 0.09% | 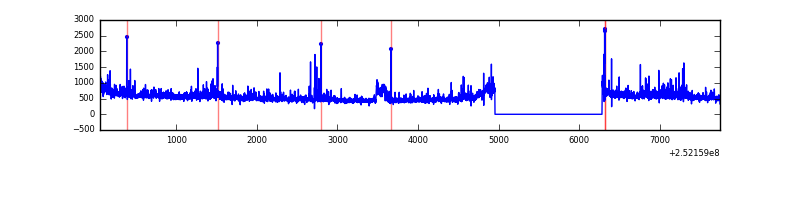 |
| B | 7694 | 6365 | 457 | 457 | 5.94% | 7.18% | 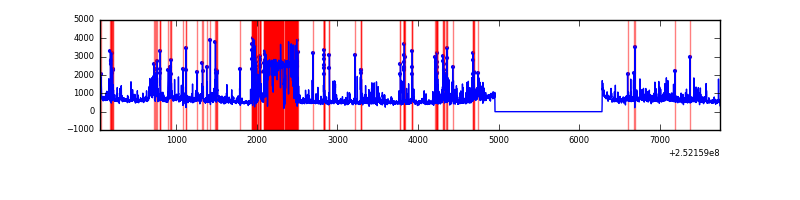 |
| C | 7694 | 6365 | 48 | 48 | 0.62% | 0.75% | 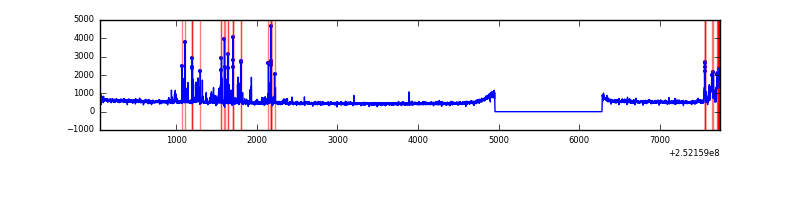 |
| D | 7694 | 6365 | 47 | 47 | 0.61% | 0.74% | 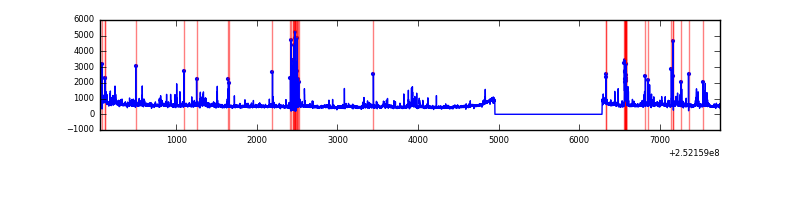 |
Top three noisy pixels from each quadrant. If the there are fewer than three noisy pixels in the level2.evt file, extra rows are filled as -1
| Pixel properties | Quadrant properties | ||||||
|---|---|---|---|---|---|---|---|
| Quadrant | DetID | PixID | Counts | Sigma | Mean | Median | Sigma |
| A | 1 | 162 | 105358 | 621.59 | 847 | 833 | 168.2 |
| A | 1 | 178 | 50500 | 295.36 | 847 | 833 | 168.2 |
| A | 5 | 16 | 45454 | 265.35 | 847 | 833 | 168.2 |
| B | 4 | 239 | 990696 | 6750.1 | 790 | 774 | 146.7 |
| B | 10 | 245 | 920001 | 6268.05 | 790 | 774 | 146.7 |
| B | 11 | 51 | 152162 | 1032.29 | 790 | 774 | 146.7 |
| C | 15 | 208 | 350691 | 1880.77 | 817 | 821 | 186.0 |
| C | 3 | 233 | 24078 | 125.02 | 817 | 821 | 186.0 |
| C | 13 | 61 | 6131 | 28.54 | 817 | 821 | 186.0 |
| D | 8 | 195 | 151361 | 773.01 | 821 | 798 | 194.8 |
| D | 13 | 104 | 144973 | 740.21 | 821 | 798 | 194.8 |
| D | 1 | 52 | 102467 | 521.98 | 821 | 798 | 194.8 |
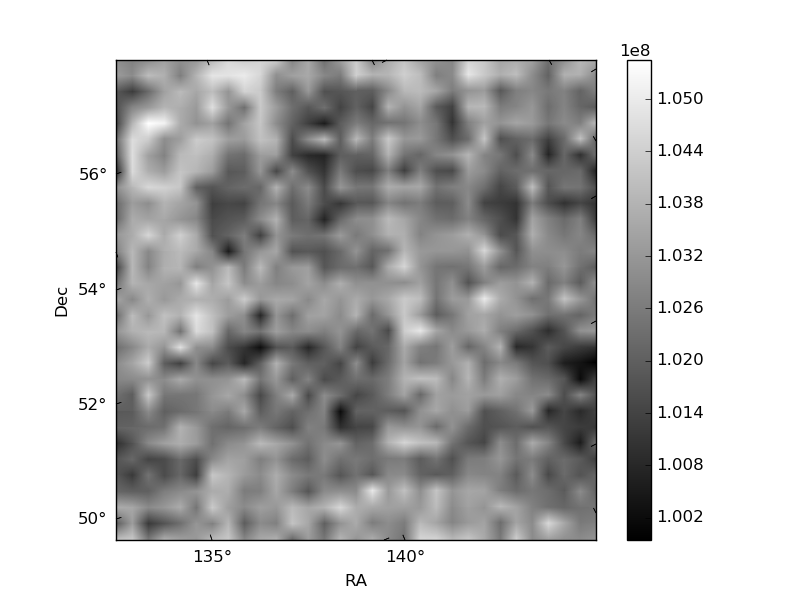
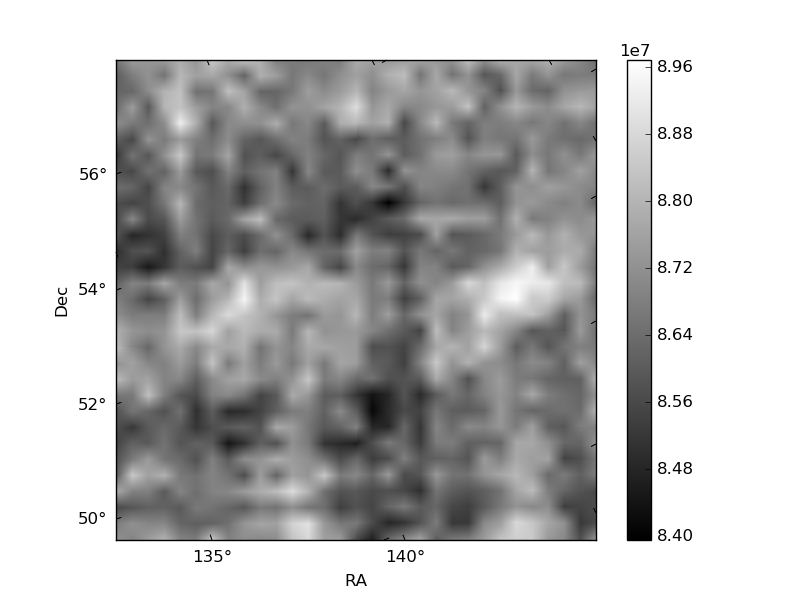
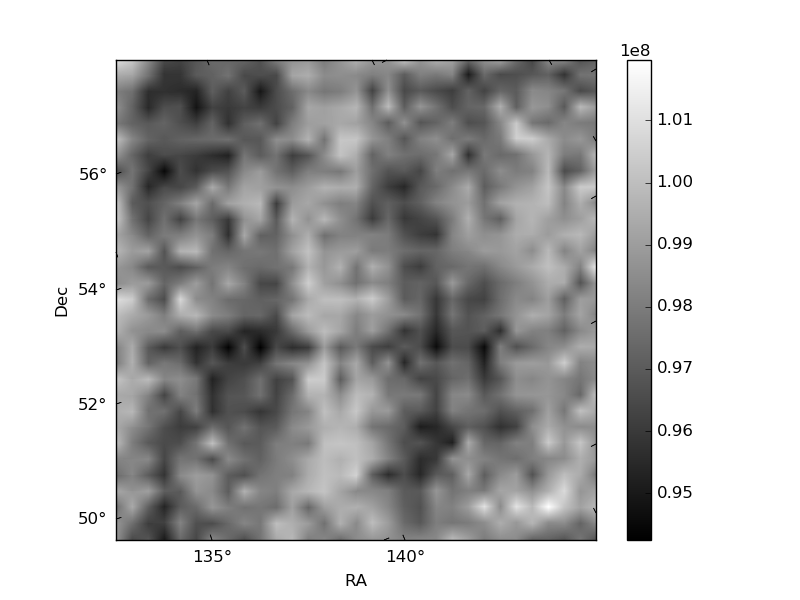
Histogram calculated using DETX and DETY for each event in the final _common_clean file
| Quadrant A |  |
 |
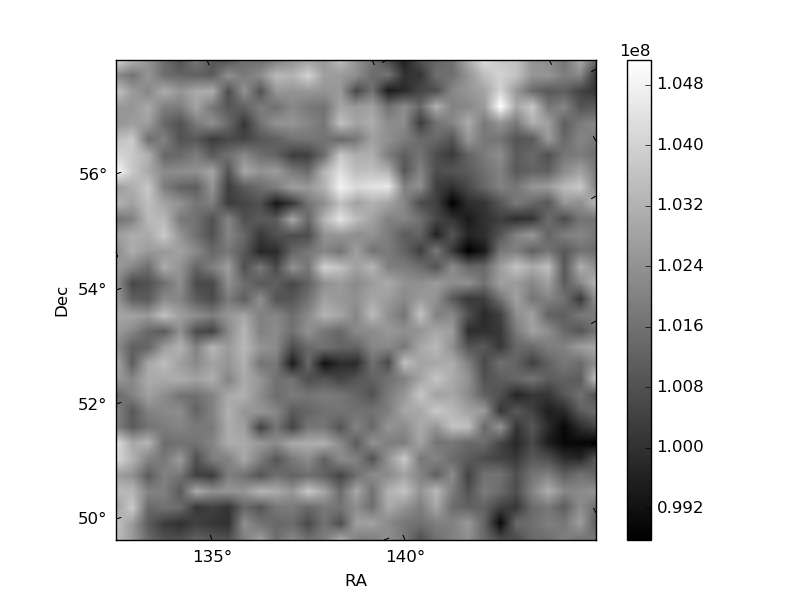
Quadrant B |
|---|---|---|---|
| Quadrant D |  |
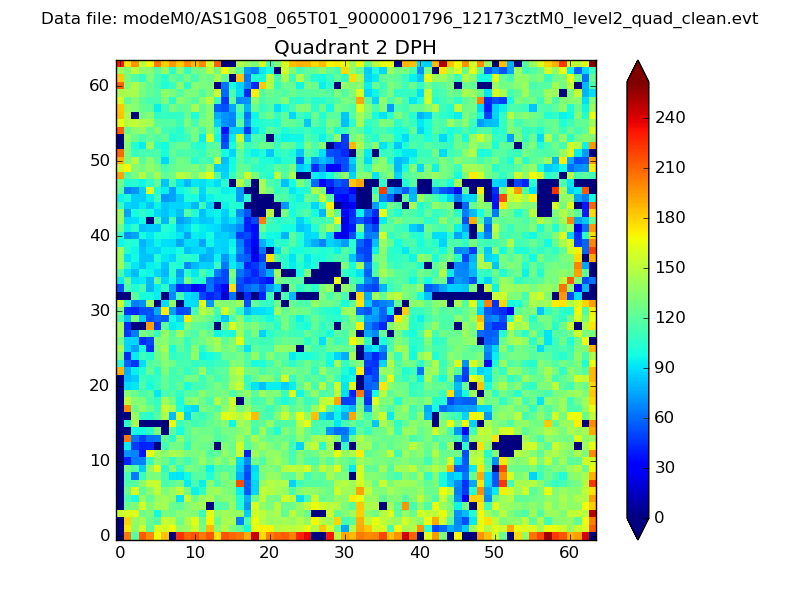 |
Quadrant C |
| Plot type | Count rate plots | Images |
|---|---|---|
| Comparison with Poisson distribution Blue bars denote a histogram of data divided into 1 sec bins. Red curve is a Poisson curve with rate = median count rate of data. |
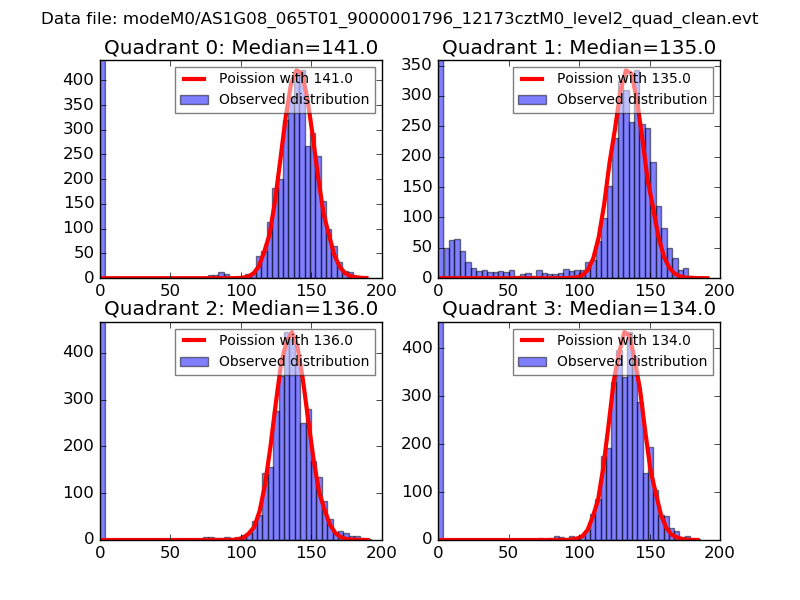 |
 |
| Quadrant-wise count rates Data is divided into 100 sec bins |
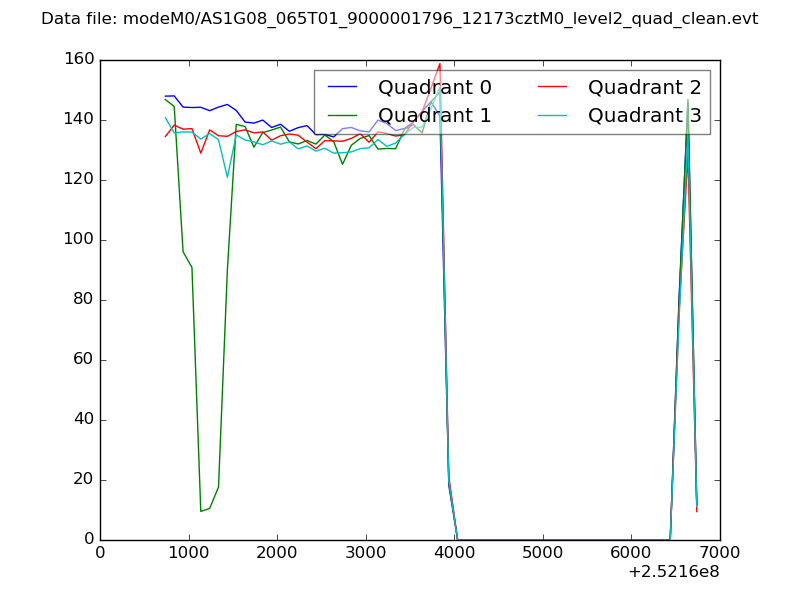 |
|
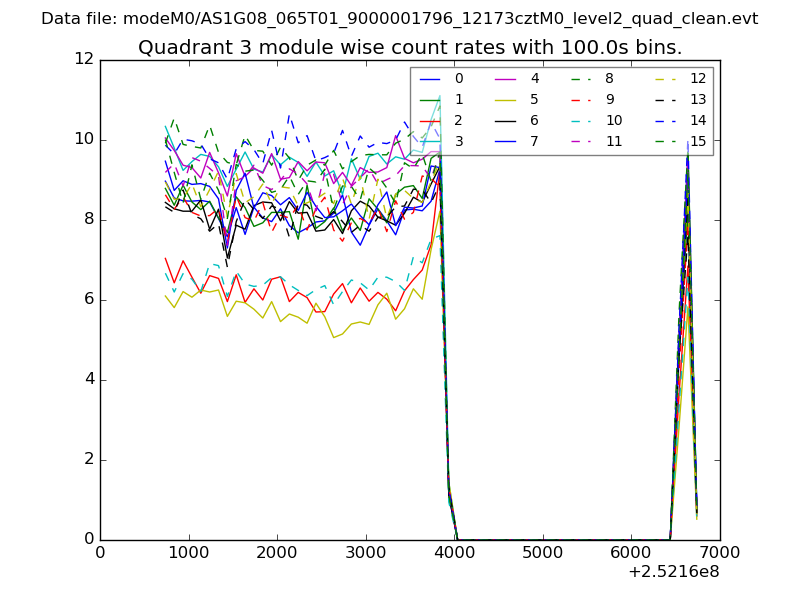
| Module-wise count rates for Quadrant A Data is divided into 100 sec bins |
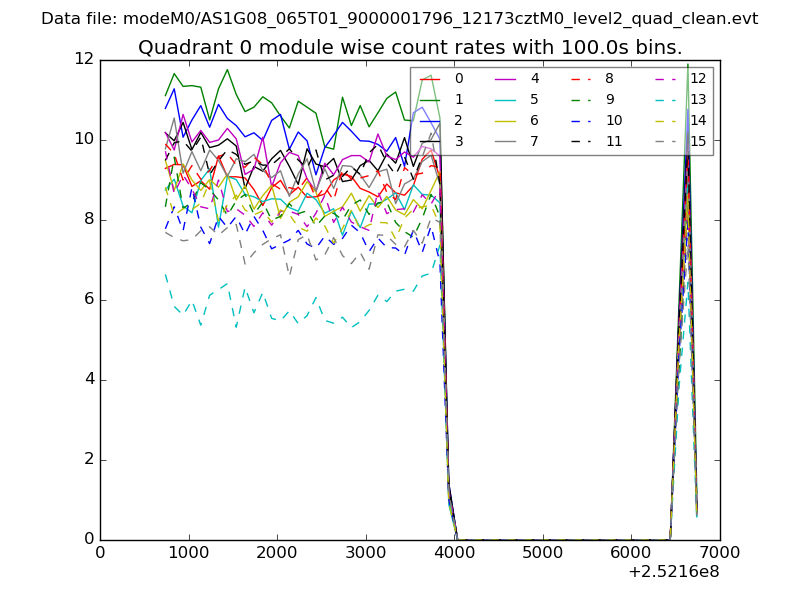 |
 |
| Module-wise count rates for Quadrant B Data is divided into 100 sec bins |
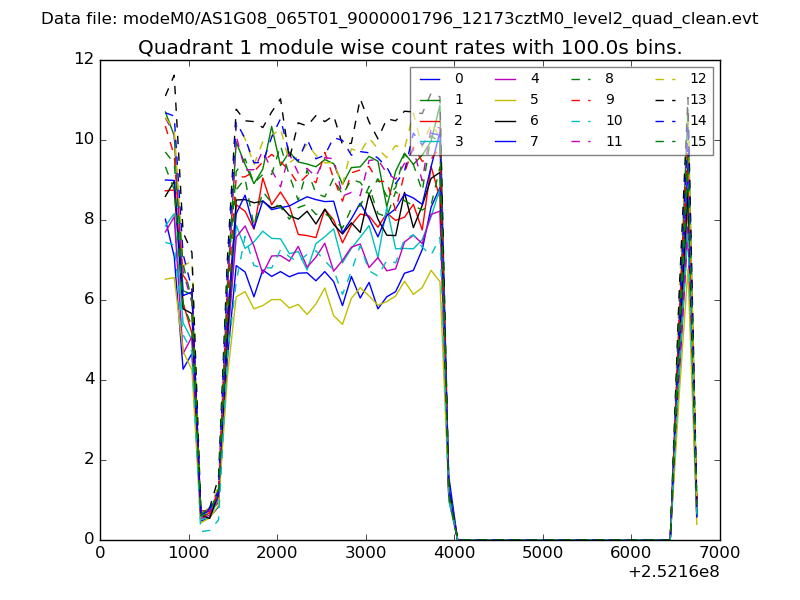 |
 |
| Module-wise count rates for Quadrant C Data is divided into 100 sec bins |
 |
 |
| Module-wise count rates for Quadrant D Data is divided into 100 sec bins |
 |
 |
| Parameter | Plot |
|---|---|
| CZT HV Monitor |  |
| D_VDD | 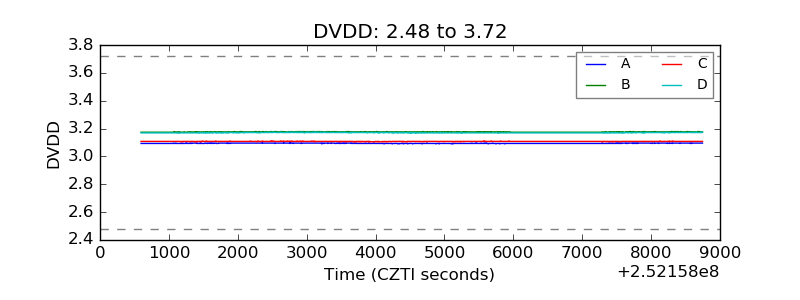 |
| Temperature 1 | 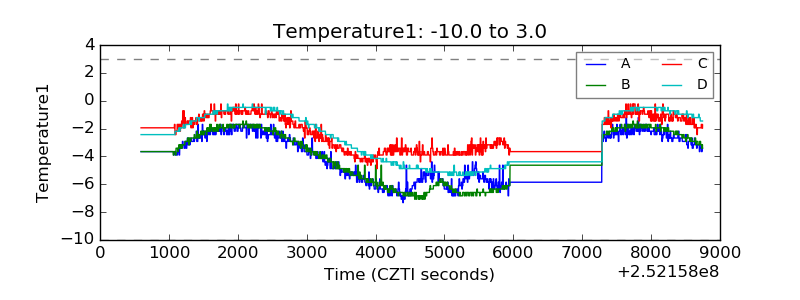 |
| Veto HV Monitor | 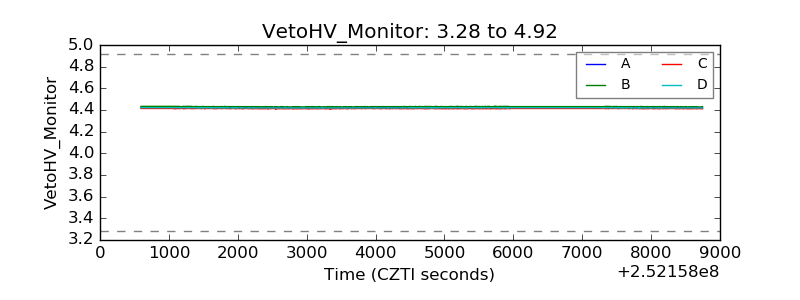 |
| Veto LLD | 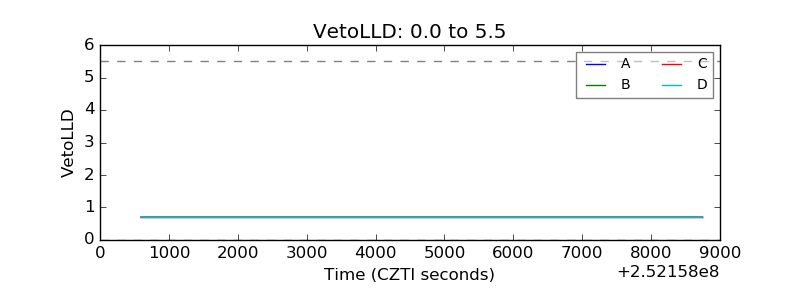 |
| Alpha Counter | 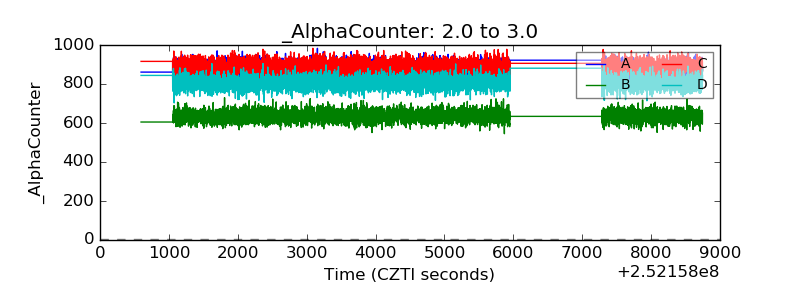 |
| _CPM_Rate | 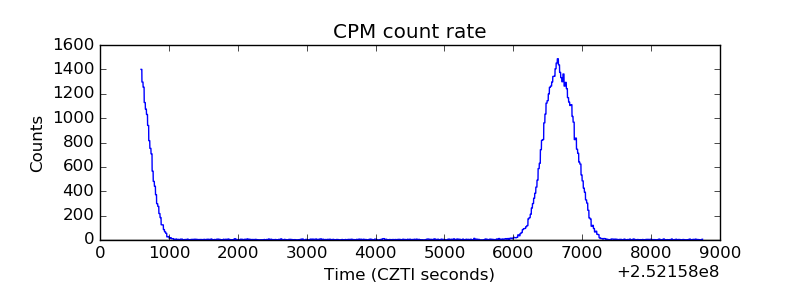 |
| CZT Counter | 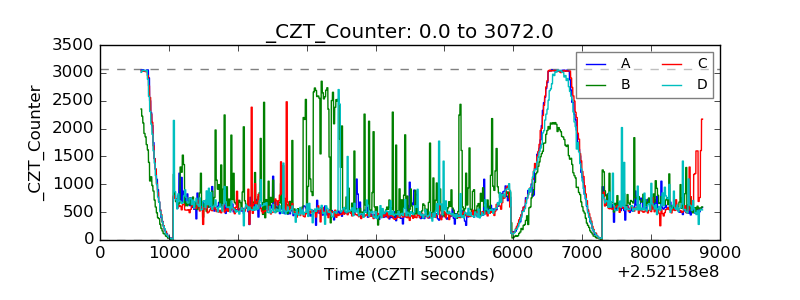 |
| +2.5 Volts monitor | 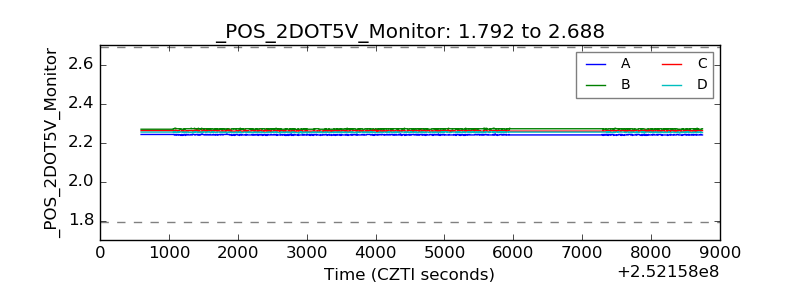 |
| +5 Volts monitor | 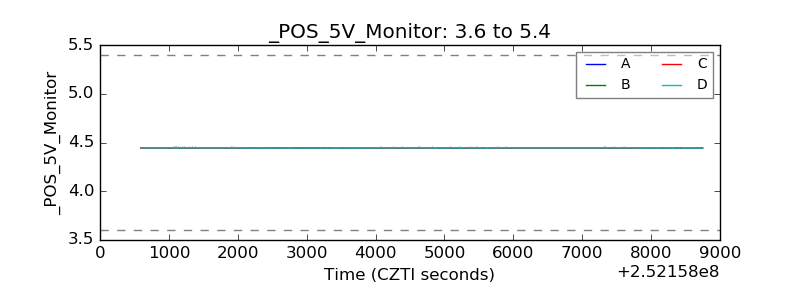 |
| _ROLL_ROT | 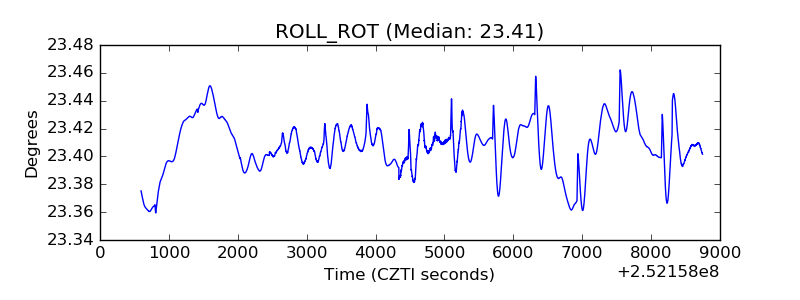 |
| _Roll_DEC | 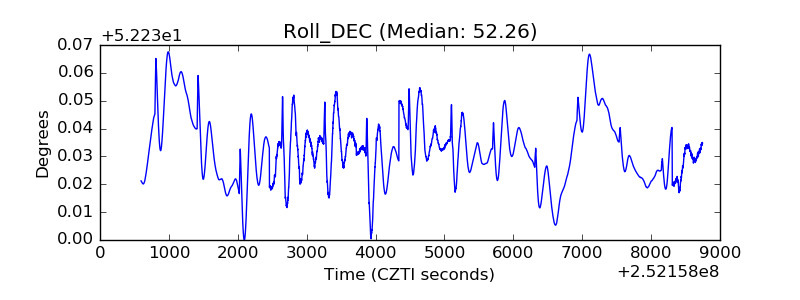 |
| _Roll_RA | 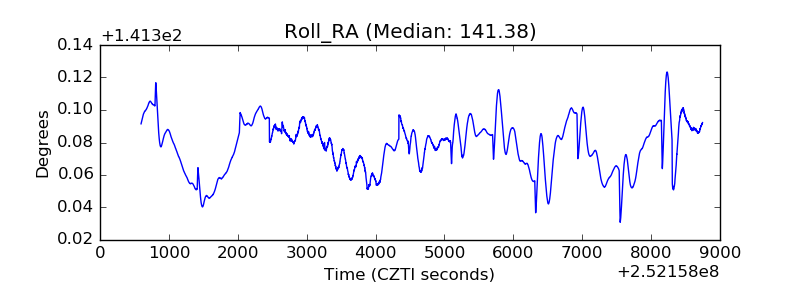 |
| Veto Counter | 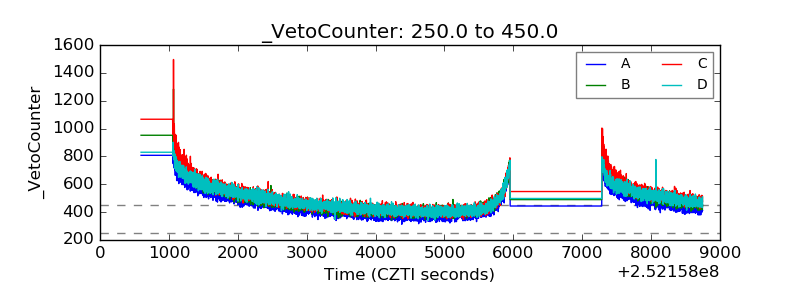 |