| Param | Original file | Final file |
|---|---|---|
| Filename | modeM0/AS1G08_065T01_9000001796_12174cztM0_level2.evt | modeM0/AS1G08_065T01_9000001796_12174cztM0_level2_quad_clean.evt |
| Size (bytes) | 556,666,560 | 84,700,800 |
| Size | 530.9 MB | 80.8 MB |
| Events in quadrant A | 3,532,487 | 547,557 |
| Events in quadrant B | 5,577,686 | 512,961 |
| Events in quadrant C | 3,532,447 | 537,879 |
| Events in quadrant D | 3,790,110 | 527,566 |
| Mode M0 | |||
|---|---|---|---|
| Quadrant | BADHDUFLAG | Total packets | Discarded packets |
| A | 0 | 14698 | 3 |
| B | 0 | 20926 | 2 |
| C | 0 | 14525 | 2 |
| D | 0 | 15458 | 2 |
| Mode M9 | |||
|---|---|---|---|
| Quadrant | BADHDUFLAG | Total packets | Discarded packets |
| A | 0 | 14 | 0 |
| B | 0 | 14 | 0 |
| C | 0 | 14 | 0 |
| D | 0 | 15 | 0 |
| Mode SS | |||
|---|---|---|---|
| Quadrant | BADHDUFLAG | Total packets | Discarded packets |
| A | 0 | 128 | 0 |
| B | 0 | 128 | 0 |
| C | 0 | 128 | 0 |
| D | 0 | 128 | 0 |
| Quadrant | Total seconds | Saturated seconds | Saturation percentage |
|---|---|---|---|
| A | 6280 | 231 | 3.678344% |
| B | 6280 | 870 | 13.853503% |
| C | 6280 | 187 | 2.977707% |
| D | 6280 | 193 | 3.073248% |
Noise dominated data is calculated using 1-second bins in cleaned event files. If a bin has >2000 counts, and if more than 50% of those come from <1% of pixels, then it is considered to be noise-dominated and hence unusable.
| Quadrant | # 1 sec bins | Bins with >0 counts | Bins with >2000 counts | High rate bins dominated by noise | Noise dominated (total time) | Noise dominated (detector-on time) | Marked lightcurve |
|---|---|---|---|---|---|---|---|
| A | 7481 | 6282 | 38 | 38 | 0.51% | 0.60% | 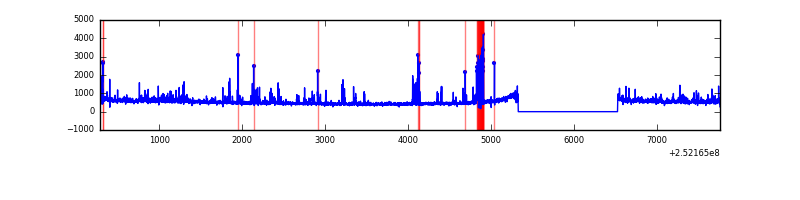 |
| B | 7481 | 6282 | 539 | 539 | 7.20% | 8.58% | 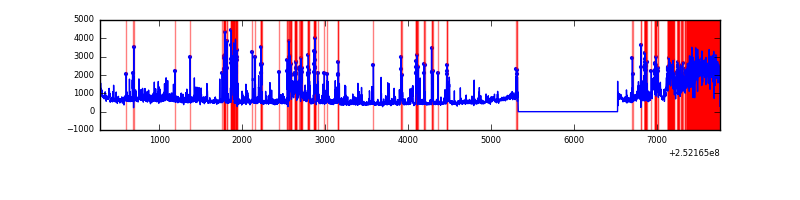 |
| C | 7481 | 6282 | 95 | 95 | 1.27% | 1.51% | 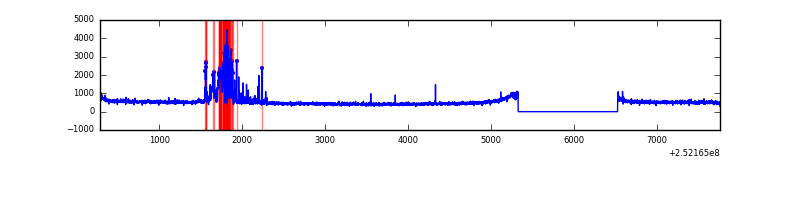 |
| D | 7481 | 6282 | 89 | 89 | 1.19% | 1.42% | 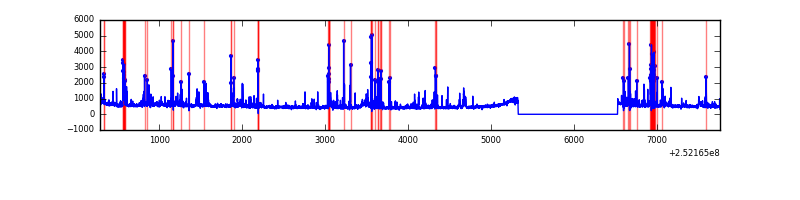 |
Top three noisy pixels from each quadrant. If the there are fewer than three noisy pixels in the level2.evt file, extra rows are filled as -1
| Pixel properties | Quadrant properties | ||||||
|---|---|---|---|---|---|---|---|
| Quadrant | DetID | PixID | Counts | Sigma | Mean | Median | Sigma |
| A | 1 | 162 | 189968 | 1181.44 | 802 | 785 | 160.1 |
| A | 1 | 178 | 74690 | 461.53 | 802 | 785 | 160.1 |
| A | 1 | 161 | 70882 | 437.75 | 802 | 785 | 160.1 |
| B | 0 | 85 | 1167807 | 8169.83 | 765 | 748 | 142.8 |
| B | 4 | 239 | 763205 | 5337.47 | 765 | 748 | 142.8 |
| B | 10 | 245 | 335358 | 2342.39 | 765 | 748 | 142.8 |
| C | 15 | 208 | 432291 | 2398.56 | 782 | 788 | 179.9 |
| C | 3 | 233 | 44156 | 241.07 | 782 | 788 | 179.9 |
| C | 13 | 61 | 5885 | 28.33 | 782 | 788 | 179.9 |
| D | 1 | 52 | 330822 | 1778.09 | 783 | 763 | 185.6 |
| D | 4 | 95 | 156272 | 837.75 | 783 | 763 | 185.6 |
| D | 13 | 104 | 113844 | 609.19 | 783 | 763 | 185.6 |
Histogram calculated using DETX and DETY for each event in the final _common_clean file
| Quadrant A |  |
 |
Quadrant B |
|---|---|---|---|
| Quadrant D | 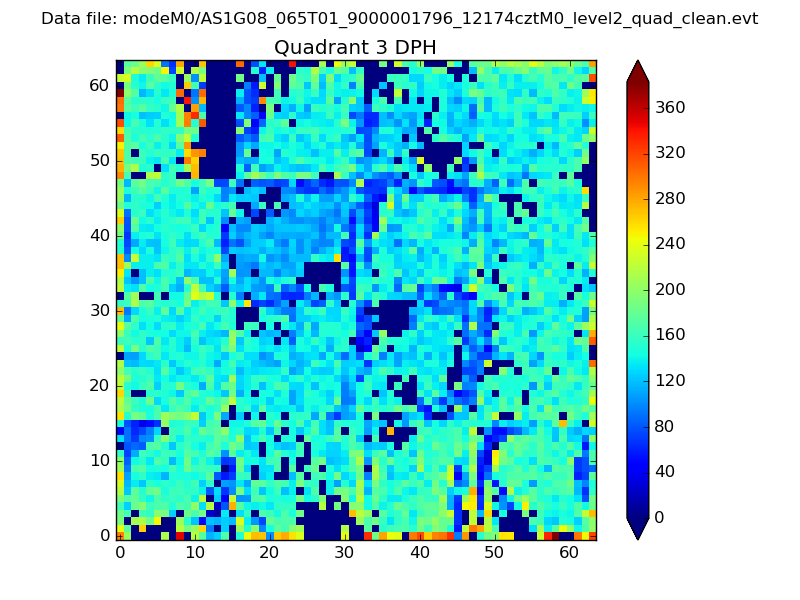 |
 |
Quadrant C |
| Plot type | Count rate plots | Images |
|---|---|---|
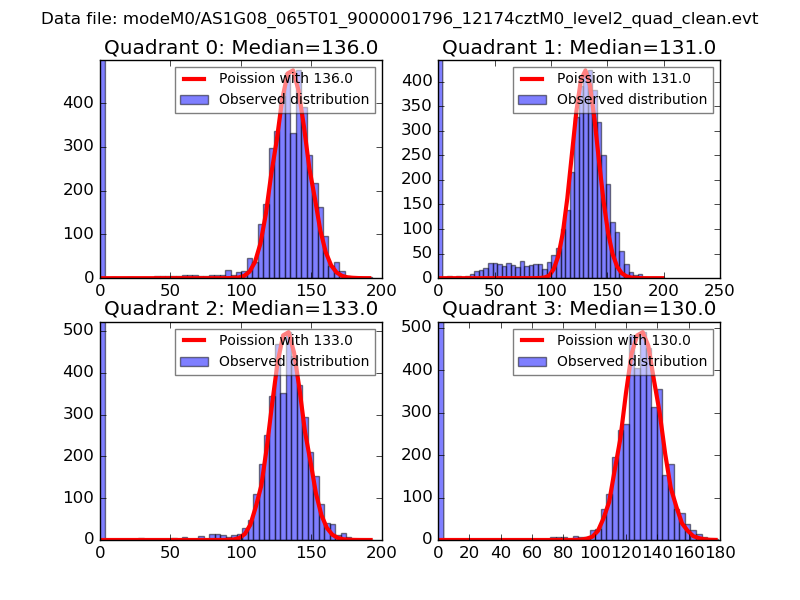
| Comparison with Poisson distribution Blue bars denote a histogram of data divided into 1 sec bins. Red curve is a Poisson curve with rate = median count rate of data. |
 |
 |
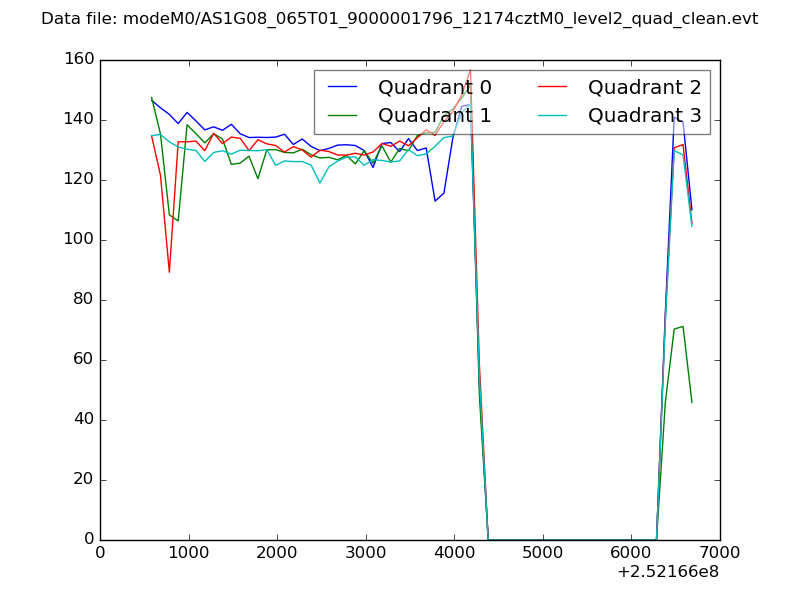
| Quadrant-wise count rates Data is divided into 100 sec bins |
 |
|
| Module-wise count rates for Quadrant A Data is divided into 100 sec bins |
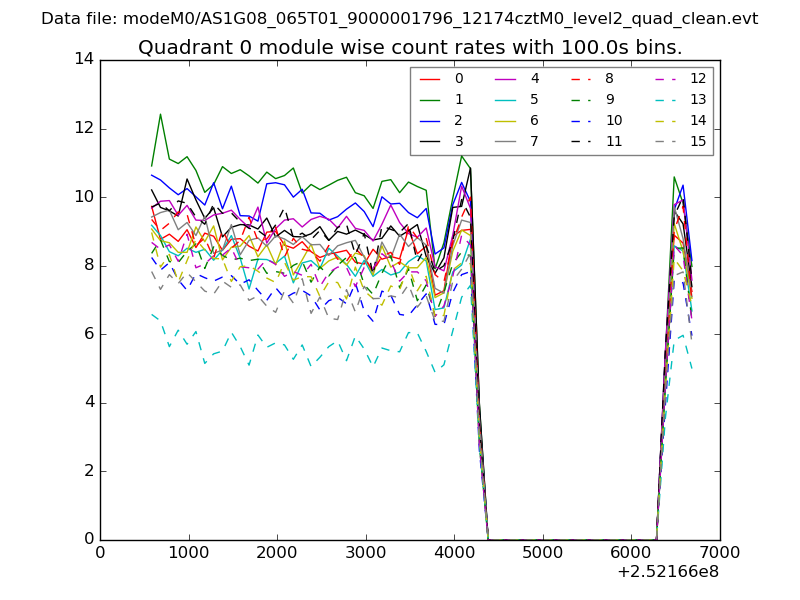 |
 |
| Module-wise count rates for Quadrant B Data is divided into 100 sec bins |
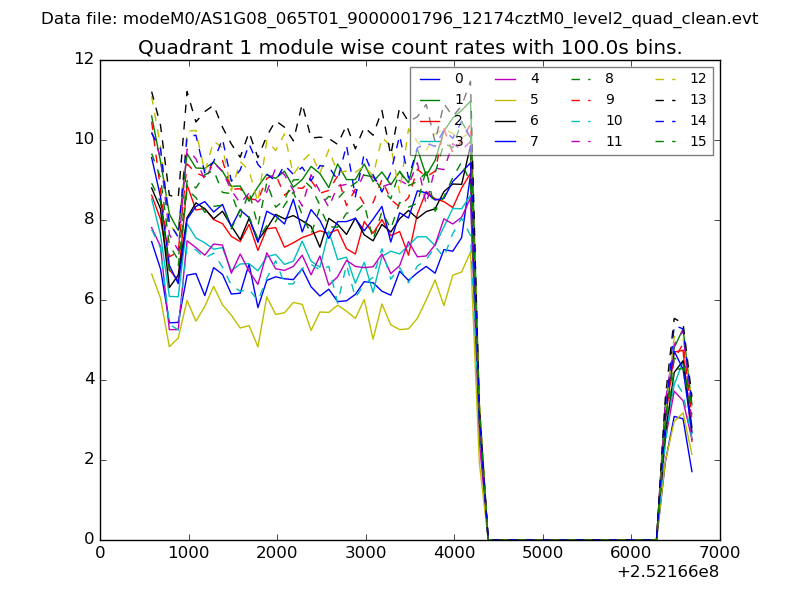 |
 |
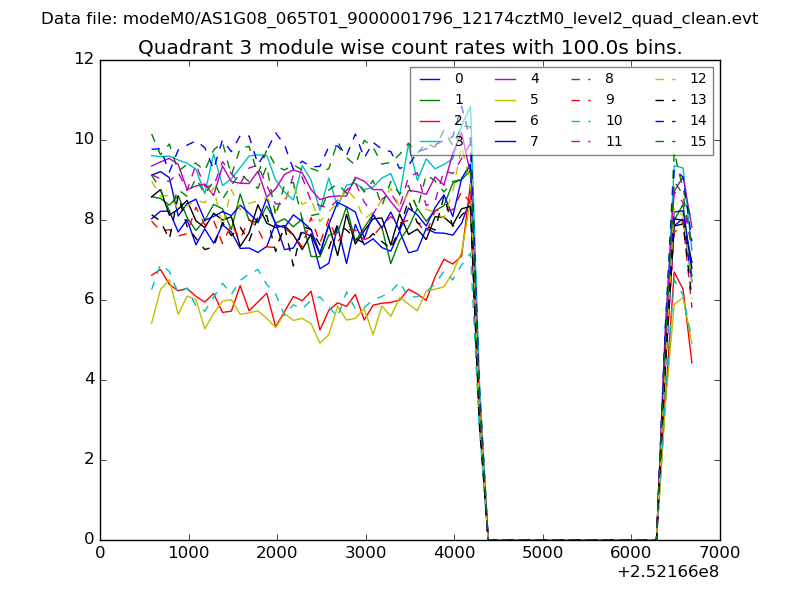
| Module-wise count rates for Quadrant C Data is divided into 100 sec bins |
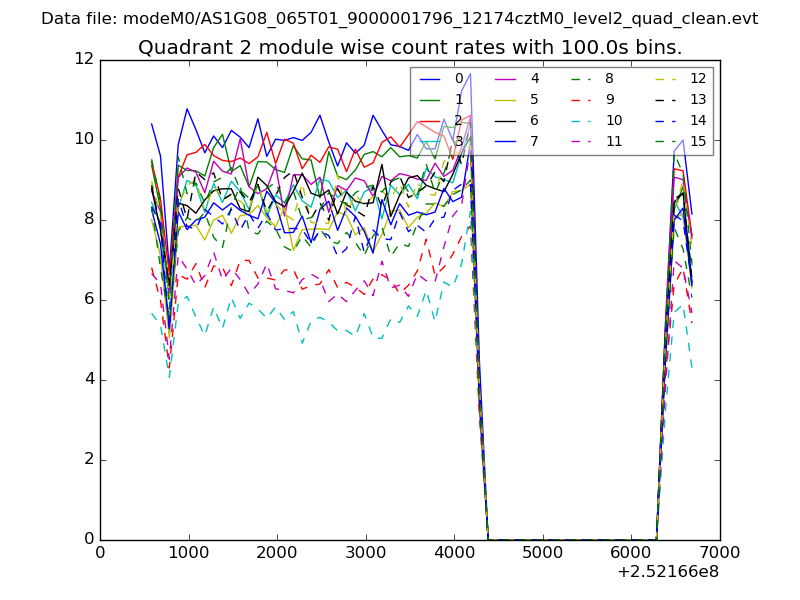 |
 |
| Module-wise count rates for Quadrant D Data is divided into 100 sec bins |
 |
 |
| Parameter | Plot |
|---|---|
| CZT HV Monitor |  |
| D_VDD | 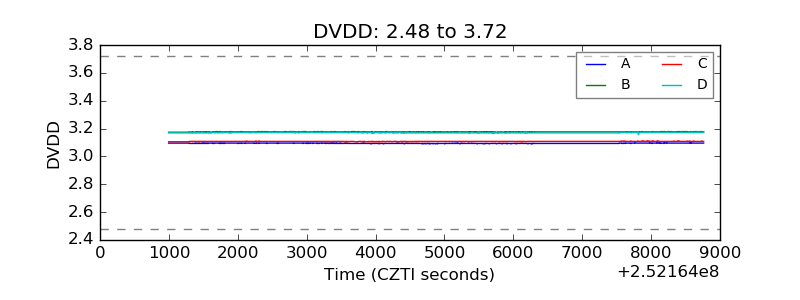 |
| Temperature 1 | 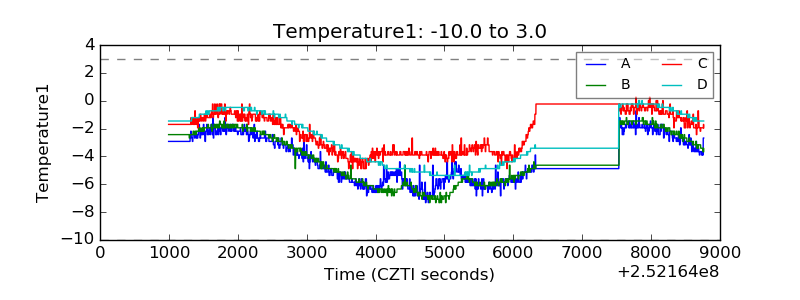 |
| Veto HV Monitor | 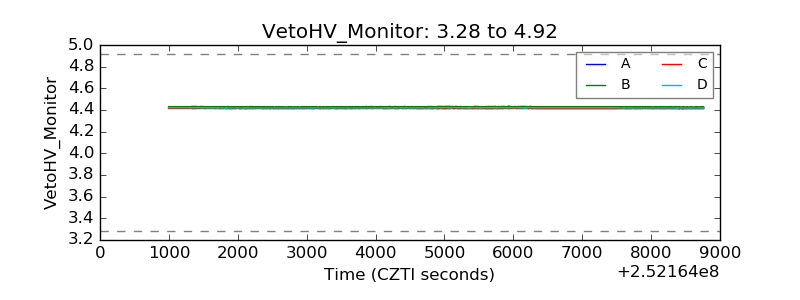 |
| Veto LLD | 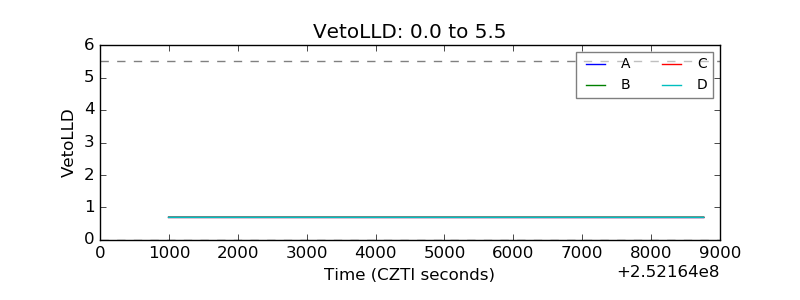 |
| Alpha Counter | 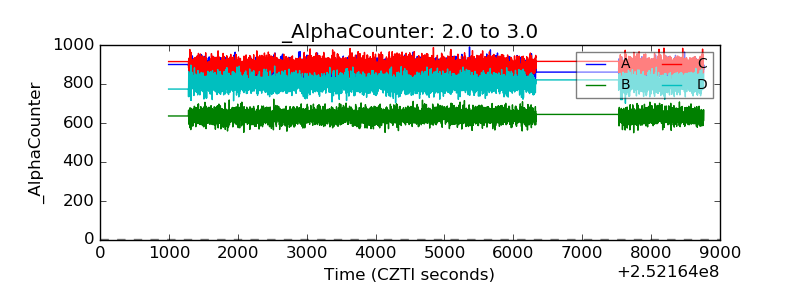 |
| _CPM_Rate | 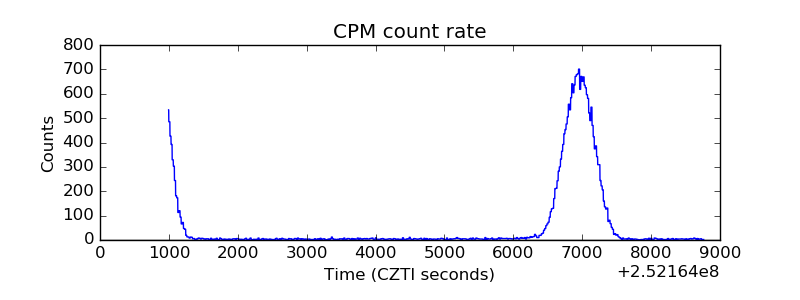 |
| CZT Counter | 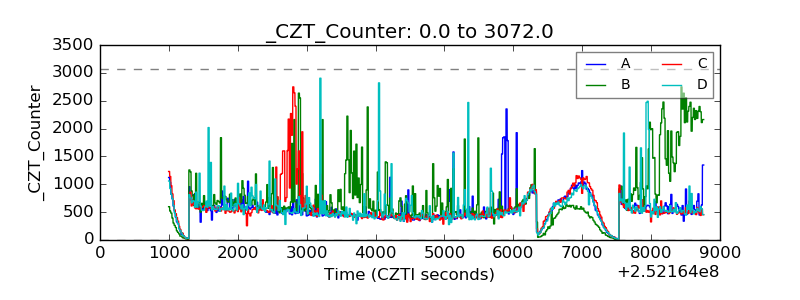 |
| +2.5 Volts monitor |  |
| +5 Volts monitor |  |
| _ROLL_ROT | 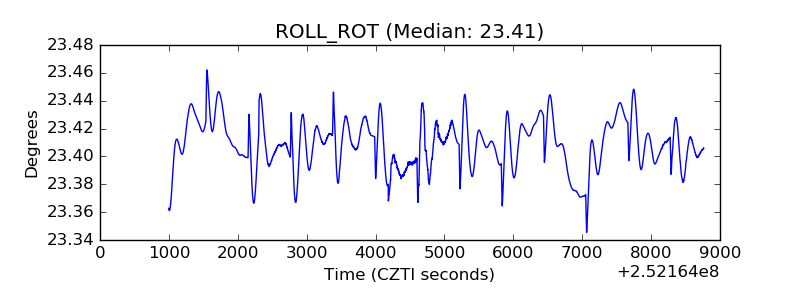 |
| _Roll_DEC | 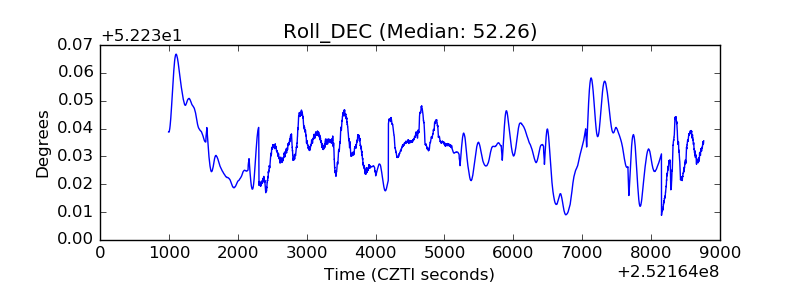 |
| _Roll_RA | 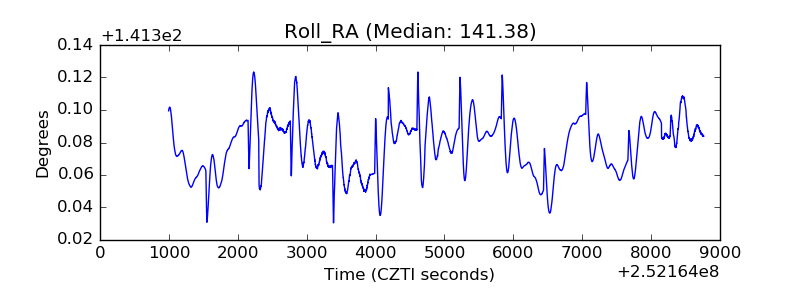 |
| Veto Counter | 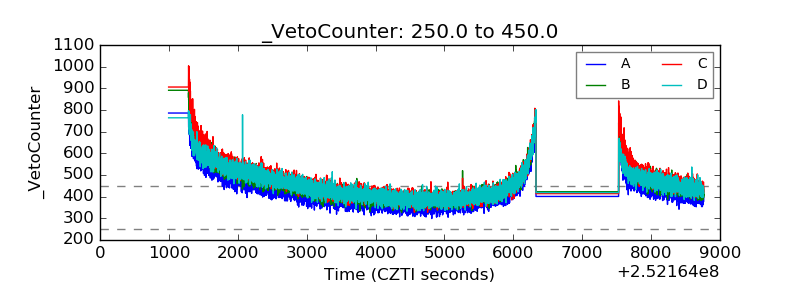 |