| Param | Original file | Final file |
|---|---|---|
| Filename | modeM0/AS1G08_065T01_9000001796_12175cztM0_level2.evt | modeM0/AS1G08_065T01_9000001796_12175cztM0_level2_quad_clean.evt |
| Size (bytes) | 579,945,600 | 96,157,440 |
| Size | 553.1 MB | 91.7 MB |
| Events in quadrant A | 3,425,381 | 636,855 |
| Events in quadrant B | 6,751,880 | 564,006 |
| Events in quadrant C | 3,204,427 | 631,962 |
| Events in quadrant D | 3,728,259 | 612,593 |
| Mode M0 | |||
|---|---|---|---|
| Quadrant | BADHDUFLAG | Total packets | Discarded packets |
| A | 0 | 14627 | 3 |
| B | 0 | 24545 | 2 |
| C | 0 | 13944 | 2 |
| D | 0 | 15615 | 2 |
| Mode M9 | |||
|---|---|---|---|
| Quadrant | BADHDUFLAG | Total packets | Discarded packets |
| A | 0 | 21 | 0 |
| B | 0 | 21 | 0 |
| C | 0 | 21 | 0 |
| D | 0 | 21 | 0 |
| Mode SS | |||
|---|---|---|---|
| Quadrant | BADHDUFLAG | Total packets | Discarded packets |
| A | 0 | 140 | 0 |
| B | 0 | 140 | 0 |
| C | 0 | 140 | 0 |
| D | 0 | 140 | 0 |
| Quadrant | Total seconds | Saturated seconds | Saturation percentage |
|---|---|---|---|
| A | 6678 | 152 | 2.276131% |
| B | 6678 | 1559 | 23.345313% |
| C | 6678 | 102 | 1.527403% |
| D | 6678 | 175 | 2.620545% |
Noise dominated data is calculated using 1-second bins in cleaned event files. If a bin has >2000 counts, and if more than 50% of those come from <1% of pixels, then it is considered to be noise-dominated and hence unusable.
| Quadrant | # 1 sec bins | Bins with >0 counts | Bins with >2000 counts | High rate bins dominated by noise | Noise dominated (total time) | Noise dominated (detector-on time) | Marked lightcurve |
|---|---|---|---|---|---|---|---|
| A | 8809 | 6681 | 4 | 4 | 0.05% | 0.06% | 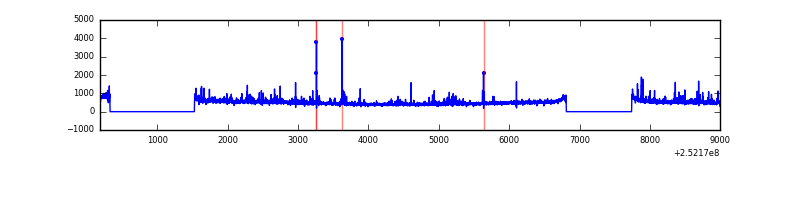 |
| B | 8809 | 6681 | 962 | 962 | 10.92% | 14.40% | 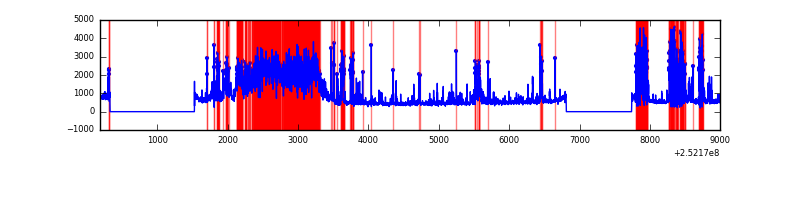 |
| C | 8809 | 6681 | 2 | 2 | 0.02% | 0.03% | 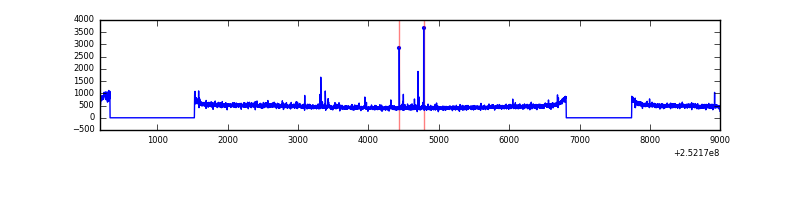 |
| D | 8809 | 6681 | 63 | 63 | 0.72% | 0.94% | 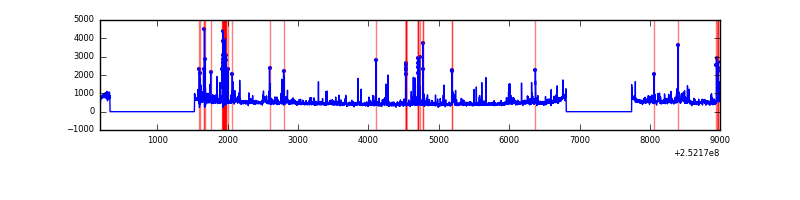 |
Top three noisy pixels from each quadrant. If the there are fewer than three noisy pixels in the level2.evt file, extra rows are filled as -1
| Pixel properties | Quadrant properties | ||||||
|---|---|---|---|---|---|---|---|
| Quadrant | DetID | PixID | Counts | Sigma | Mean | Median | Sigma |
| A | 1 | 162 | 84093 | 500.67 | 825 | 808 | 166.3 |
| A | 1 | 178 | 37387 | 219.9 | 825 | 808 | 166.3 |
| A | 1 | 161 | 34123 | 200.27 | 825 | 808 | 166.3 |
| B | 0 | 85 | 2189558 | 15339.78 | 748 | 730 | 142.7 |
| B | 4 | 239 | 1310820 | 9181.4 | 748 | 730 | 142.7 |
| B | 15 | 204 | 93794 | 652.21 | 748 | 730 | 142.7 |
| C | 3 | 233 | 24458 | 127.67 | 805 | 809 | 185.2 |
| C | 15 | 208 | 22655 | 117.93 | 805 | 809 | 185.2 |
| C | 14 | 234 | 12985 | 65.73 | 805 | 809 | 185.2 |
| D | 1 | 52 | 191193 | 989.33 | 802 | 781 | 192.5 |
| D | 4 | 95 | 117780 | 607.89 | 802 | 781 | 192.5 |
| D | 13 | 104 | 100607 | 518.67 | 802 | 781 | 192.5 |
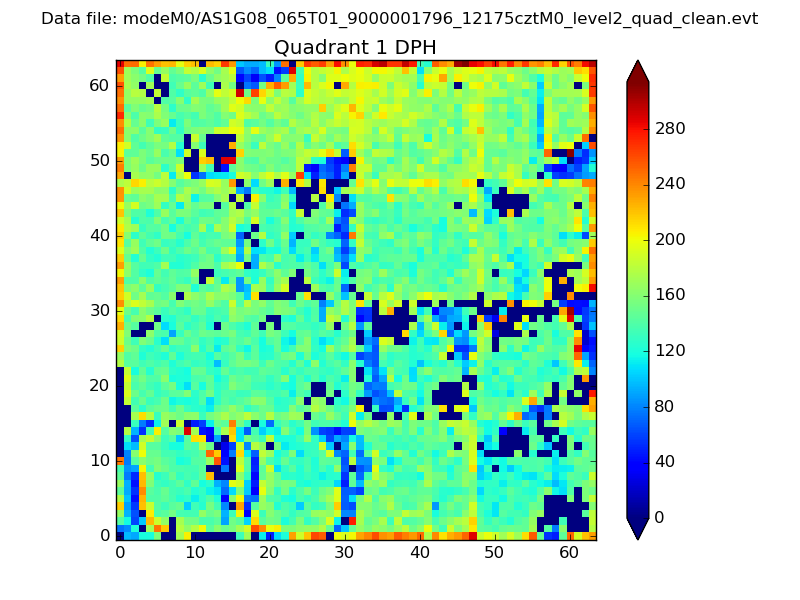
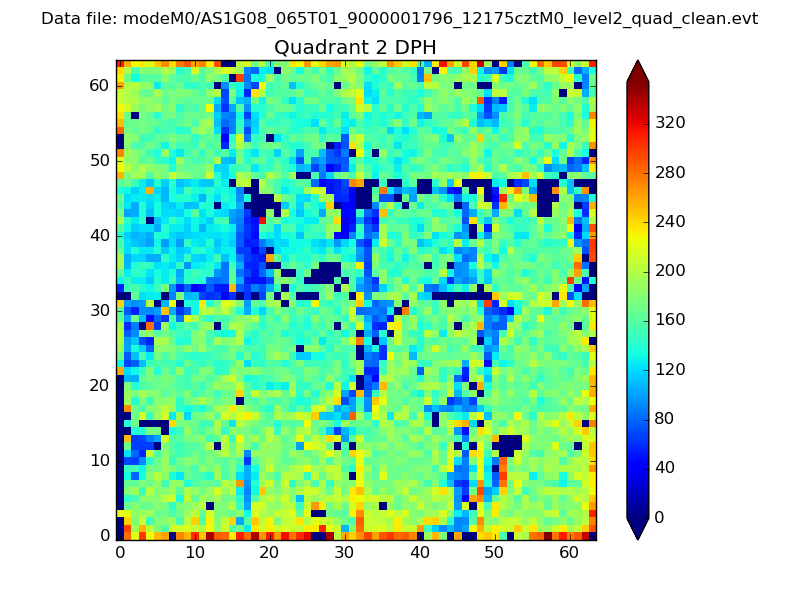
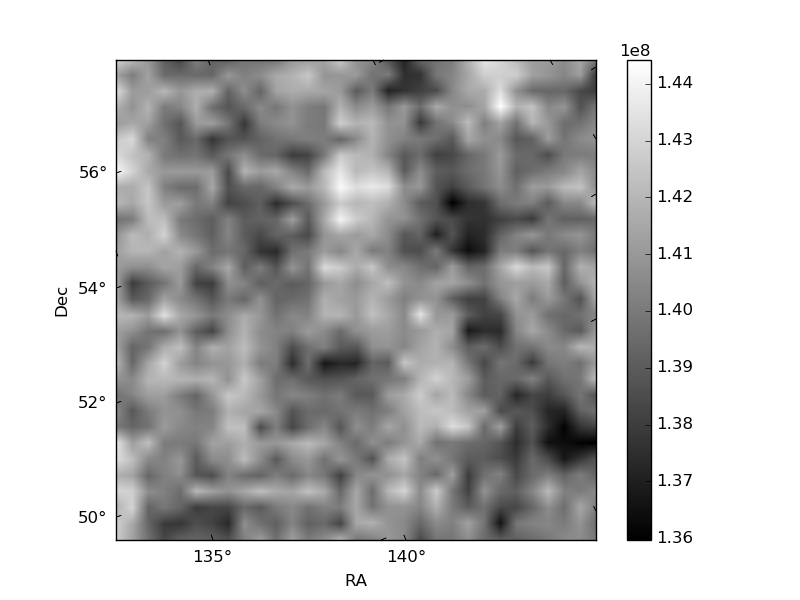
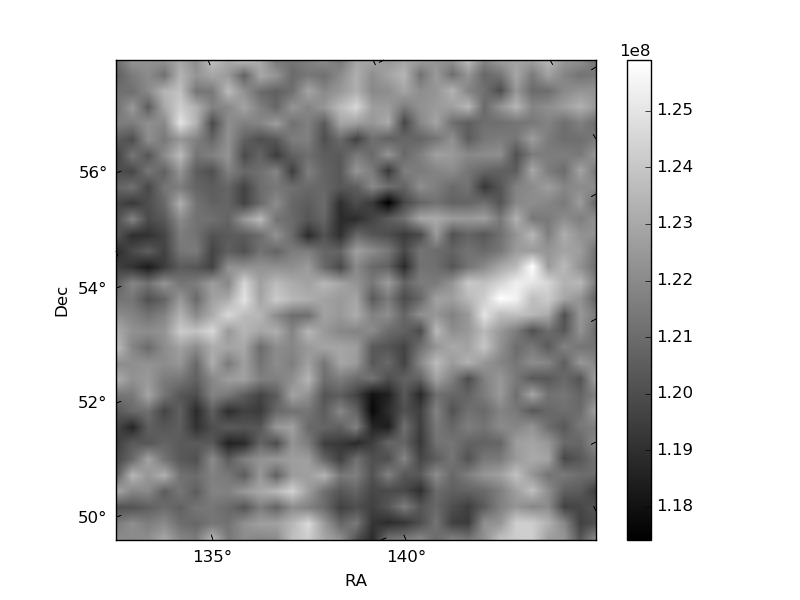
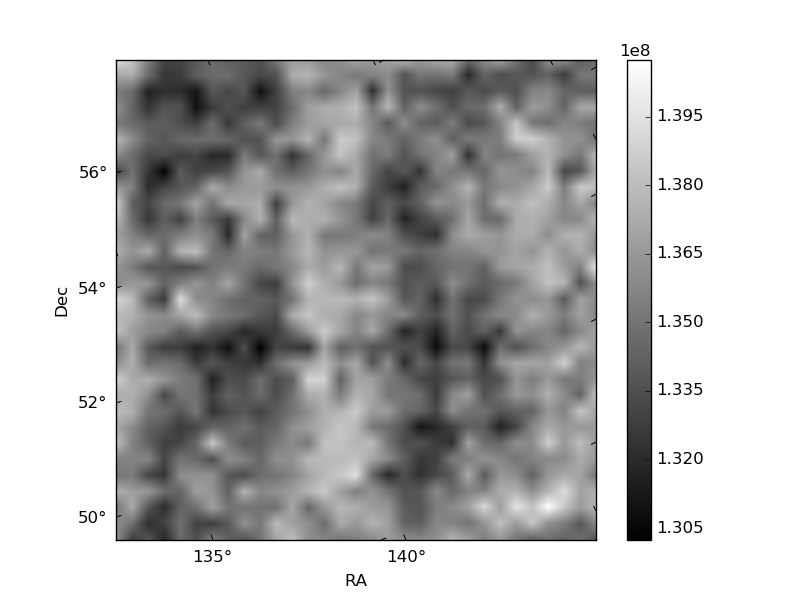
Histogram calculated using DETX and DETY for each event in the final _common_clean file
| Quadrant A |  |
 |
Quadrant B |
|---|---|---|---|
| Quadrant D | 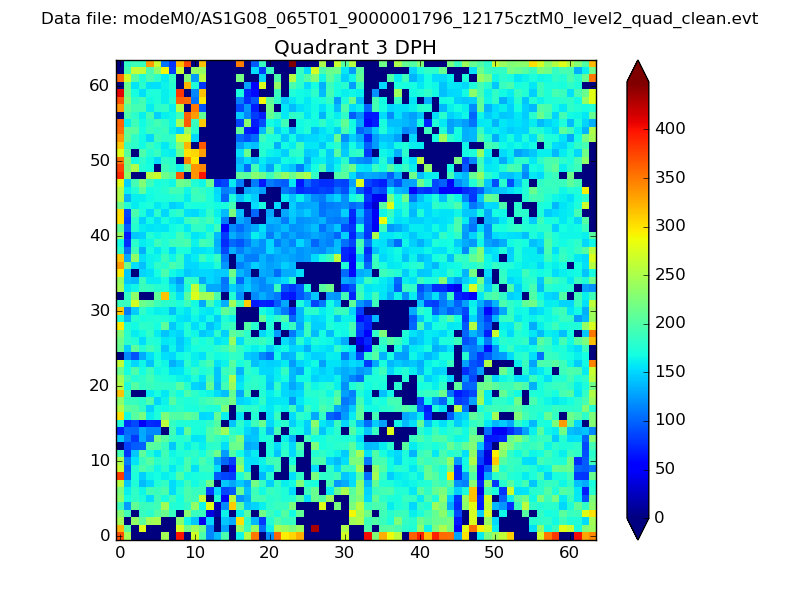 |
 |
Quadrant C |
| Plot type | Count rate plots | Images |
|---|---|---|
| Comparison with Poisson distribution Blue bars denote a histogram of data divided into 1 sec bins. Red curve is a Poisson curve with rate = median count rate of data. |
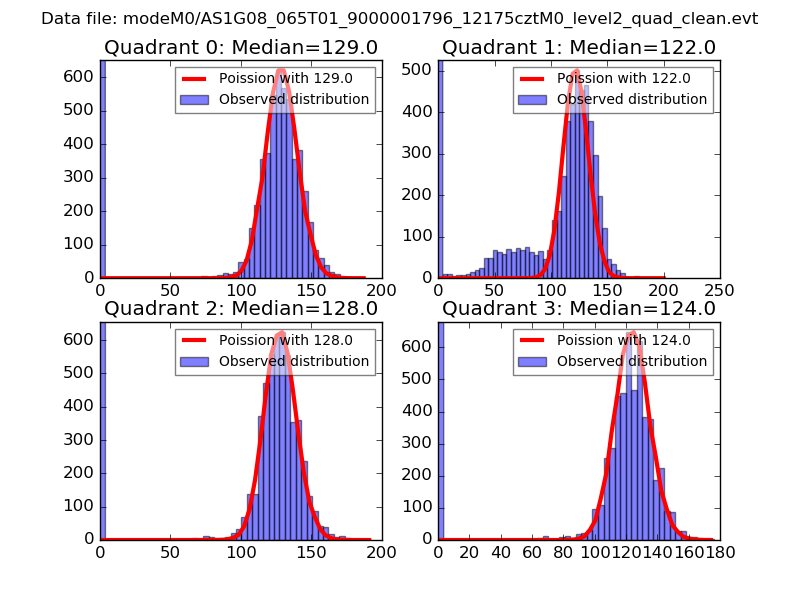 |
 |
| Quadrant-wise count rates Data is divided into 100 sec bins |
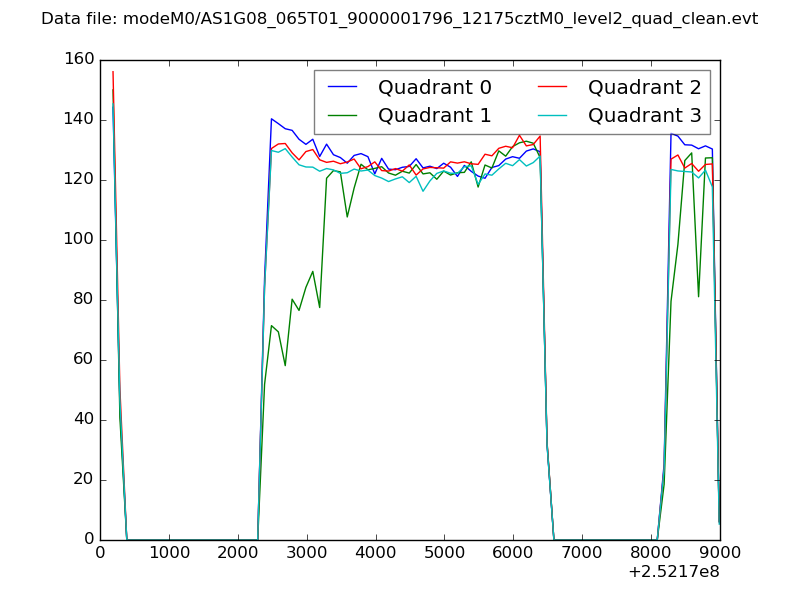 |
|
| Module-wise count rates for Quadrant A Data is divided into 100 sec bins |
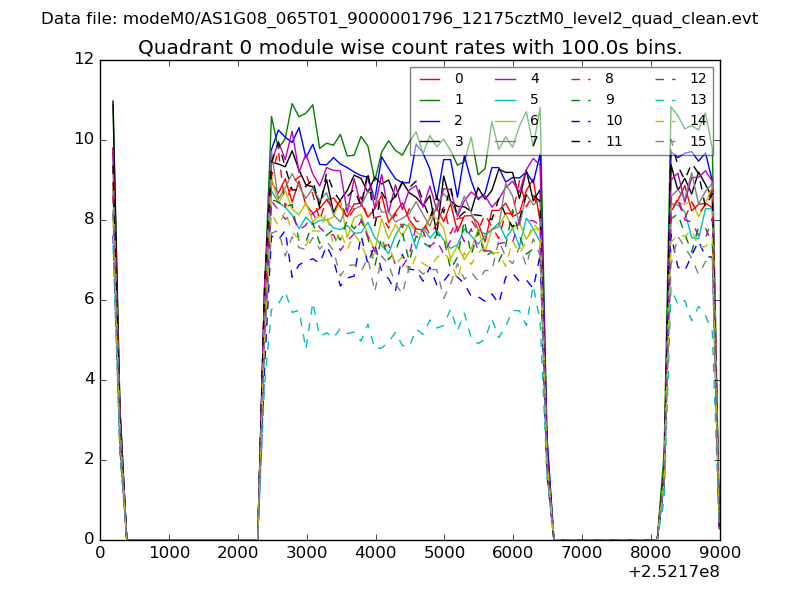 |
 |
| Module-wise count rates for Quadrant B Data is divided into 100 sec bins |
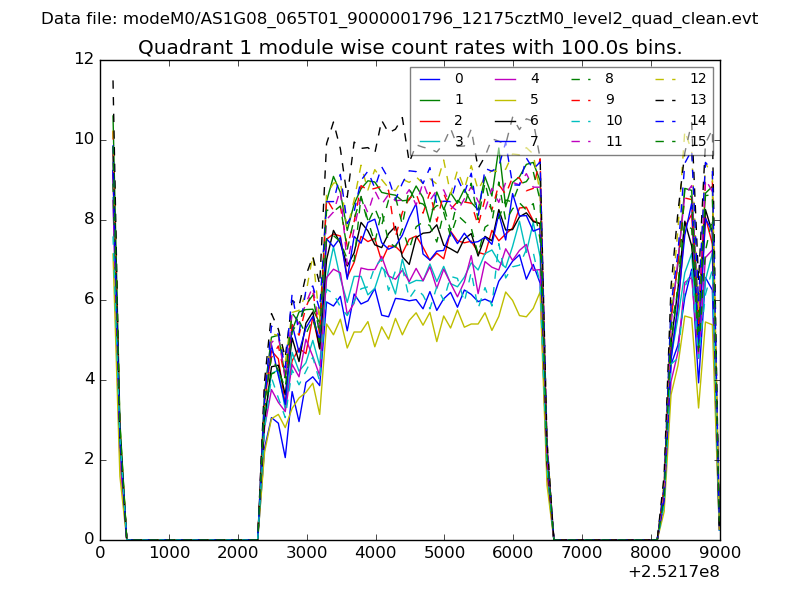 |
 |
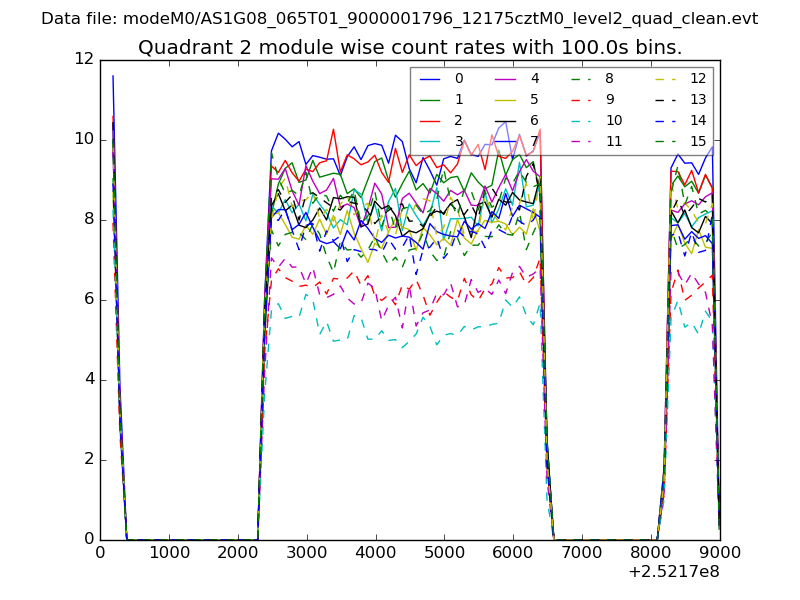
| Module-wise count rates for Quadrant C Data is divided into 100 sec bins |
 |
 |
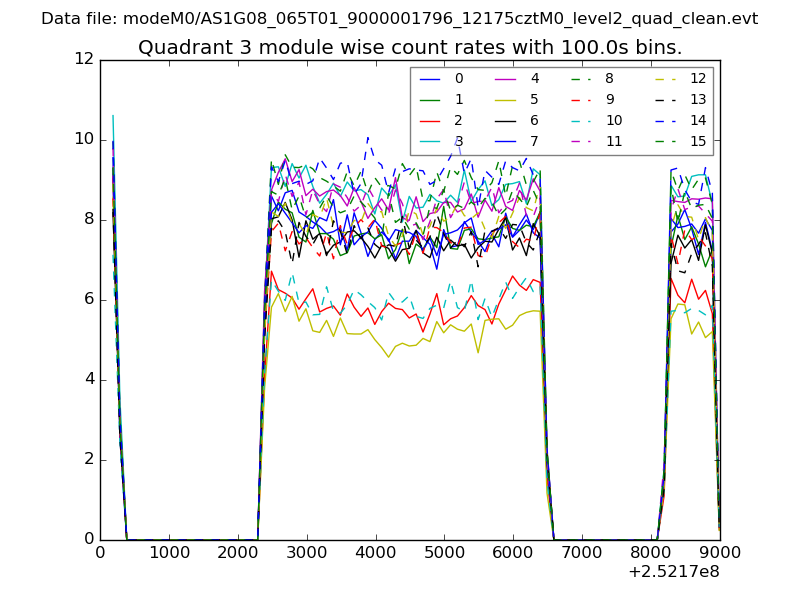
| Module-wise count rates for Quadrant D Data is divided into 100 sec bins |
 |
 |
| Parameter | Plot |
|---|---|
| CZT HV Monitor | 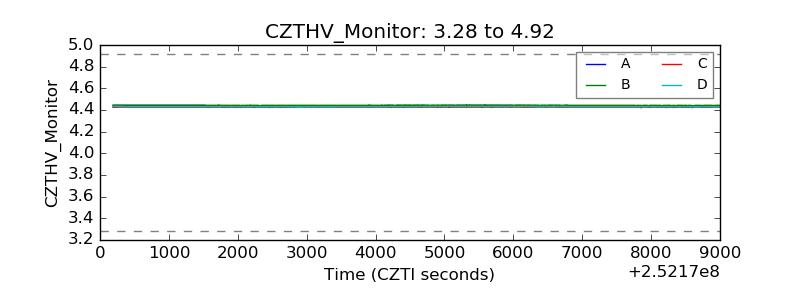 |
| D_VDD | 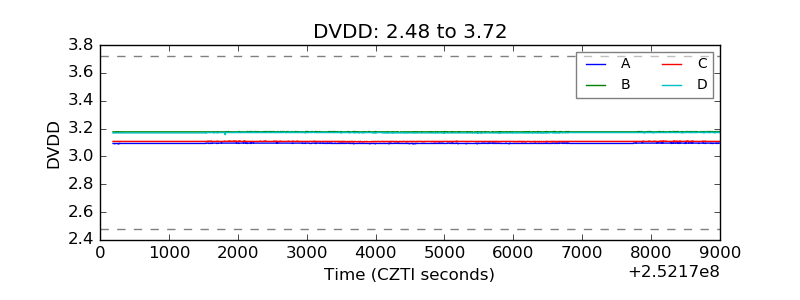 |
| Temperature 1 | 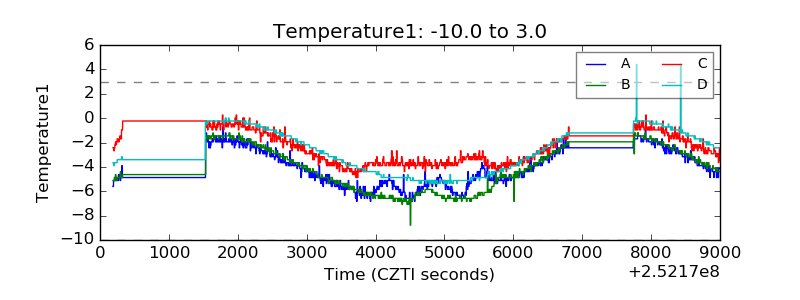 |
| Veto HV Monitor | 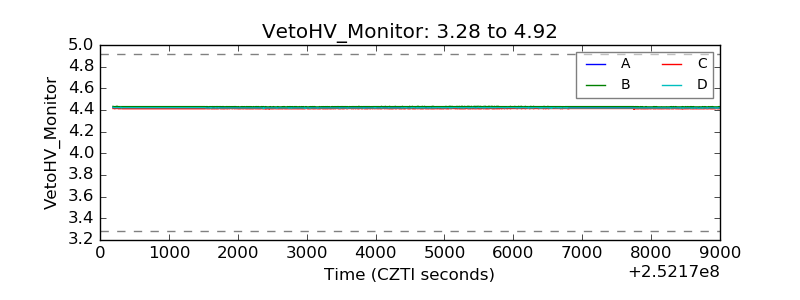 |
| Veto LLD | 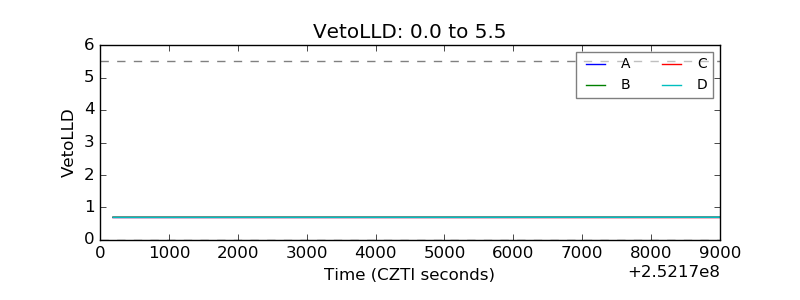 |
| Alpha Counter | 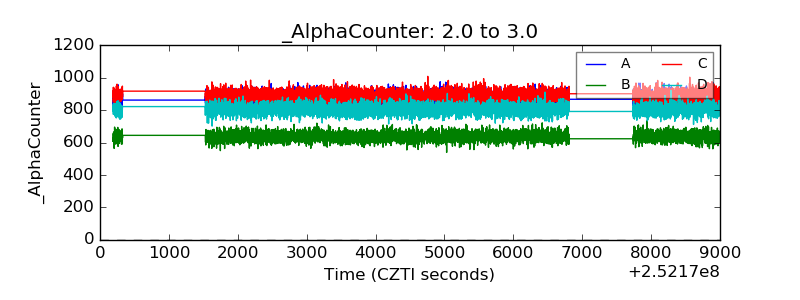 |
| _CPM_Rate | 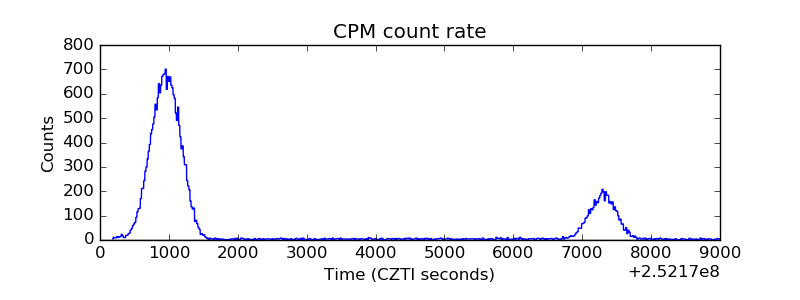 |
| CZT Counter | 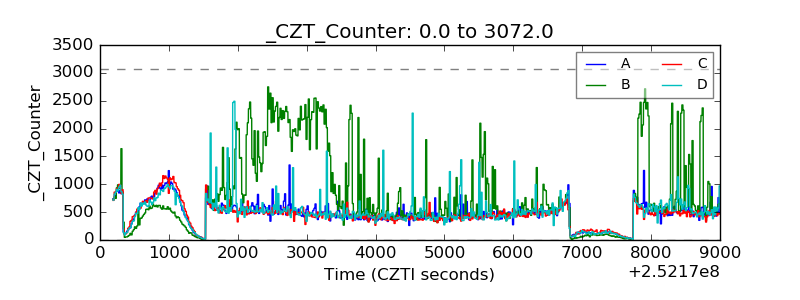 |
| +2.5 Volts monitor |  |
| +5 Volts monitor |  |
| _ROLL_ROT | 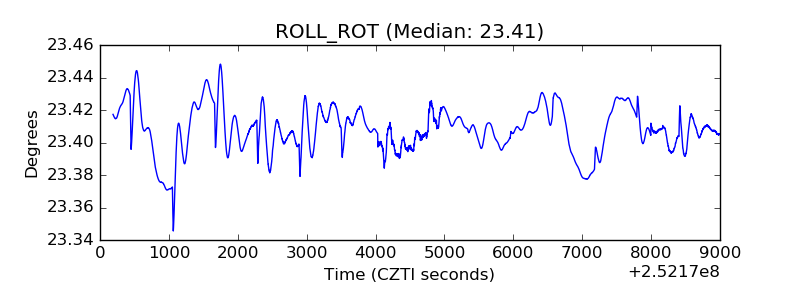 |
| _Roll_DEC | 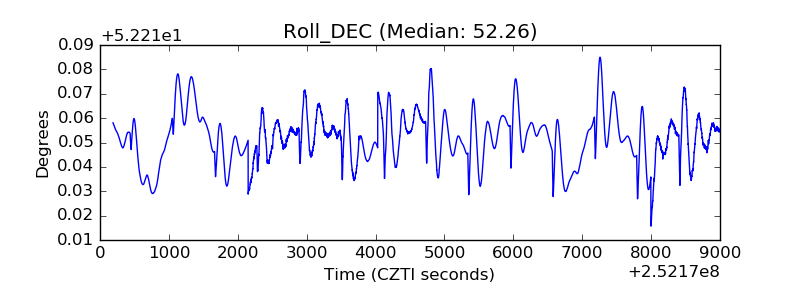 |
| _Roll_RA |  |
| Veto Counter | 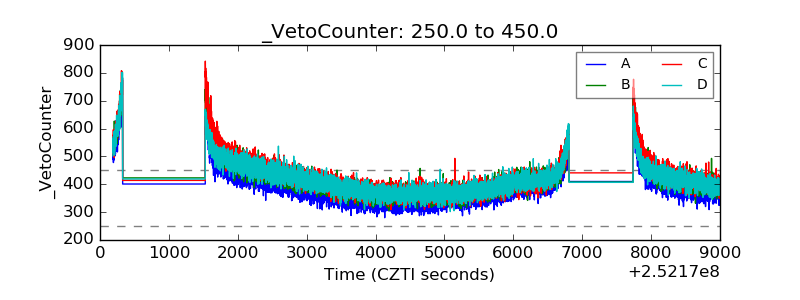 |