| Param | Original file | Final file |
|---|---|---|
| Filename | modeM0/AS1A04_160T01_9000001798_12178cztM0_level2.evt | modeM0/AS1A04_160T01_9000001798_12178cztM0_level2_quad_clean.evt |
| Size (bytes) | 636,284,160 | 132,704,640 |
| Size | 606.8 MB | 126.6 MB |
| Events in quadrant A | 3,823,448 | 906,613 |
| Events in quadrant B | 7,073,894 | 826,951 |
| Events in quadrant C | 3,311,727 | 901,246 |
| Events in quadrant D | 4,546,291 | 855,883 |
| Mode SS | |||
|---|---|---|---|
| Quadrant | BADHDUFLAG | Total packets | Discarded packets |
| A | 0 | 152 | 0 |
| B | 0 | 152 | 0 |
| C | 0 | 152 | 0 |
| D | 0 | 152 | 0 |
| Mode M9 | |||
|---|---|---|---|
| Quadrant | BADHDUFLAG | Total packets | Discarded packets |
| A | 0 | 3 | 0 |
| B | 0 | 3 | 0 |
| C | 0 | 3 | 0 |
| D | 0 | 3 | 0 |
| Mode M0 | |||
|---|---|---|---|
| Quadrant | BADHDUFLAG | Total packets | Discarded packets |
| A | 0 | 16622 | 2 |
| B | 0 | 26205 | 1 |
| C | 0 | 15430 | 1 |
| D | 0 | 18649 | 1 |
| Quadrant | Total seconds | Saturated seconds | Saturation percentage |
|---|---|---|---|
| A | 7598 | 101 | 1.329297% |
| B | 7598 | 1349 | 17.754672% |
| C | 7598 | 27 | 0.355357% |
| D | 7598 | 124 | 1.632008% |
Noise dominated data is calculated using 1-second bins in cleaned event files. If a bin has >2000 counts, and if more than 50% of those come from <1% of pixels, then it is considered to be noise-dominated and hence unusable.
| Quadrant | # 1 sec bins | Bins with >0 counts | Bins with >2000 counts | High rate bins dominated by noise | Noise dominated (total time) | Noise dominated (detector-on time) | Marked lightcurve |
|---|---|---|---|---|---|---|---|
| A | 7844 | 7600 | 4 | 4 | 0.05% | 0.05% |  |
| B | 7844 | 7600 | 818 | 818 | 10.43% | 10.76% |  |
| C | 7844 | 7600 | 2 | 2 | 0.03% | 0.03% |  |
| D | 7844 | 7600 | 67 | 67 | 0.85% | 0.88% |  |
Top three noisy pixels from each quadrant. If the there are fewer than three noisy pixels in the level2.evt file, extra rows are filled as -1
| Pixel properties | Quadrant properties | ||||||
|---|---|---|---|---|---|---|---|
| Quadrant | DetID | PixID | Counts | Sigma | Mean | Median | Sigma |
| A | 1 | 162 | 142696 | 805.79 | 863 | 843 | 176.0 |
| A | 1 | 178 | 72960 | 409.66 | 863 | 843 | 176.0 |
| A | 1 | 161 | 65172 | 365.42 | 863 | 843 | 176.0 |
| B | 4 | 239 | 2540819 | 16801.54 | 797 | 777 | 151.2 |
| B | 10 | 16 | 356609 | 2353.71 | 797 | 777 | 151.2 |
| B | 3 | 64 | 329738 | 2175.97 | 797 | 777 | 151.2 |
| C | 15 | 208 | 31467 | 158.66 | 836 | 839 | 193.0 |
| C | 0 | 207 | 11620 | 55.85 | 836 | 839 | 193.0 |
| C | 13 | 61 | 6117 | 27.34 | 836 | 839 | 193.0 |
| D | 8 | 195 | 347817 | 1729.45 | 824 | 796 | 200.7 |
| D | 10 | 157 | 323979 | 1610.65 | 824 | 796 | 200.7 |
| D | 1 | 52 | 274407 | 1363.6 | 824 | 796 | 200.7 |
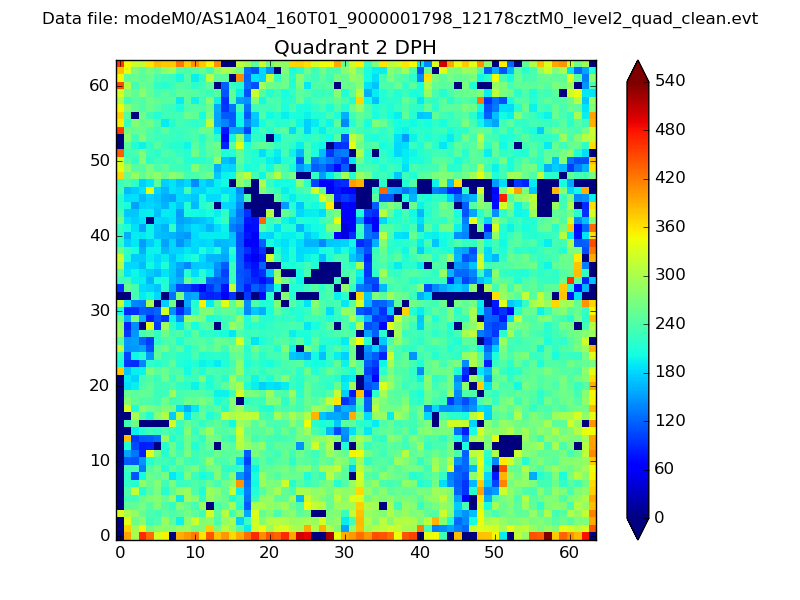
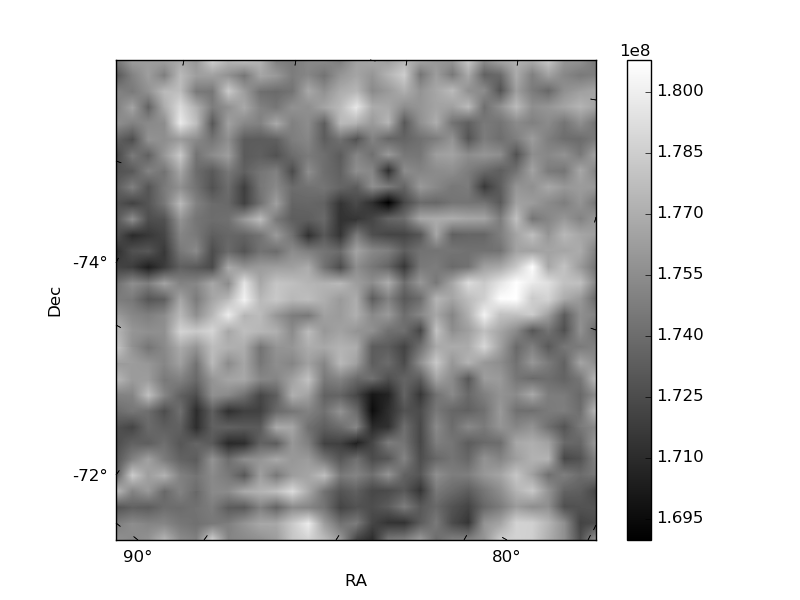
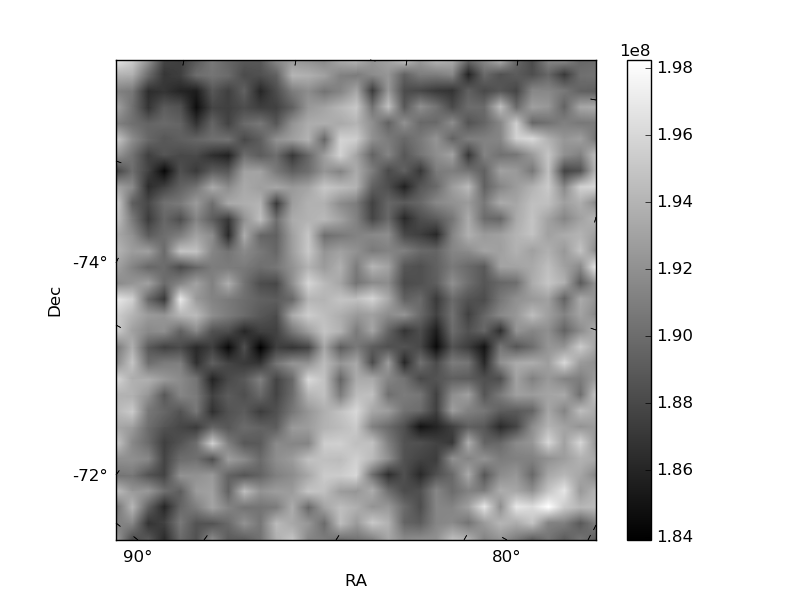
Histogram calculated using DETX and DETY for each event in the final _common_clean file
| Quadrant A | 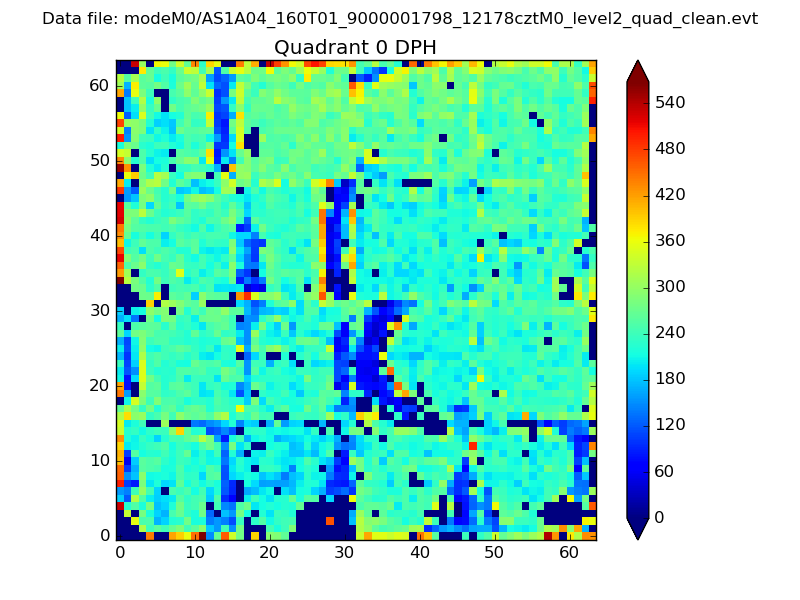 |
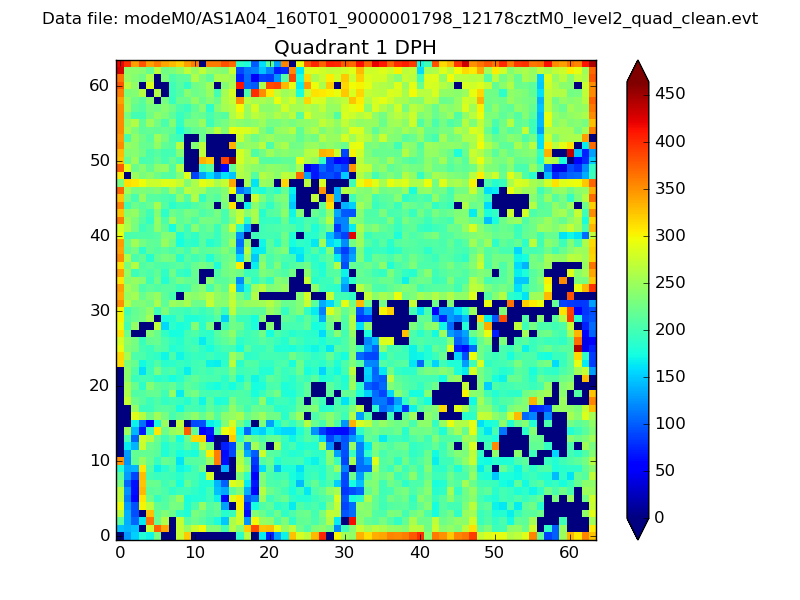 |
Quadrant B |
|---|---|---|---|
| Quadrant D | 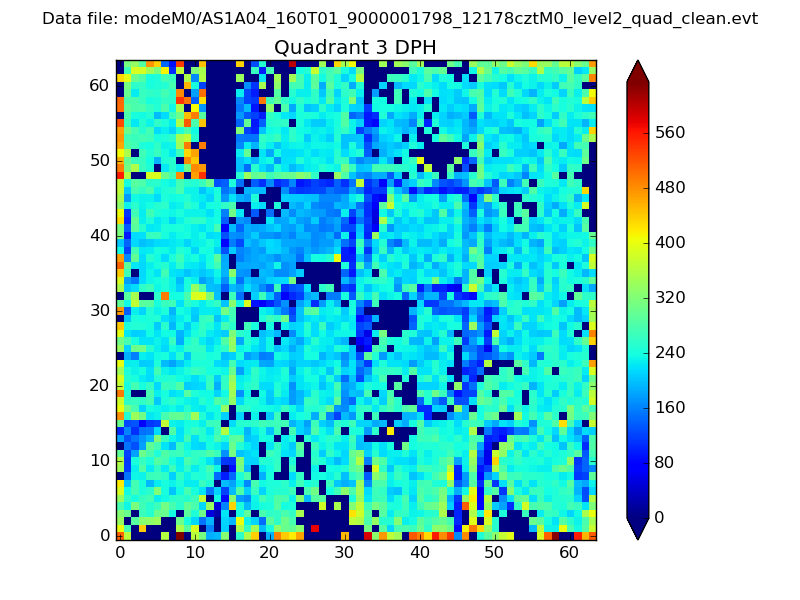 |
 |
Quadrant C |
| Plot type | Count rate plots | Images |
|---|---|---|
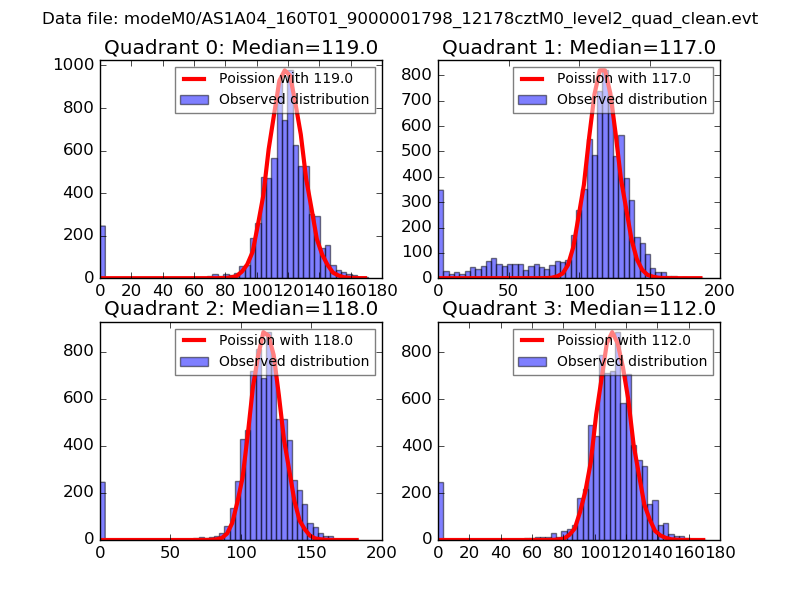
| Comparison with Poisson distribution Blue bars denote a histogram of data divided into 1 sec bins. Red curve is a Poisson curve with rate = median count rate of data. |
 |
 |
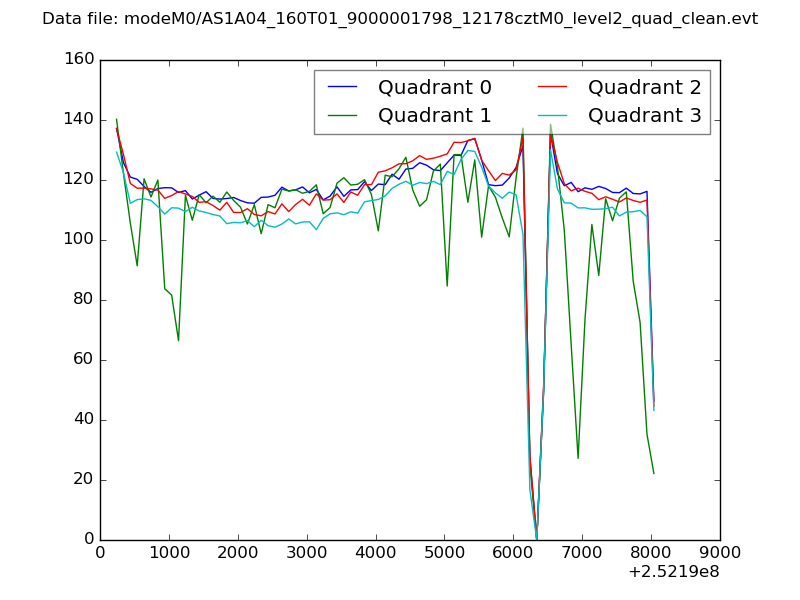
| Quadrant-wise count rates Data is divided into 100 sec bins |
 |
|
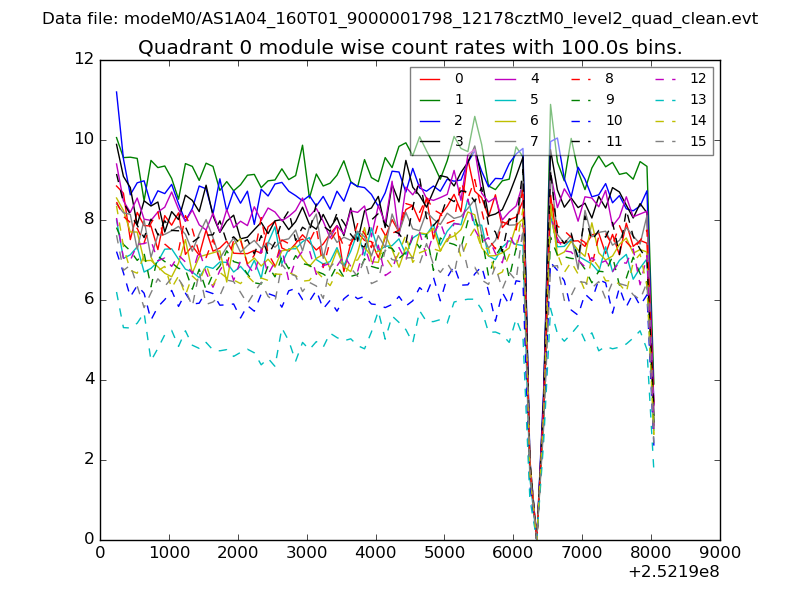
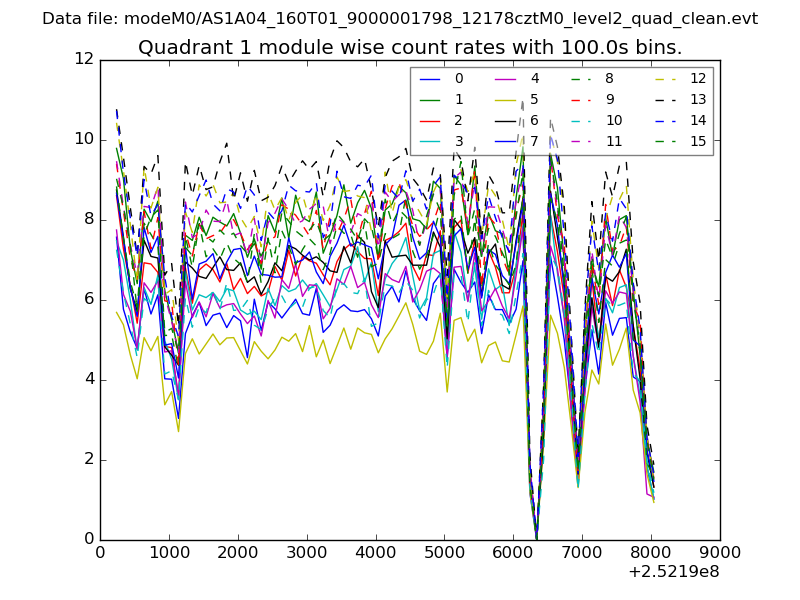
| Module-wise count rates for Quadrant A Data is divided into 100 sec bins |
 |
 |
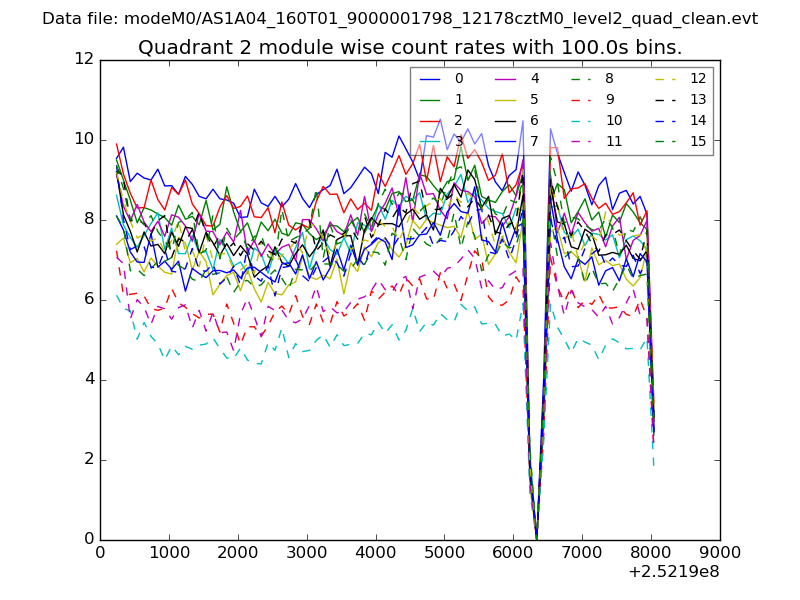
| Module-wise count rates for Quadrant B Data is divided into 100 sec bins |
 |
 |
| Module-wise count rates for Quadrant C Data is divided into 100 sec bins |
 |
 |
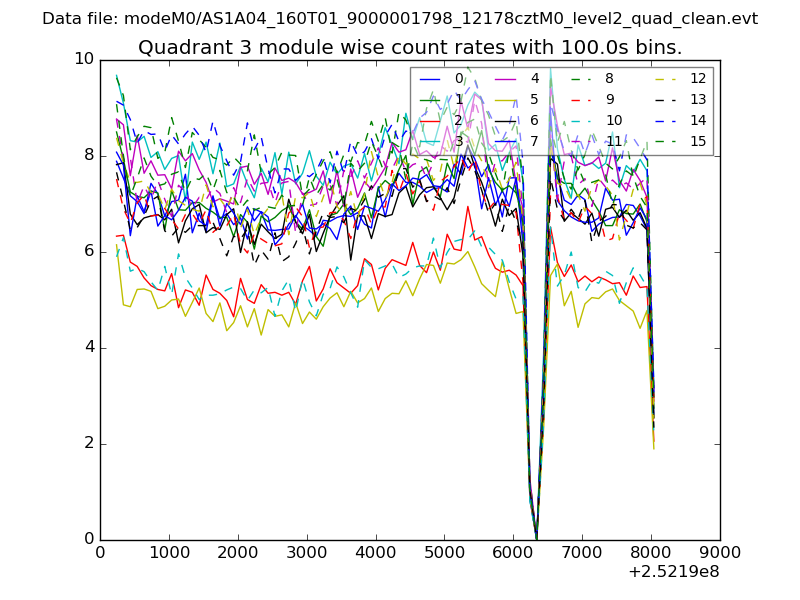
| Module-wise count rates for Quadrant D Data is divided into 100 sec bins |
 |
 |
| Parameter | Plot |
|---|---|
| CZT HV Monitor | 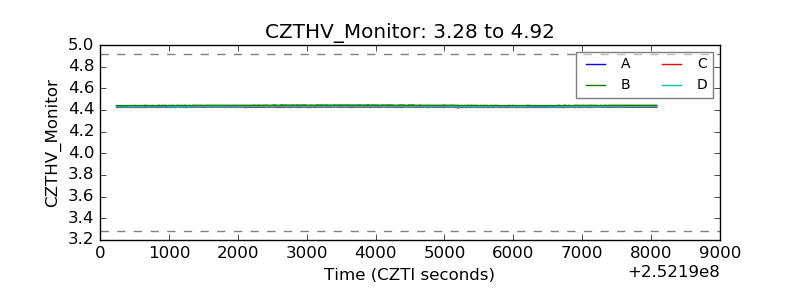 |
| D_VDD | 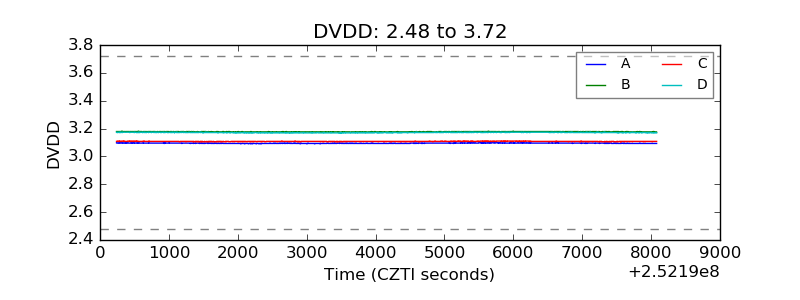 |
| Temperature 1 | 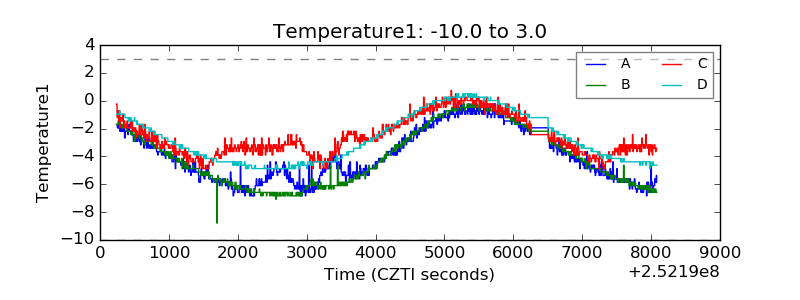 |
| Veto HV Monitor | 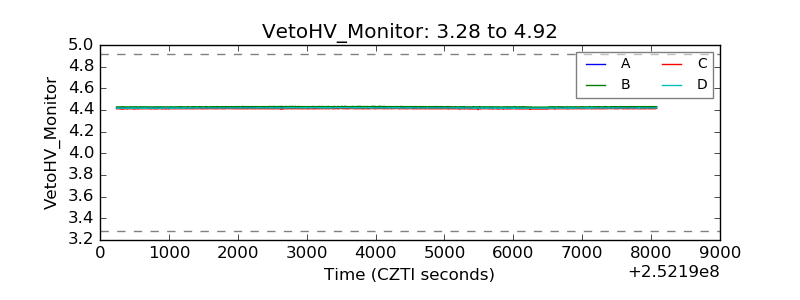 |
| Veto LLD | 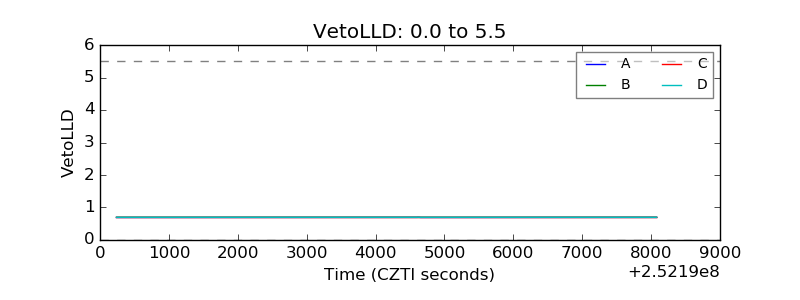 |
| Alpha Counter | 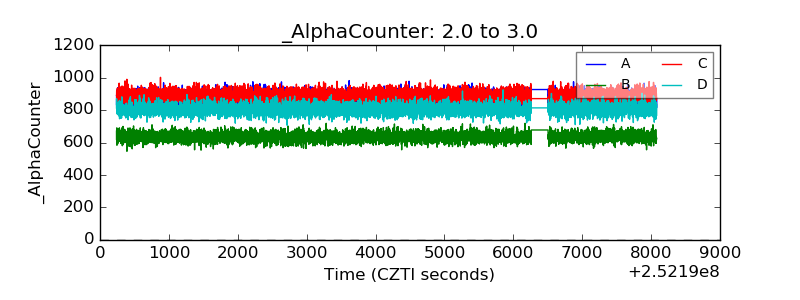 |
| _CPM_Rate | 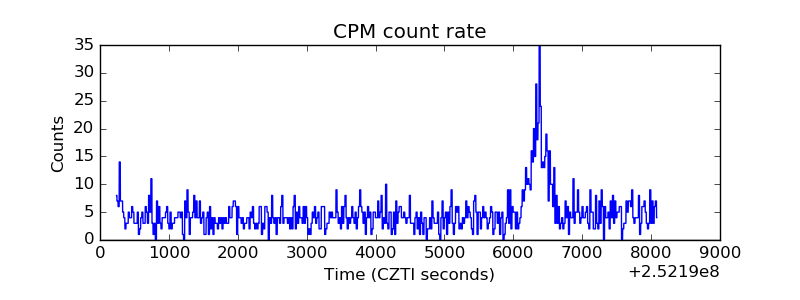 |
| CZT Counter | 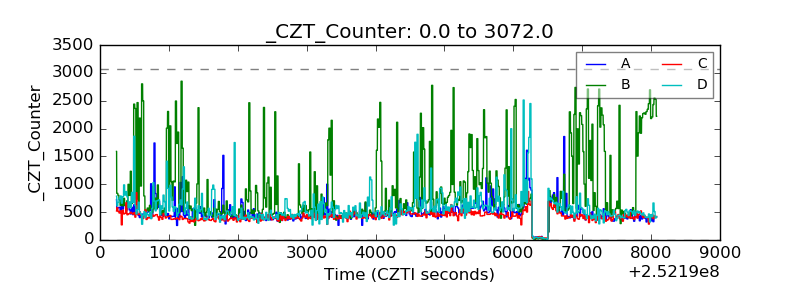 |
| +2.5 Volts monitor | 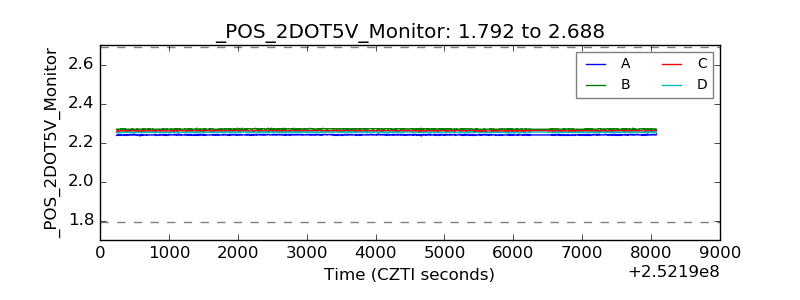 |
| +5 Volts monitor | 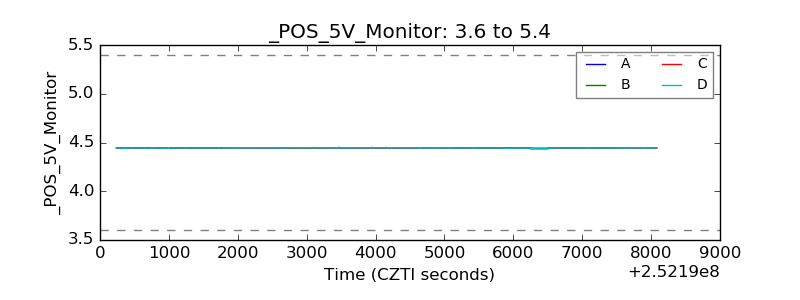 |
| _ROLL_ROT | 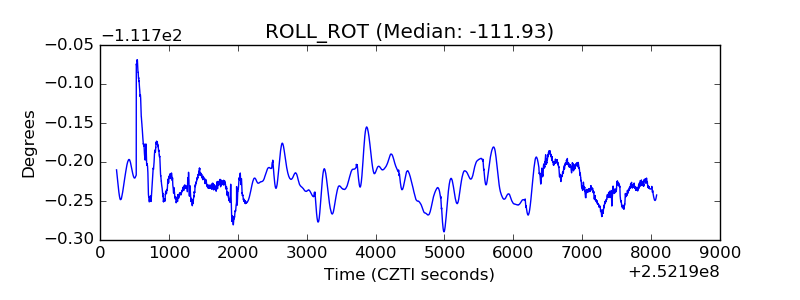 |
| _Roll_DEC | 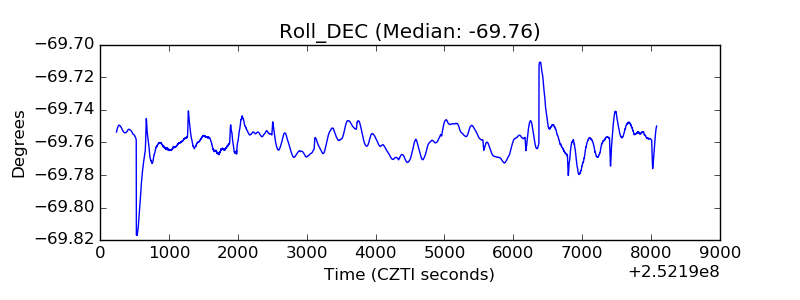 |
| _Roll_RA | 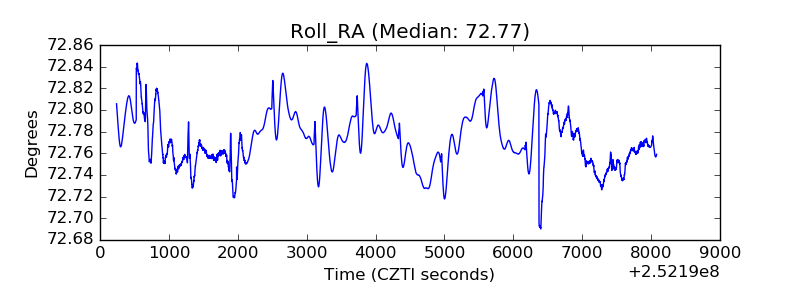 |
| Veto Counter | 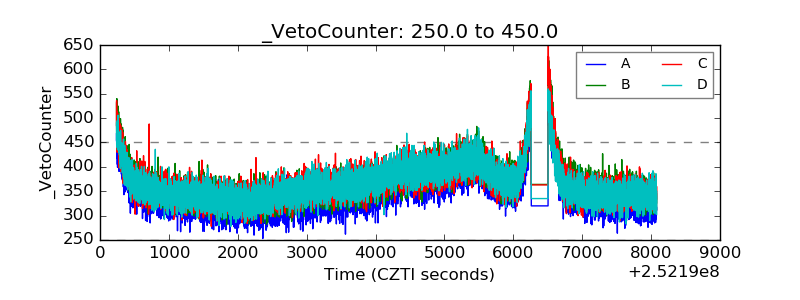 |