| Param | Original file | Final file |
|---|---|---|
| Filename | modeM0/AS1A04_160T01_9000001798_12180cztM0_level2.evt | modeM0/AS1A04_160T01_9000001798_12180cztM0_level2_quad_clean.evt |
| Size (bytes) | 740,531,520 | 157,639,680 |
| Size | 706.2 MB | 150.3 MB |
| Events in quadrant A | 4,229,411 | 1,075,773 |
| Events in quadrant B | 8,313,190 | 989,400 |
| Events in quadrant C | 4,092,763 | 1,063,399 |
| Events in quadrant D | 5,175,369 | 1,014,421 |
| Mode SS | |||
|---|---|---|---|
| Quadrant | BADHDUFLAG | Total packets | Discarded packets |
| A | 0 | 184 | 0 |
| B | 0 | 184 | 0 |
| C | 0 | 184 | 0 |
| D | 0 | 184 | 0 |
| Mode M9 | |||
|---|---|---|---|
| Quadrant | BADHDUFLAG | Total packets | Discarded packets |
| A | 0 | 7 | 0 |
| B | 0 | 7 | 0 |
| C | 0 | 7 | 0 |
| D | 0 | 7 | 0 |
| Mode M0 | |||
|---|---|---|---|
| Quadrant | BADHDUFLAG | Total packets | Discarded packets |
| A | 0 | 19123 | 3 |
| B | 0 | 30912 | 2 |
| C | 0 | 18803 | 2 |
| D | 0 | 21603 | 2 |
| Quadrant | Total seconds | Saturated seconds | Saturation percentage |
|---|---|---|---|
| A | 9095 | 175 | 1.924134% |
| B | 9095 | 1530 | 16.822430% |
| C | 9095 | 53 | 0.582738% |
| D | 9095 | 165 | 1.814184% |
Noise dominated data is calculated using 1-second bins in cleaned event files. If a bin has >2000 counts, and if more than 50% of those come from <1% of pixels, then it is considered to be noise-dominated and hence unusable.
| Quadrant | # 1 sec bins | Bins with >0 counts | Bins with >2000 counts | High rate bins dominated by noise | Noise dominated (total time) | Noise dominated (detector-on time) | Marked lightcurve |
|---|---|---|---|---|---|---|---|
| A | 9811 | 9098 | 1 | 1 | 0.01% | 0.01% | 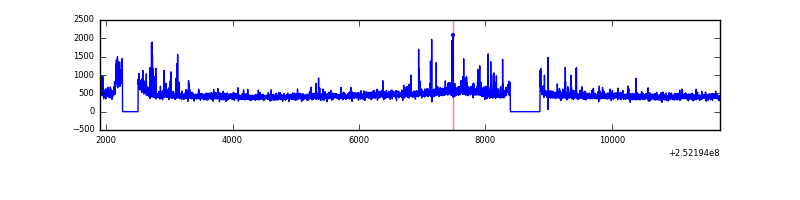 |
| B | 9811 | 9098 | 958 | 958 | 9.76% | 10.53% | 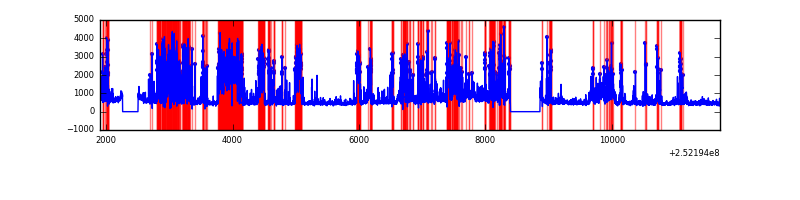 |
| C | 9811 | 9098 | 8 | 8 | 0.08% | 0.09% | 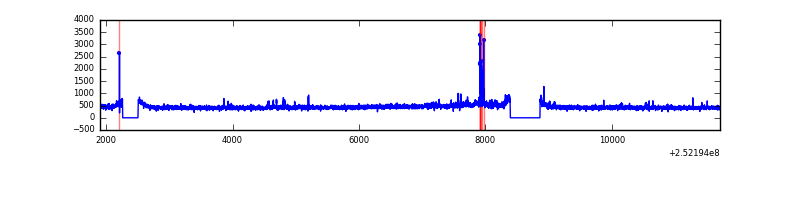 |
| D | 9811 | 9098 | 86 | 86 | 0.88% | 0.95% | 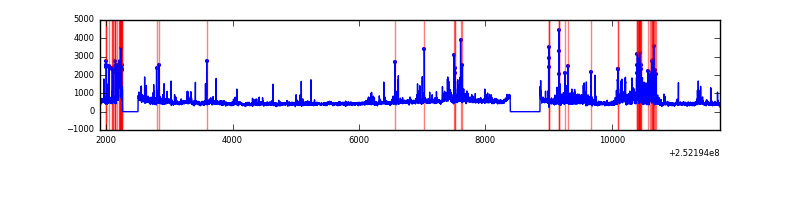 |
Top three noisy pixels from each quadrant. If the there are fewer than three noisy pixels in the level2.evt file, extra rows are filled as -1
| Pixel properties | Quadrant properties | ||||||
|---|---|---|---|---|---|---|---|
| Quadrant | DetID | PixID | Counts | Sigma | Mean | Median | Sigma |
| A | 1 | 162 | 56189 | 264.05 | 1022 | 999 | 209.0 |
| A | 5 | 16 | 41596 | 194.23 | 1022 | 999 | 209.0 |
| A | 8 | 15 | 31563 | 146.23 | 1022 | 999 | 209.0 |
| B | 4 | 239 | 3257912 | 18184.13 | 955 | 931 | 179.1 |
| B | 10 | 16 | 613867 | 3422.1 | 955 | 931 | 179.1 |
| B | 15 | 204 | 204953 | 1139.08 | 955 | 931 | 179.1 |
| C | 15 | 208 | 141956 | 609.88 | 999 | 1000 | 231.1 |
| C | 0 | 207 | 39855 | 168.12 | 999 | 1000 | 231.1 |
| C | 12 | 4 | 8618 | 32.96 | 999 | 1000 | 231.1 |
| D | 8 | 195 | 471558 | 2000.41 | 983 | 953 | 235.3 |
| D | 4 | 95 | 245660 | 1040.18 | 983 | 953 | 235.3 |
| D | 1 | 52 | 184648 | 780.84 | 983 | 953 | 235.3 |
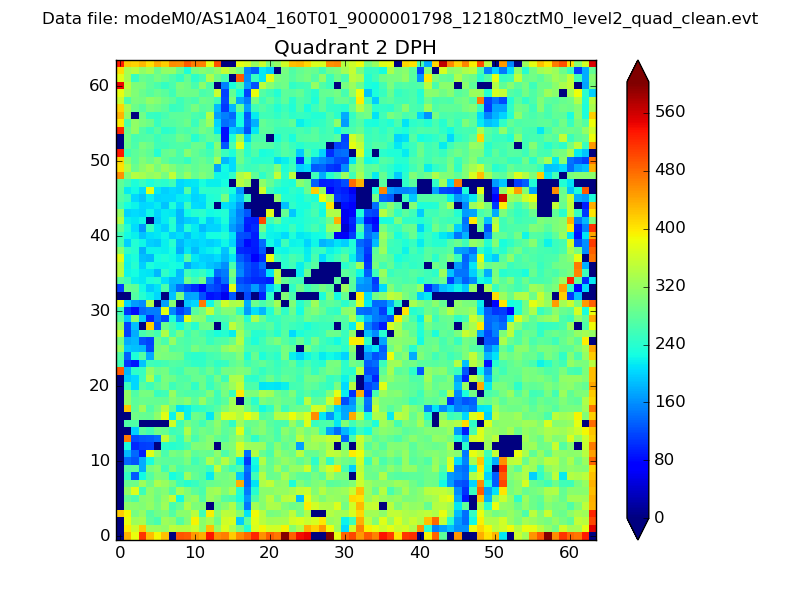
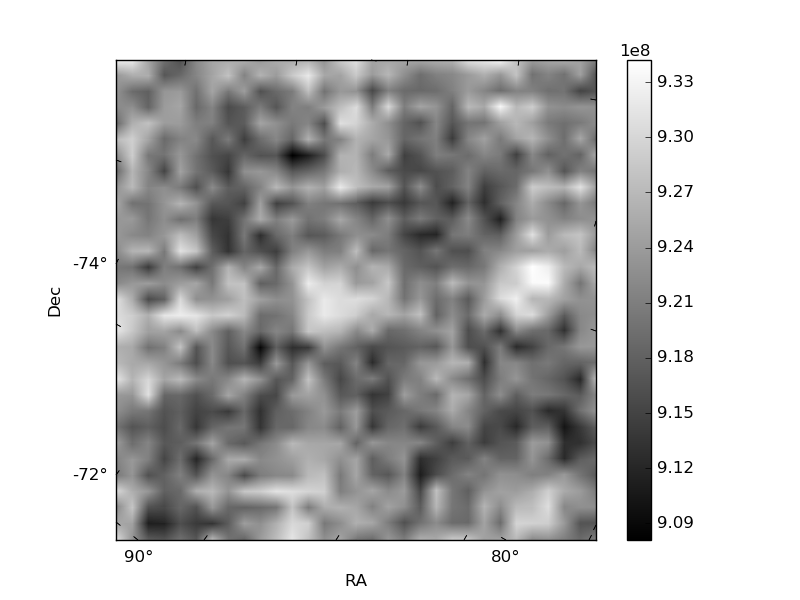
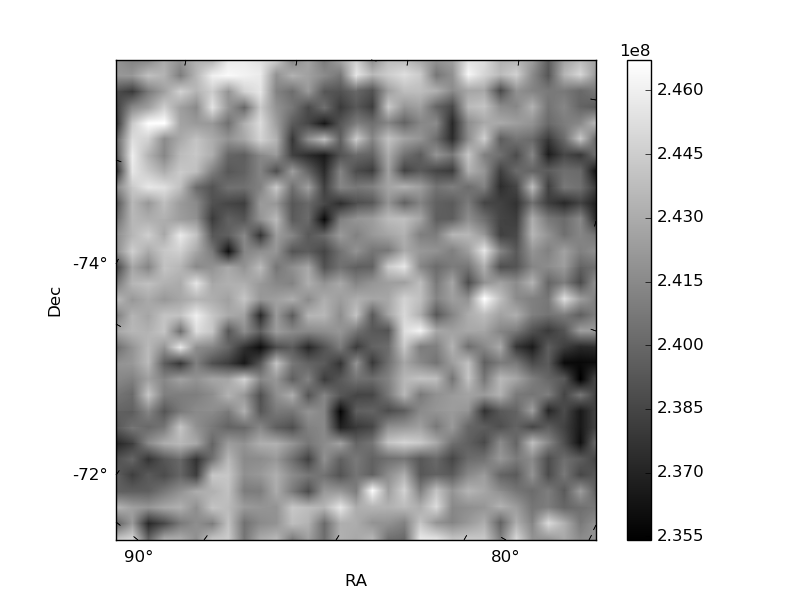
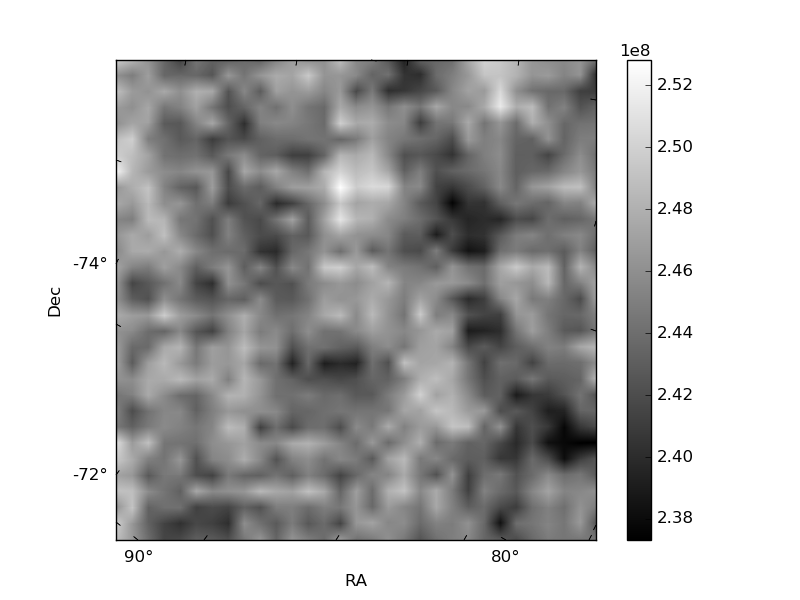
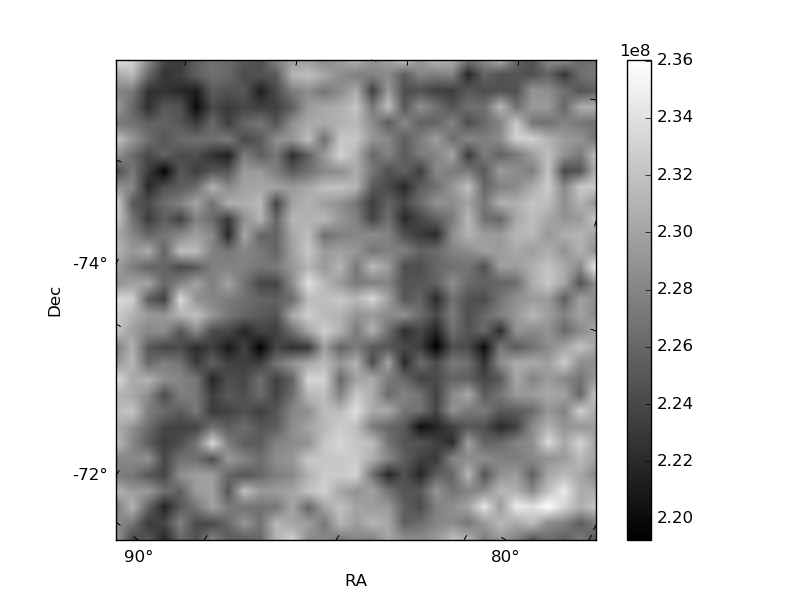
Histogram calculated using DETX and DETY for each event in the final _common_clean file
| Quadrant A | 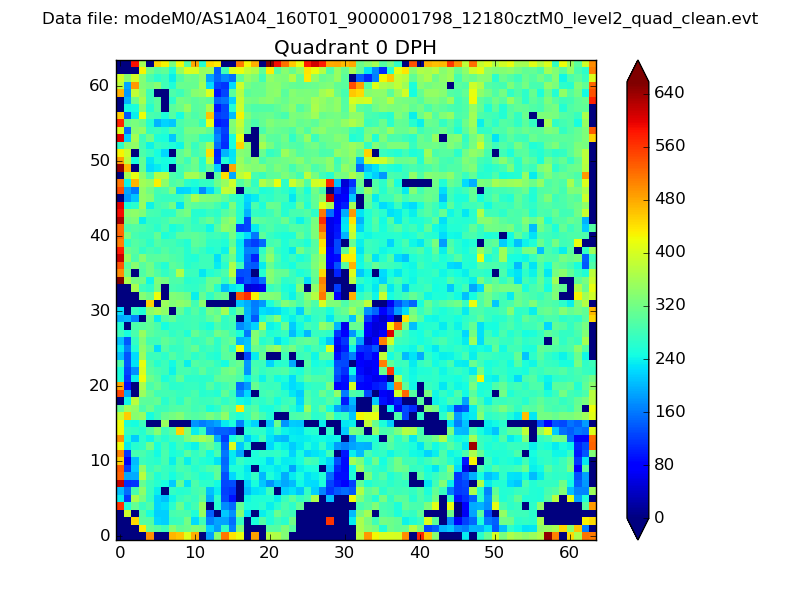 |
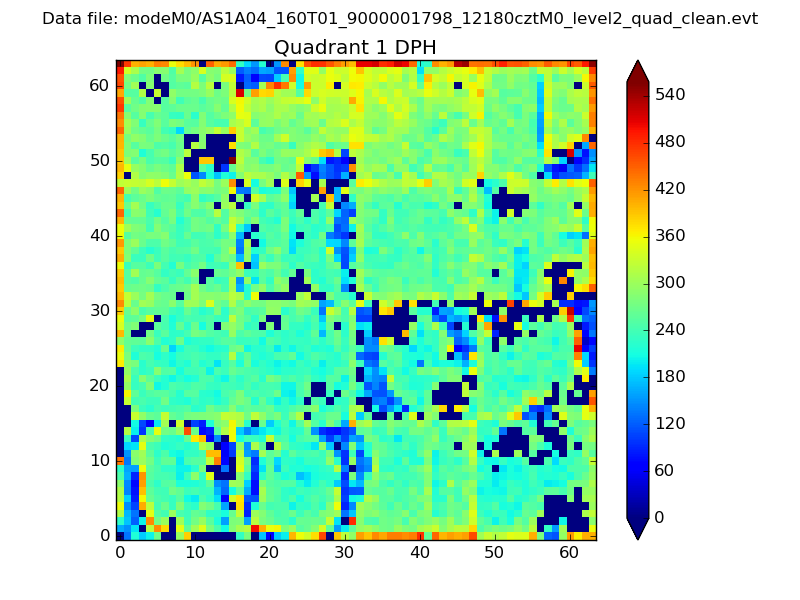 |
Quadrant B |
|---|---|---|---|
| Quadrant D | 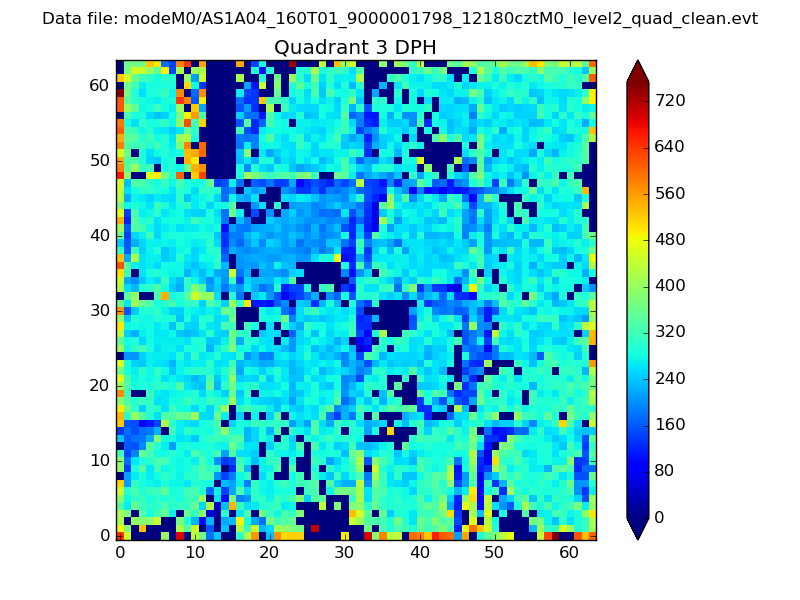 |
 |
Quadrant C |
| Plot type | Count rate plots | Images |
|---|---|---|
| Comparison with Poisson distribution Blue bars denote a histogram of data divided into 1 sec bins. Red curve is a Poisson curve with rate = median count rate of data. |
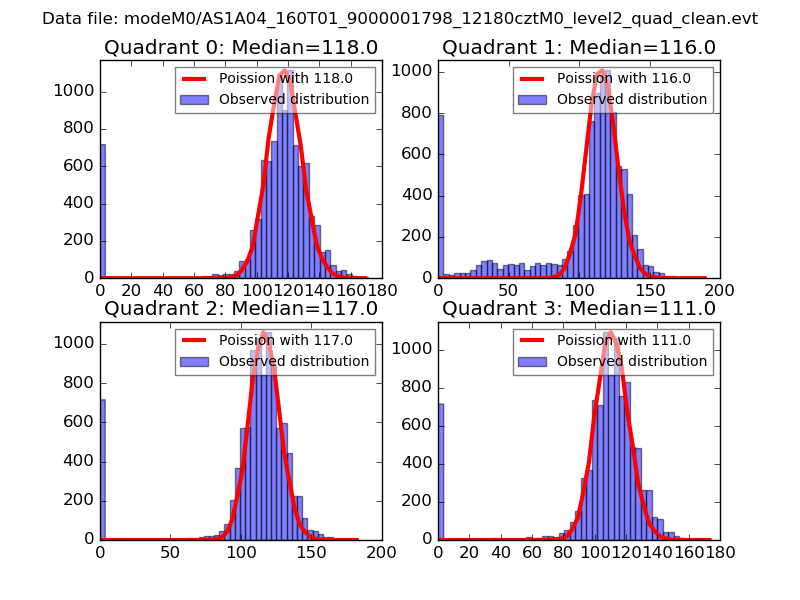 |
 |
| Quadrant-wise count rates Data is divided into 100 sec bins |
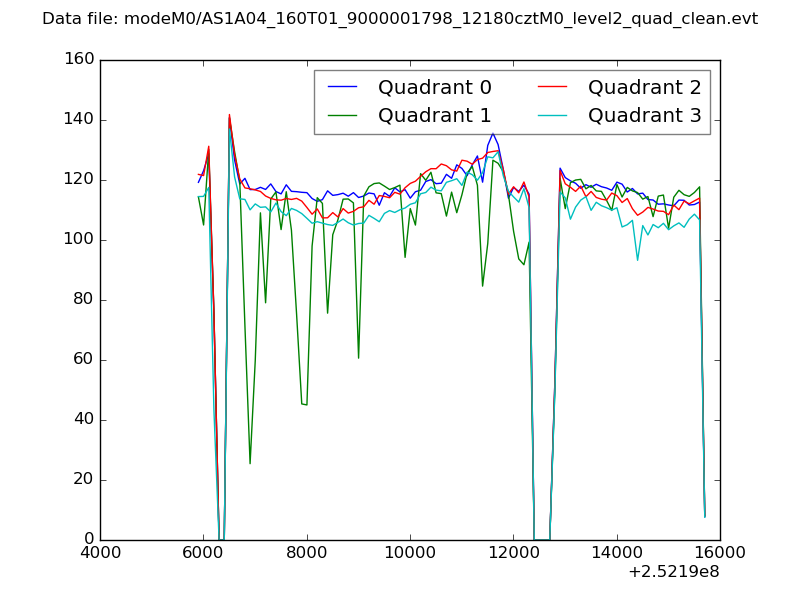 |
|
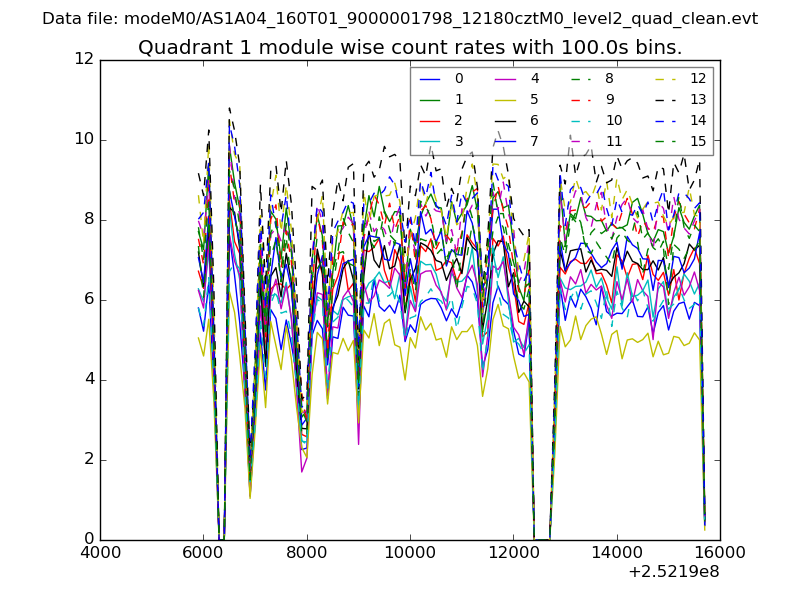
| Module-wise count rates for Quadrant A Data is divided into 100 sec bins |
 |
 |
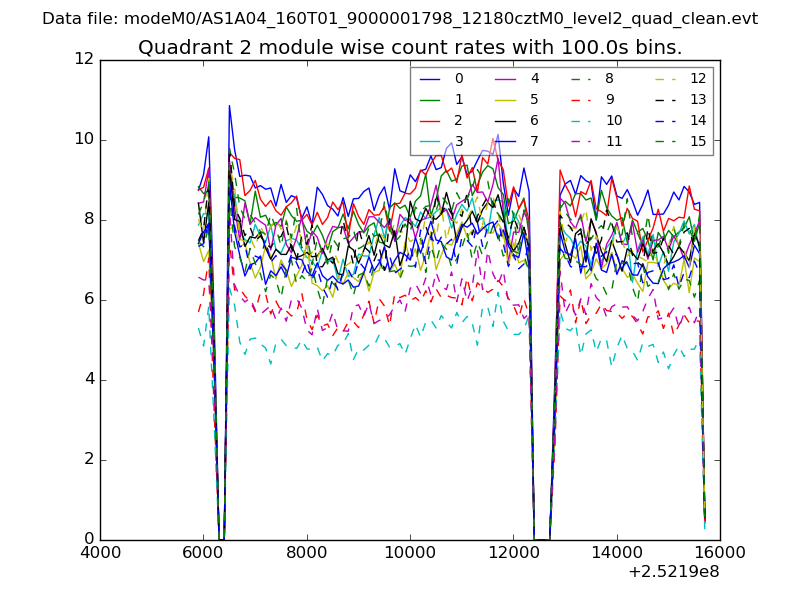
| Module-wise count rates for Quadrant B Data is divided into 100 sec bins |
 |
 |
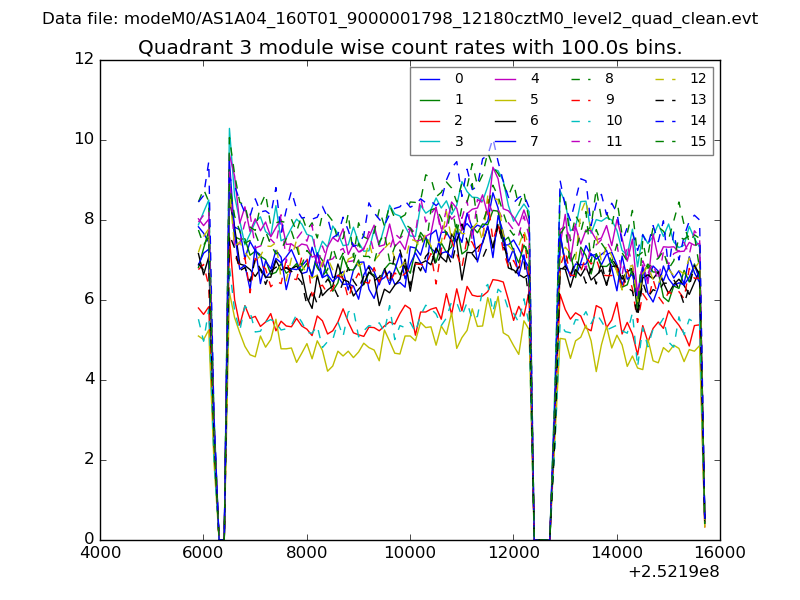
| Module-wise count rates for Quadrant C Data is divided into 100 sec bins |
 |
 |
| Module-wise count rates for Quadrant D Data is divided into 100 sec bins |
 |
 |
| Parameter | Plot |
|---|---|
| CZT HV Monitor | 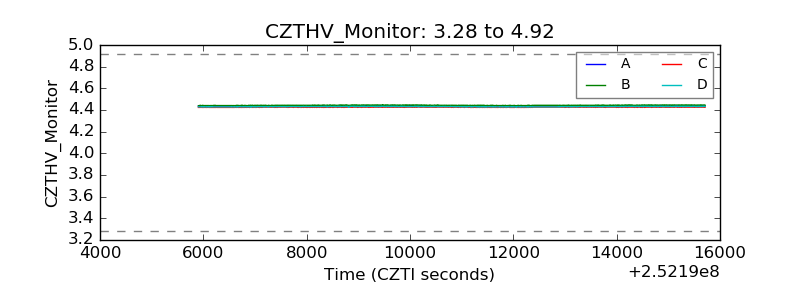 |
| D_VDD | 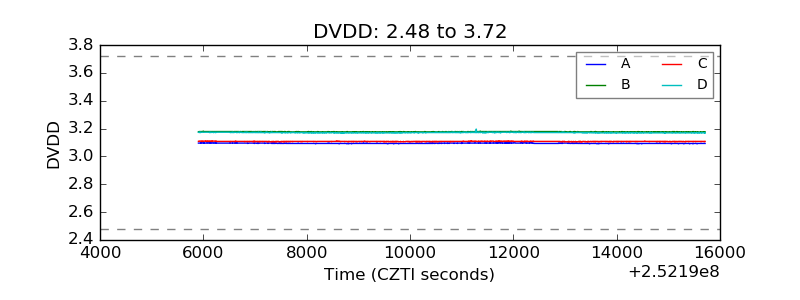 |
| Temperature 1 |  |
| Veto HV Monitor | 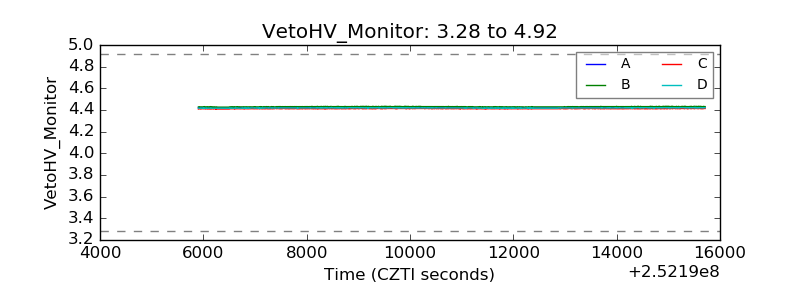 |
| Veto LLD | 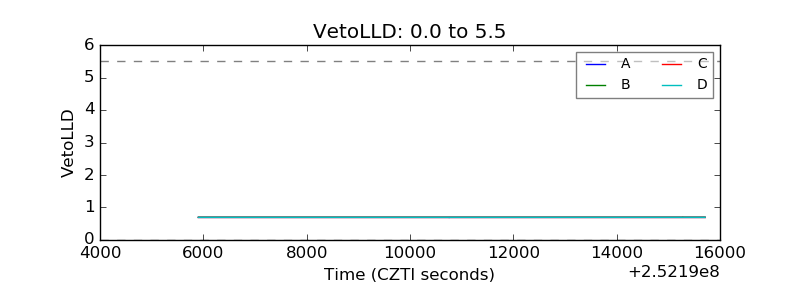 |
| Alpha Counter | 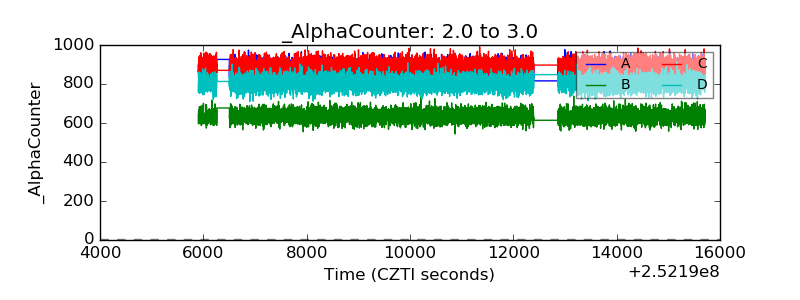 |
| _CPM_Rate | 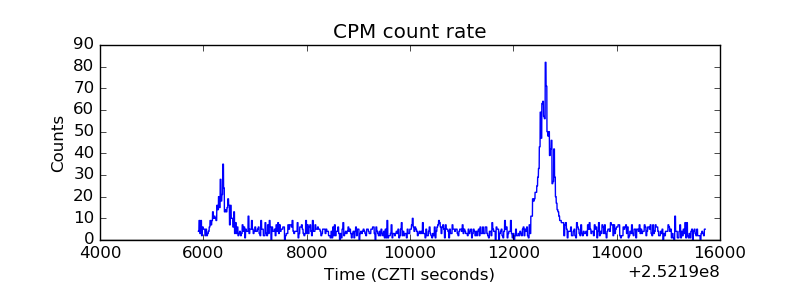 |
| CZT Counter | 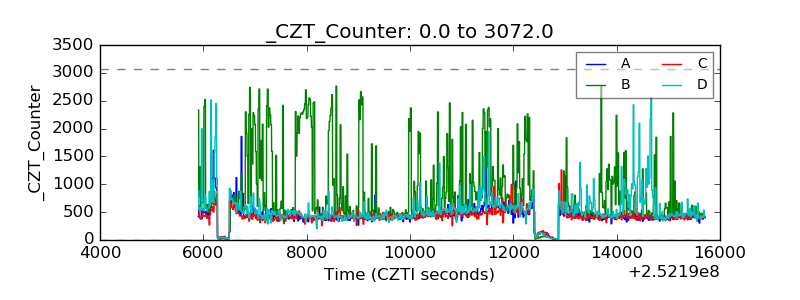 |
| +2.5 Volts monitor |  |
| +5 Volts monitor |  |
| _ROLL_ROT | 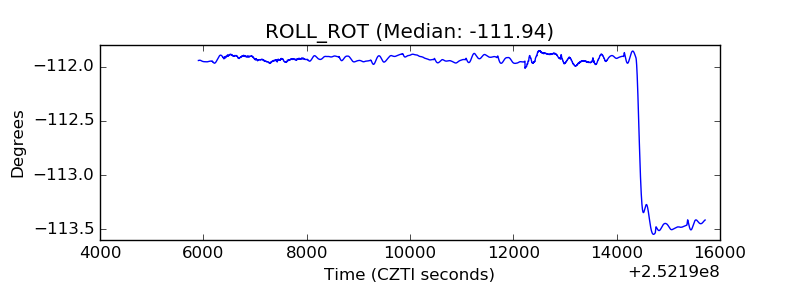 |
| _Roll_DEC | 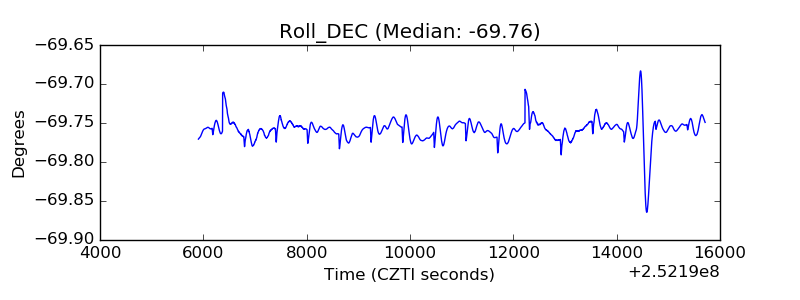 |
| _Roll_RA | 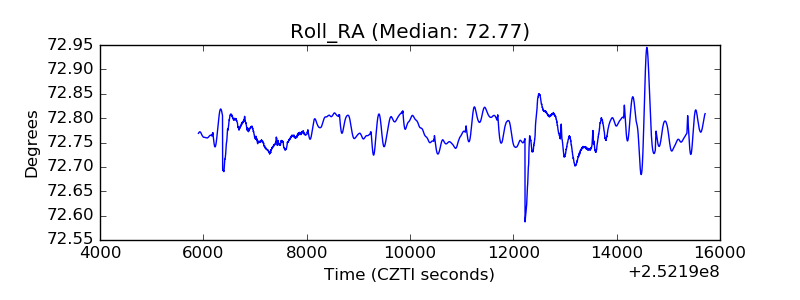 |
| Veto Counter | 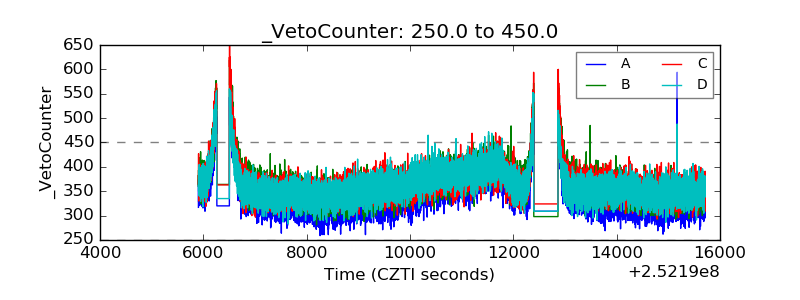 |