| Param | Original file | Final file |
|---|---|---|
| Filename | modeM0/AS1A04_160T01_9000001798_12181cztM0_level2.evt | modeM0/AS1A04_160T01_9000001798_12181cztM0_level2_quad_clean.evt |
| Size (bytes) | 833,952,960 | 182,882,880 |
| Size | 795.3 MB | 174.4 MB |
| Events in quadrant A | 5,151,205 | 1,237,486 |
| Events in quadrant B | 8,851,815 | 1,157,749 |
| Events in quadrant C | 4,587,564 | 1,244,505 |
| Events in quadrant D | 5,962,576 | 1,179,558 |
| Mode SS | |||
|---|---|---|---|
| Quadrant | BADHDUFLAG | Total packets | Discarded packets |
| A | 0 | 214 | 0 |
| B | 0 | 214 | 0 |
| C | 0 | 214 | 0 |
| D | 0 | 214 | 0 |
| Mode M9 | |||
|---|---|---|---|
| Quadrant | BADHDUFLAG | Total packets | Discarded packets |
| A | 0 | 14 | 0 |
| B | 0 | 14 | 0 |
| C | 0 | 14 | 0 |
| D | 0 | 14 | 0 |
| Mode M0 | |||
|---|---|---|---|
| Quadrant | BADHDUFLAG | Total packets | Discarded packets |
| A | 0 | 22314 | 3 |
| B | 0 | 33269 | 2 |
| C | 0 | 20998 | 2 |
| D | 0 | 24414 | 2 |
| Quadrant | Total seconds | Saturated seconds | Saturation percentage |
|---|---|---|---|
| A | 10381 | 215 | 2.071091% |
| B | 10381 | 1413 | 13.611405% |
| C | 10381 | 63 | 0.606878% |
| D | 10381 | 150 | 1.444948% |
Noise dominated data is calculated using 1-second bins in cleaned event files. If a bin has >2000 counts, and if more than 50% of those come from <1% of pixels, then it is considered to be noise-dominated and hence unusable.
| Quadrant | # 1 sec bins | Bins with >0 counts | Bins with >2000 counts | High rate bins dominated by noise | Noise dominated (total time) | Noise dominated (detector-on time) | Marked lightcurve |
|---|---|---|---|---|---|---|---|
| A | 11822 | 10383 | 8 | 8 | 0.07% | 0.08% | 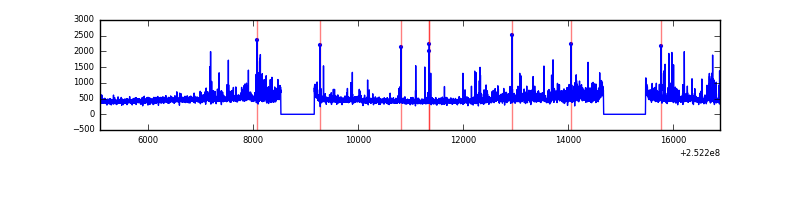 |
| B | 11822 | 10383 | 778 | 778 | 6.58% | 7.49% | 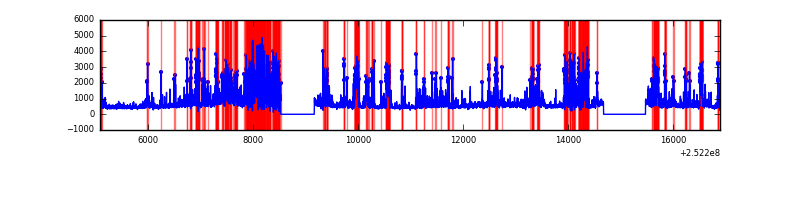 |
| C | 11822 | 10384 | 1 | 1 | 0.01% | 0.01% | 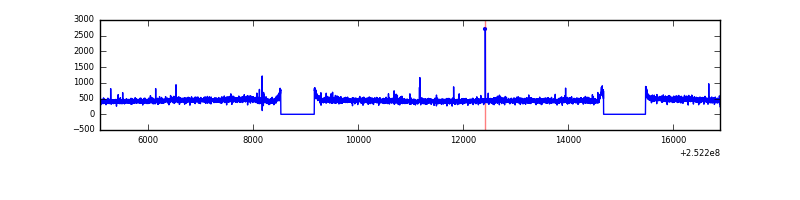 |
| D | 11822 | 10384 | 61 | 61 | 0.52% | 0.59% | 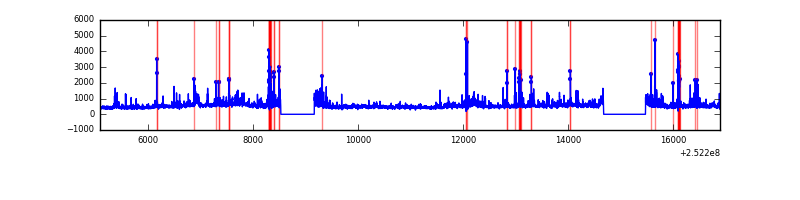 |
Top three noisy pixels from each quadrant. If the there are fewer than three noisy pixels in the level2.evt file, extra rows are filled as -1
| Pixel properties | Quadrant properties | ||||||
|---|---|---|---|---|---|---|---|
| Quadrant | DetID | PixID | Counts | Sigma | Mean | Median | Sigma |
| A | 1 | 162 | 172969 | 707.43 | 1194 | 1167 | 242.9 |
| A | 1 | 178 | 89590 | 364.1 | 1194 | 1167 | 242.9 |
| A | 1 | 161 | 78891 | 320.04 | 1194 | 1167 | 242.9 |
| B | 4 | 239 | 3481490 | 16446.58 | 1119 | 1090 | 211.6 |
| B | 15 | 204 | 192098 | 902.6 | 1119 | 1090 | 211.6 |
| B | 11 | 51 | 168347 | 790.37 | 1119 | 1090 | 211.6 |
| C | 14 | 234 | 9394 | 30.51 | 1169 | 1168 | 269.7 |
| C | 13 | 61 | 8696 | 27.92 | 1169 | 1168 | 269.7 |
| C | 4 | 175 | 7369 | 23.0 | 1169 | 1168 | 269.7 |
| D | 8 | 195 | 623698 | 2272.5 | 1158 | 1126 | 274.0 |
| D | 1 | 52 | 152287 | 551.77 | 1158 | 1126 | 274.0 |
| D | 13 | 104 | 151544 | 549.05 | 1158 | 1126 | 274.0 |
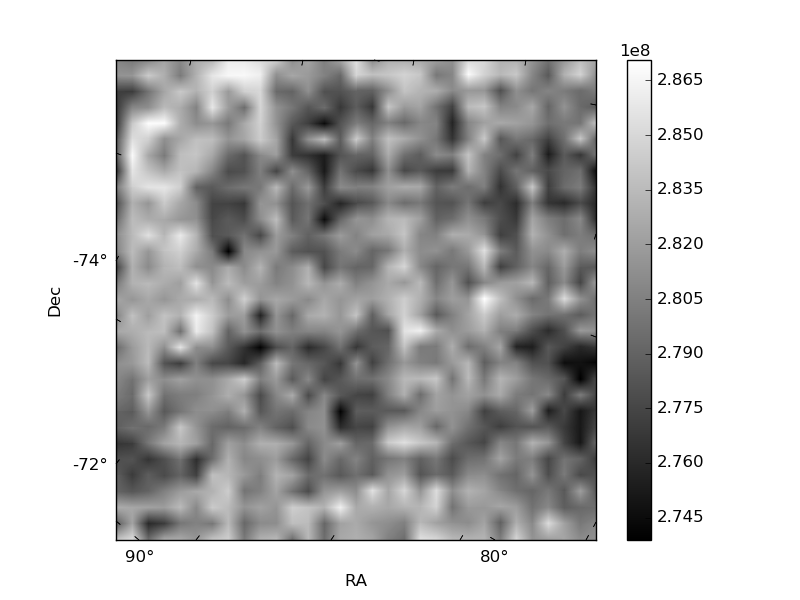
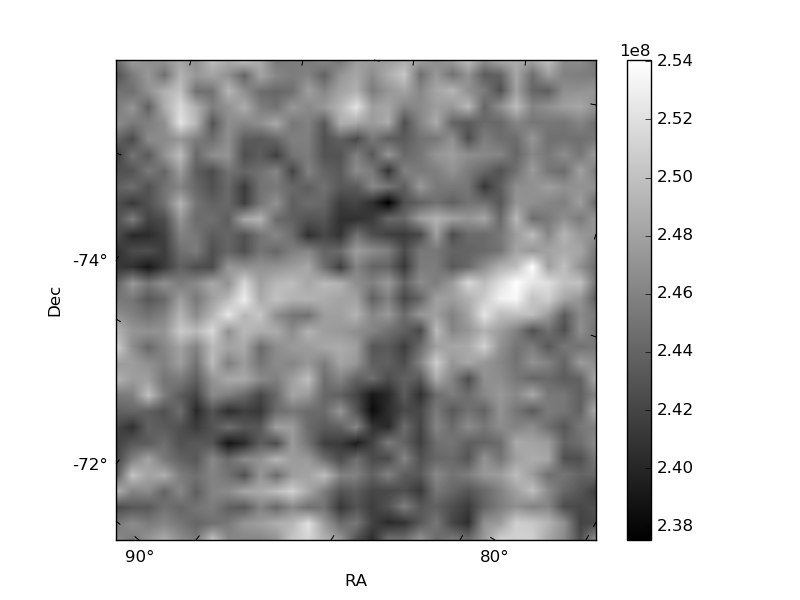
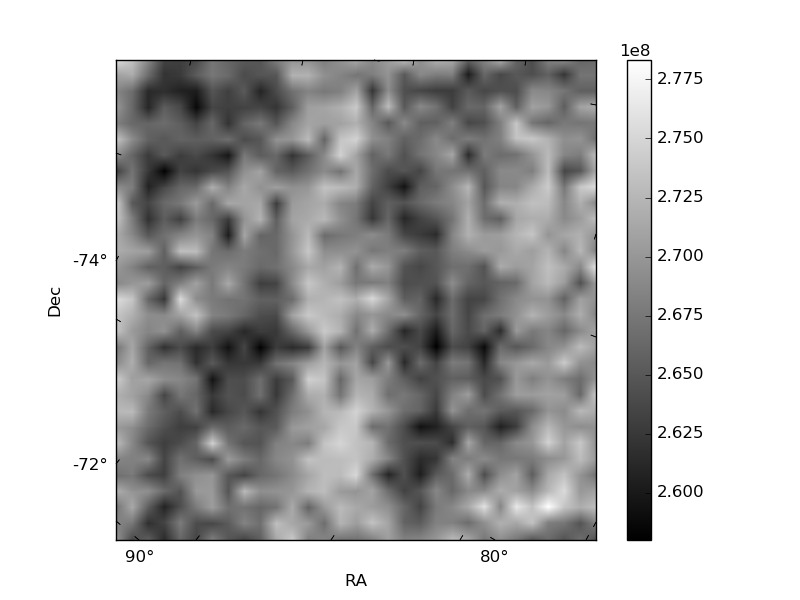
Histogram calculated using DETX and DETY for each event in the final _common_clean file
| Quadrant A |  |
 |
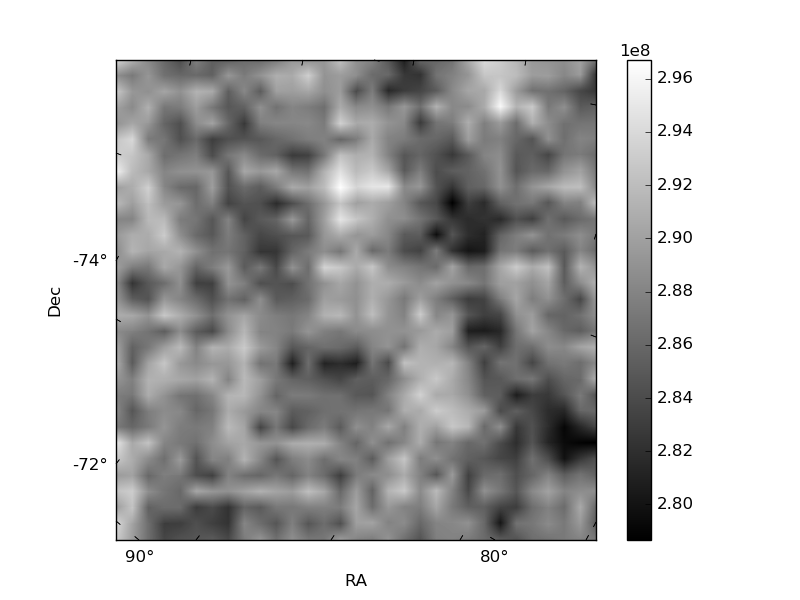
Quadrant B |
|---|---|---|---|
| Quadrant D | 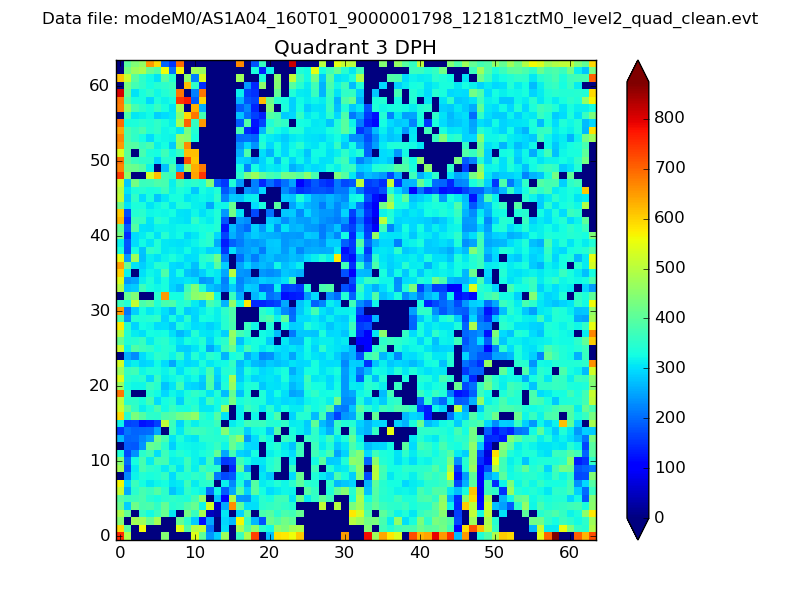 |
 |
Quadrant C |
| Plot type | Count rate plots | Images |
|---|---|---|
| Comparison with Poisson distribution Blue bars denote a histogram of data divided into 1 sec bins. Red curve is a Poisson curve with rate = median count rate of data. |
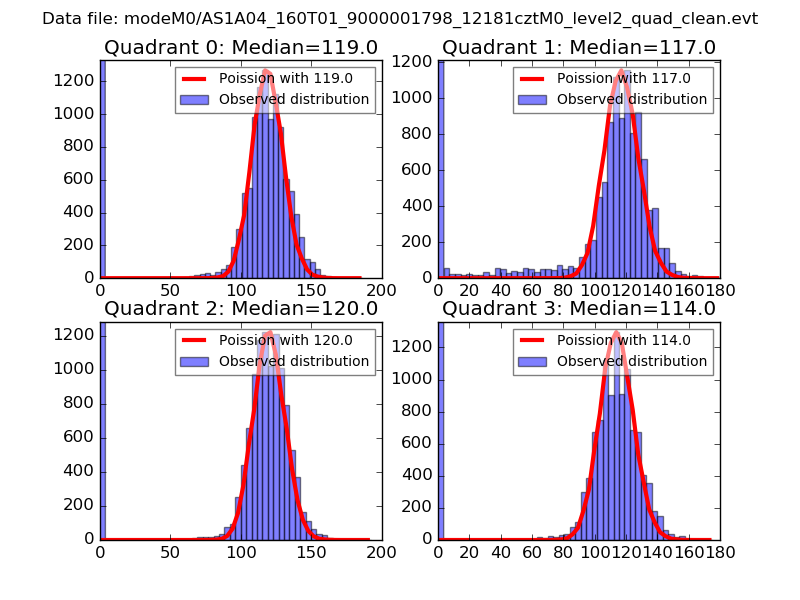 |
 |
| Quadrant-wise count rates Data is divided into 100 sec bins |
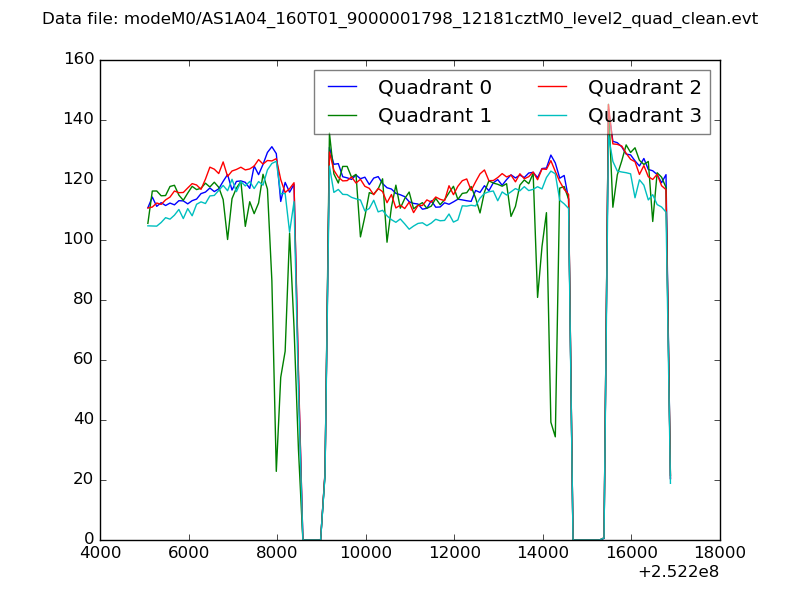 |
|
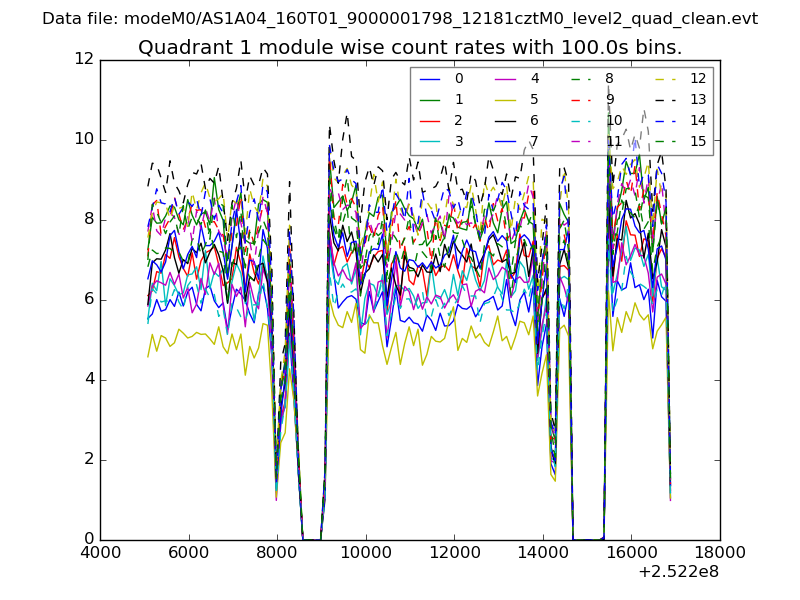
| Module-wise count rates for Quadrant A Data is divided into 100 sec bins |
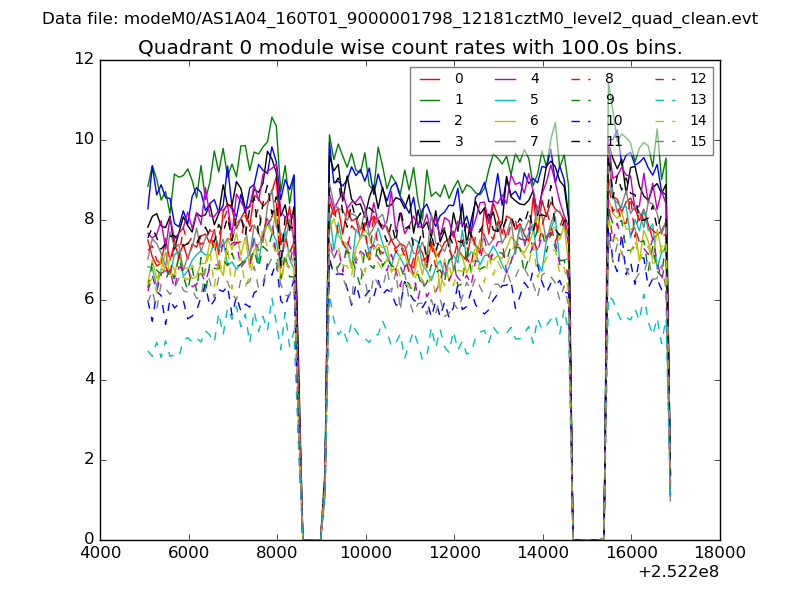 |
 |
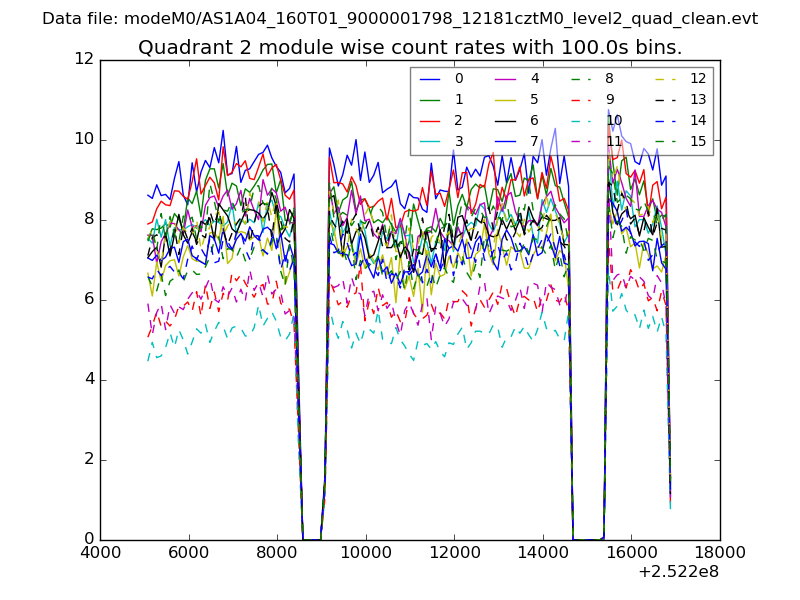
| Module-wise count rates for Quadrant B Data is divided into 100 sec bins |
 |
 |
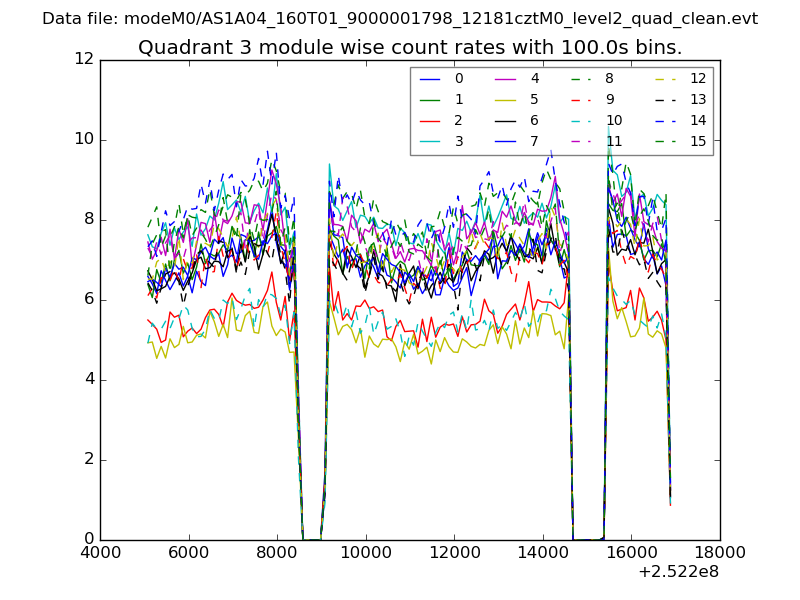
| Module-wise count rates for Quadrant C Data is divided into 100 sec bins |
 |
 |
| Module-wise count rates for Quadrant D Data is divided into 100 sec bins |
 |
 |
| Parameter | Plot |
|---|---|
| CZT HV Monitor | 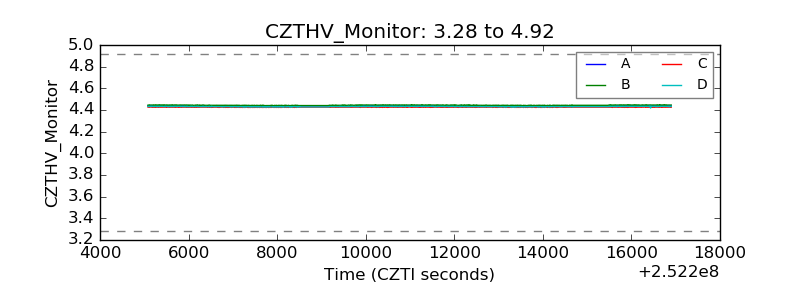 |
| D_VDD | 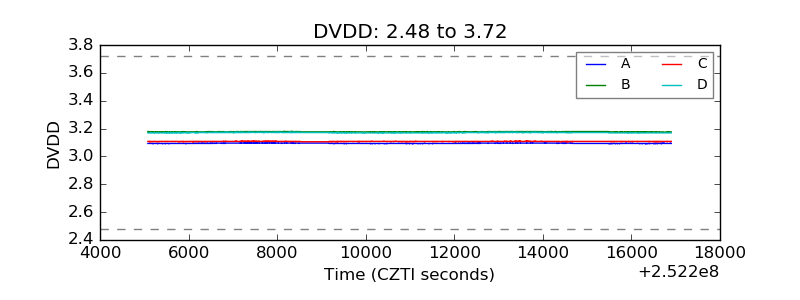 |
| Temperature 1 | 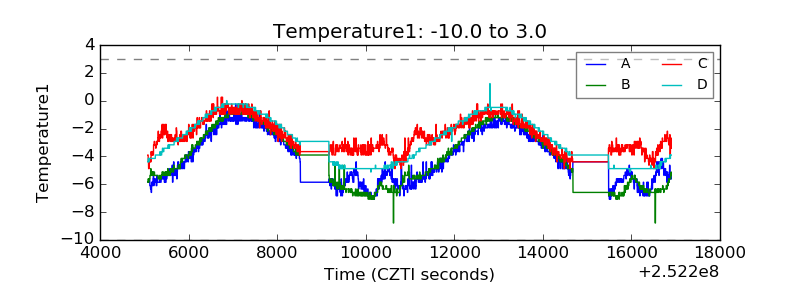 |
| Veto HV Monitor | 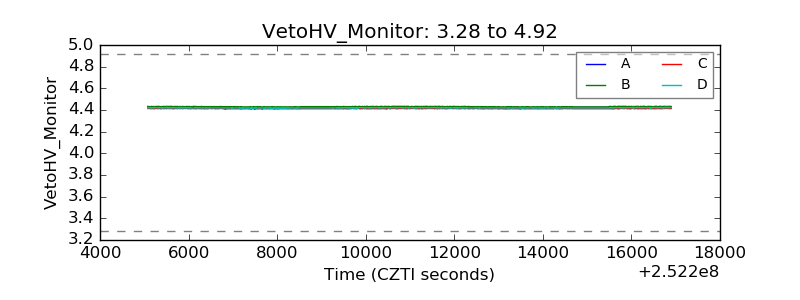 |
| Veto LLD | 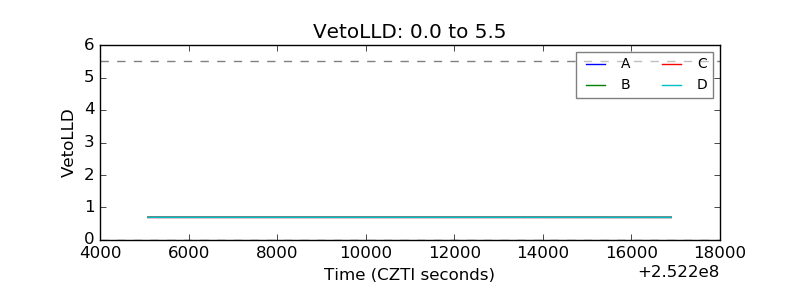 |
| Alpha Counter | 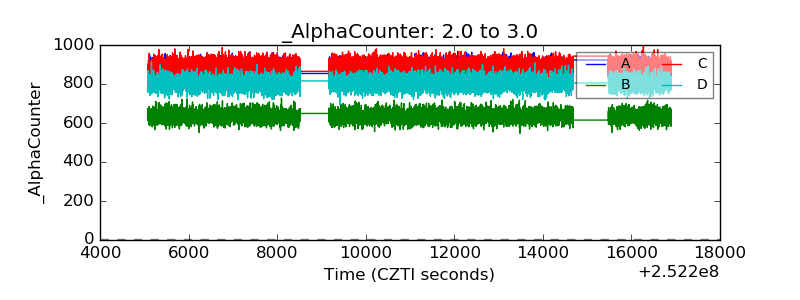 |
| _CPM_Rate | 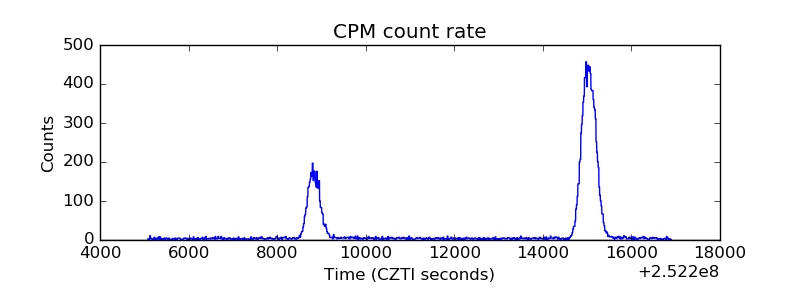 |
| CZT Counter |  |
| +2.5 Volts monitor |  |
| +5 Volts monitor |  |
| _ROLL_ROT | 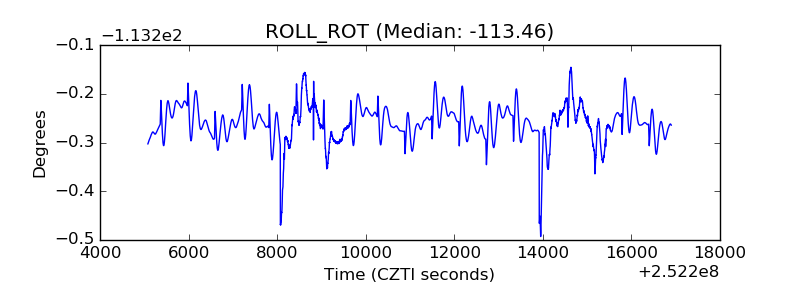 |
| _Roll_DEC | 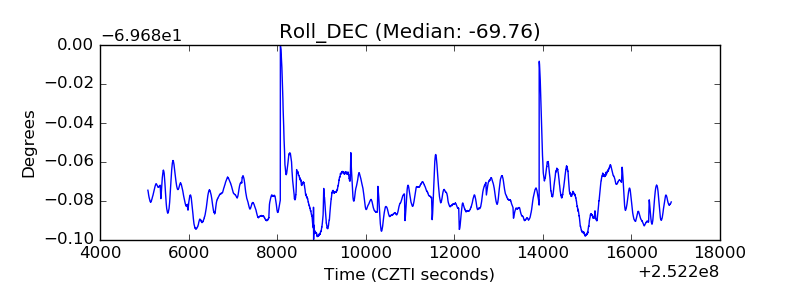 |
| _Roll_RA |  |
| Veto Counter | 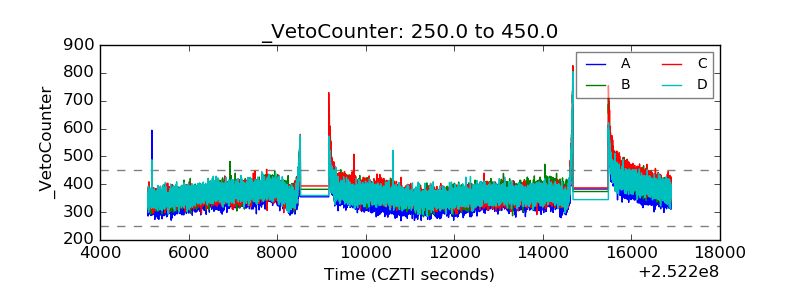 |