| Param | Original file | Final file |
|---|---|---|
| Filename | modeM0/AS1A04_160T01_9000001798_12182cztM0_level2.evt | modeM0/AS1A04_160T01_9000001798_12182cztM0_level2_quad_clean.evt |
| Size (bytes) | 538,902,720 | 111,113,280 |
| Size | 513.9 MB | 106.0 MB |
| Events in quadrant A | 3,272,439 | 754,941 |
| Events in quadrant B | 5,316,334 | 706,329 |
| Events in quadrant C | 3,688,659 | 750,959 |
| Events in quadrant D | 3,624,852 | 721,896 |
| Mode SS | |||
|---|---|---|---|
| Quadrant | BADHDUFLAG | Total packets | Discarded packets |
| A | 0 | 126 | 0 |
| B | 0 | 126 | 0 |
| C | 0 | 126 | 0 |
| D | 0 | 126 | 0 |
| Mode M9 | |||
|---|---|---|---|
| Quadrant | BADHDUFLAG | Total packets | Discarded packets |
| A | 0 | 9 | 0 |
| B | 0 | 9 | 0 |
| C | 0 | 9 | 0 |
| D | 0 | 9 | 0 |
| Mode M0 | |||
|---|---|---|---|
| Quadrant | BADHDUFLAG | Total packets | Discarded packets |
| A | 0 | 13806 | 2 |
| B | 0 | 19877 | 1 |
| C | 0 | 15139 | 1 |
| D | 0 | 14528 | 1 |
| Quadrant | Total seconds | Saturated seconds | Saturation percentage |
|---|---|---|---|
| A | 6165 | 161 | 2.611517% |
| B | 6165 | 995 | 16.139497% |
| C | 6165 | 210 | 3.406326% |
| D | 6165 | 188 | 3.049473% |
Noise dominated data is calculated using 1-second bins in cleaned event files. If a bin has >2000 counts, and if more than 50% of those come from <1% of pixels, then it is considered to be noise-dominated and hence unusable.
| Quadrant | # 1 sec bins | Bins with >0 counts | Bins with >2000 counts | High rate bins dominated by noise | Noise dominated (total time) | Noise dominated (detector-on time) | Marked lightcurve |
|---|---|---|---|---|---|---|---|
| A | 7131 | 6167 | 32 | 32 | 0.45% | 0.52% | 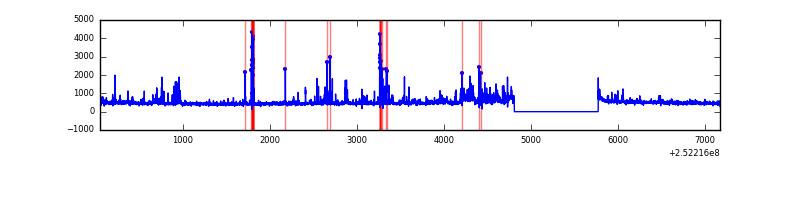 |
| B | 7131 | 6167 | 555 | 555 | 7.78% | 9.00% | 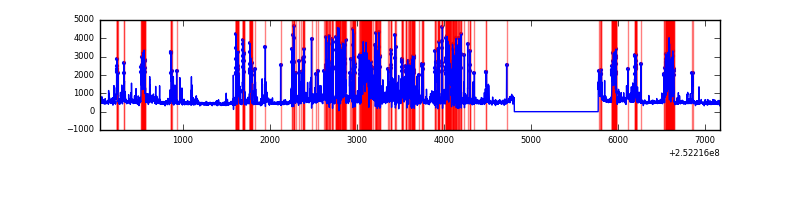 |
| C | 7131 | 6167 | 127 | 127 | 1.78% | 2.06% | 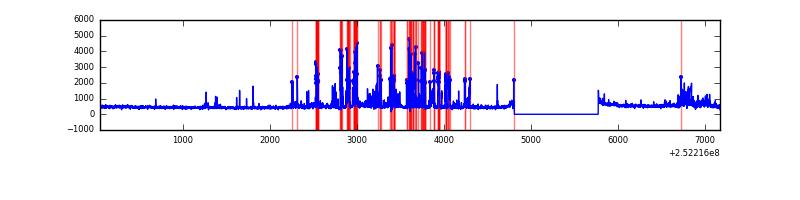 |
| D | 7131 | 6167 | 137 | 137 | 1.92% | 2.22% | 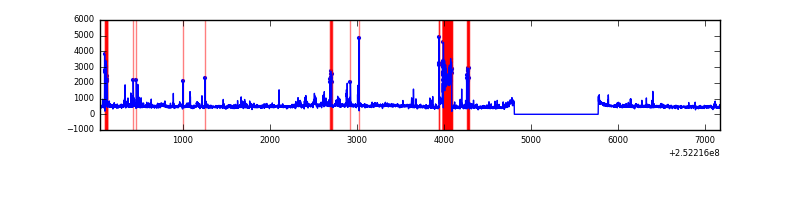 |
Top three noisy pixels from each quadrant. If the there are fewer than three noisy pixels in the level2.evt file, extra rows are filled as -1
| Pixel properties | Quadrant properties | ||||||
|---|---|---|---|---|---|---|---|
| Quadrant | DetID | PixID | Counts | Sigma | Mean | Median | Sigma |
| A | 1 | 162 | 124447 | 853.23 | 714 | 697 | 145.0 |
| A | 8 | 15 | 108413 | 742.68 | 714 | 697 | 145.0 |
| A | 9 | 143 | 92764 | 634.78 | 714 | 697 | 145.0 |
| B | 4 | 239 | 2187598 | 17508.48 | 665 | 651 | 124.9 |
| B | 15 | 204 | 159497 | 1271.71 | 665 | 651 | 124.9 |
| B | 11 | 51 | 105606 | 840.26 | 665 | 651 | 124.9 |
| C | 15 | 208 | 950415 | 5911.12 | 698 | 701 | 160.7 |
| C | 14 | 234 | 8153 | 46.38 | 698 | 701 | 160.7 |
| C | 4 | 175 | 7562 | 42.7 | 698 | 701 | 160.7 |
| D | 8 | 195 | 321472 | 1937.93 | 696 | 677 | 165.5 |
| D | 7 | 71 | 290598 | 1751.42 | 696 | 677 | 165.5 |
| D | 14 | 34 | 99447 | 596.67 | 696 | 677 | 165.5 |
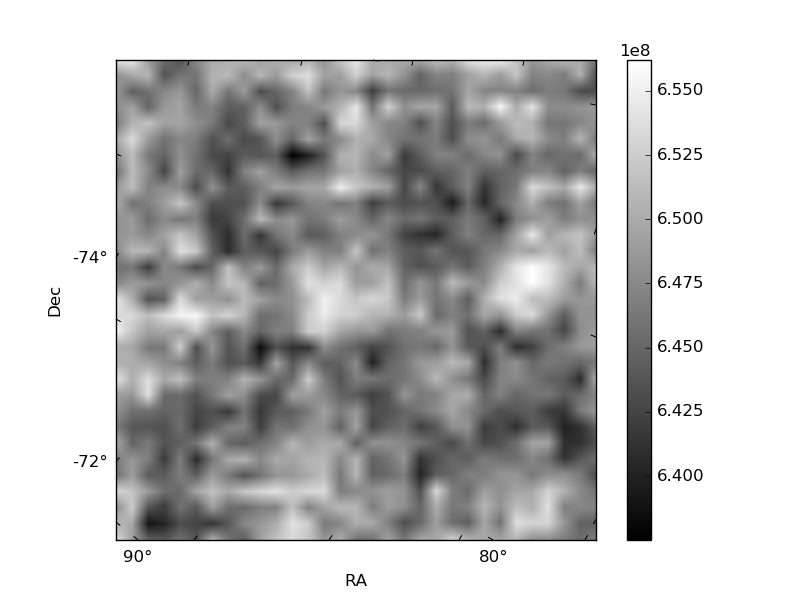
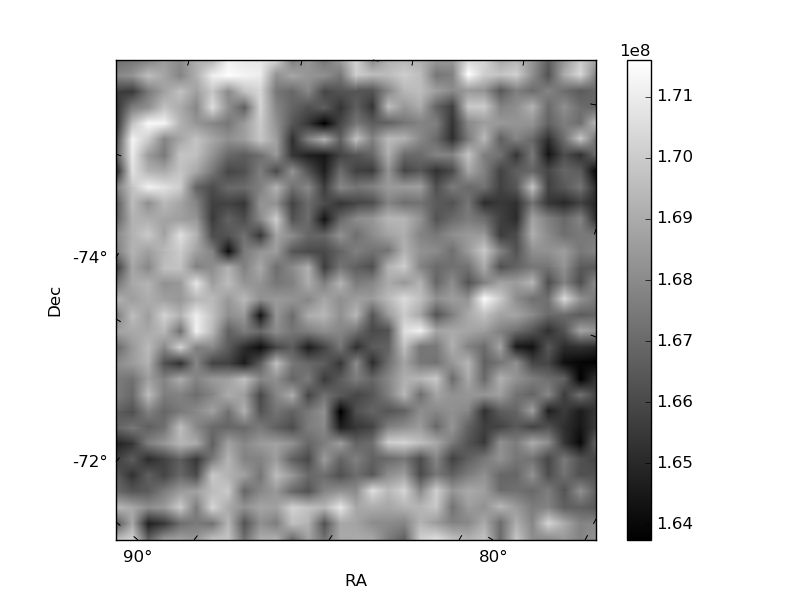
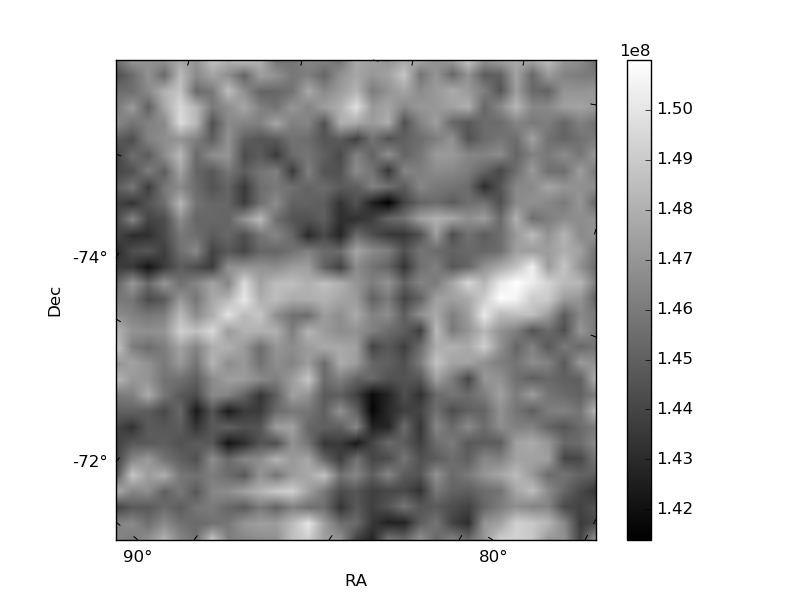
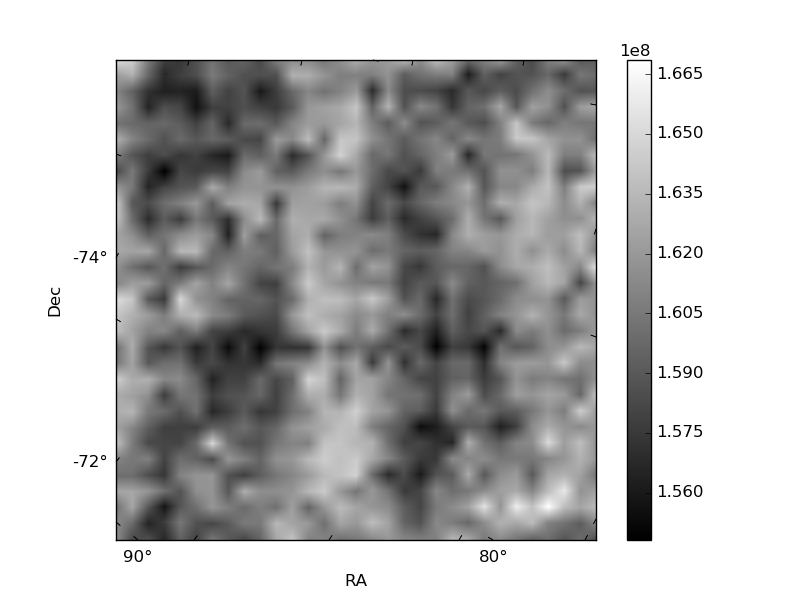
Histogram calculated using DETX and DETY for each event in the final _common_clean file
| Quadrant A | 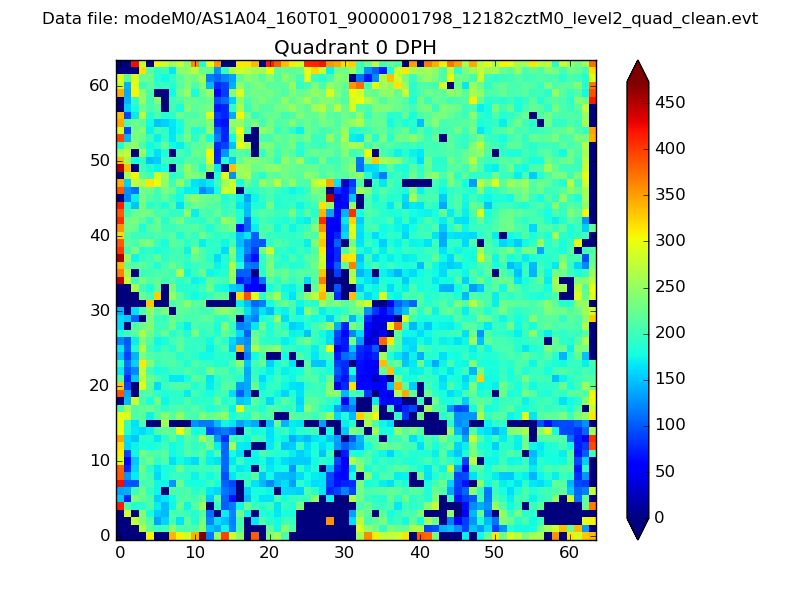 |
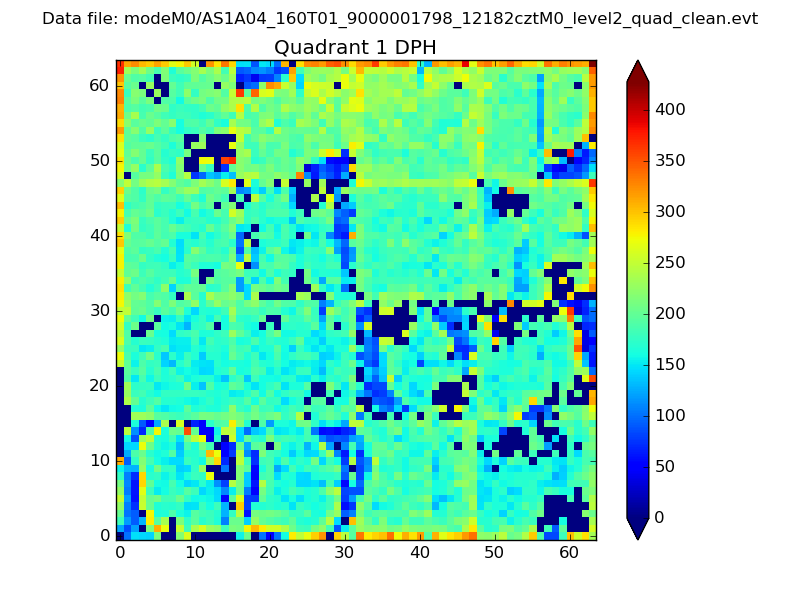 |
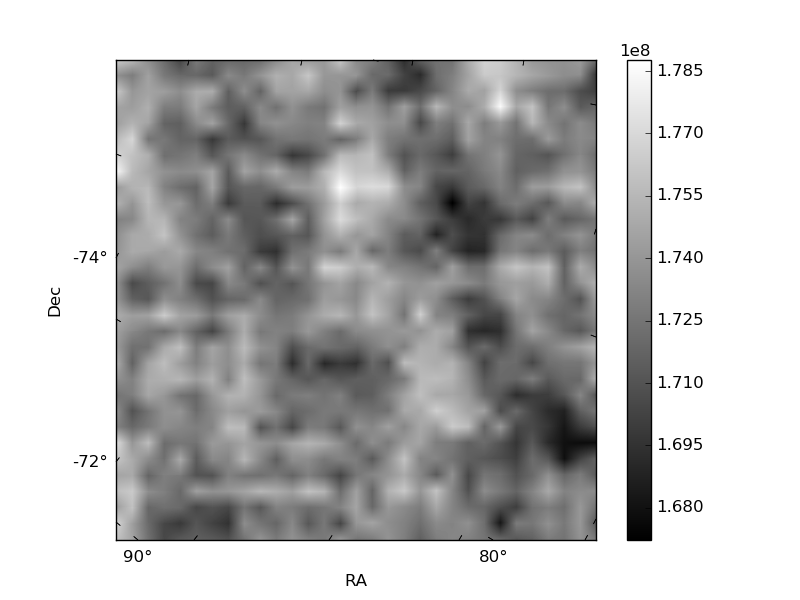
Quadrant B |
|---|---|---|---|
| Quadrant D | 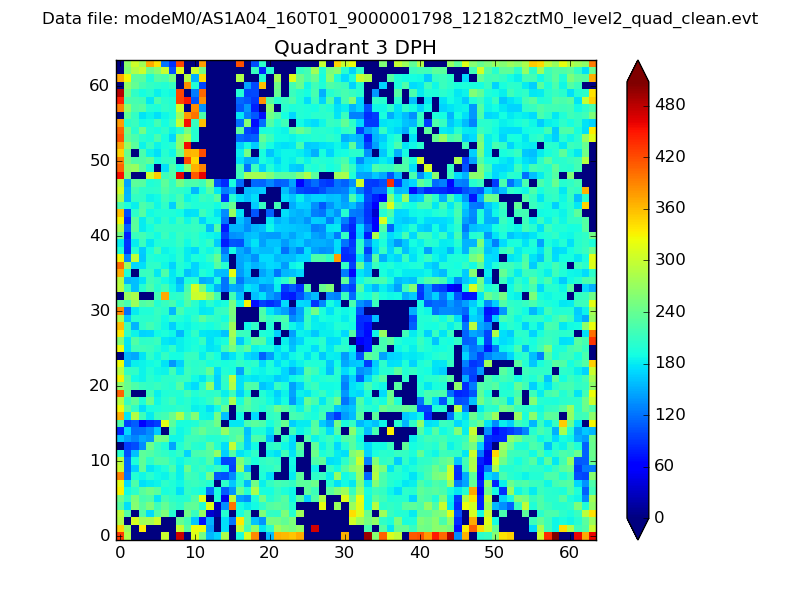 |
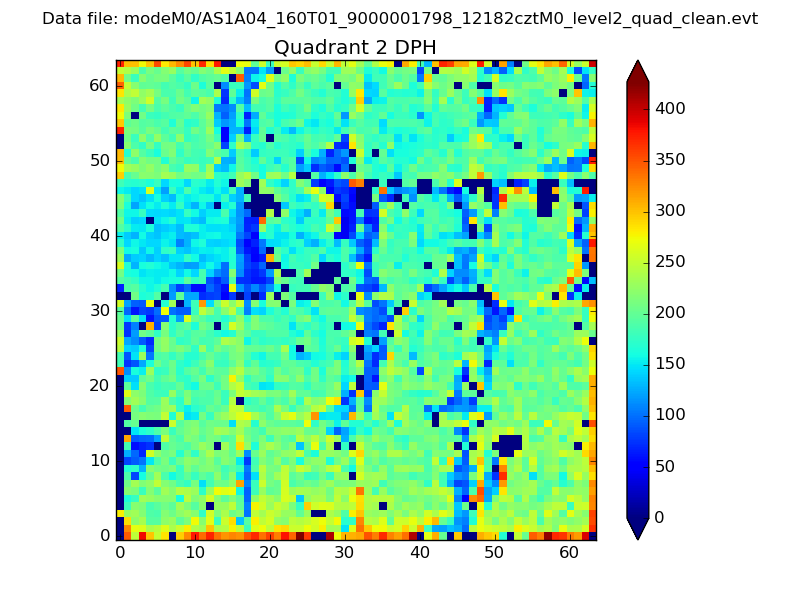 |
Quadrant C |
| Plot type | Count rate plots | Images |
|---|---|---|
| Comparison with Poisson distribution Blue bars denote a histogram of data divided into 1 sec bins. Red curve is a Poisson curve with rate = median count rate of data. |
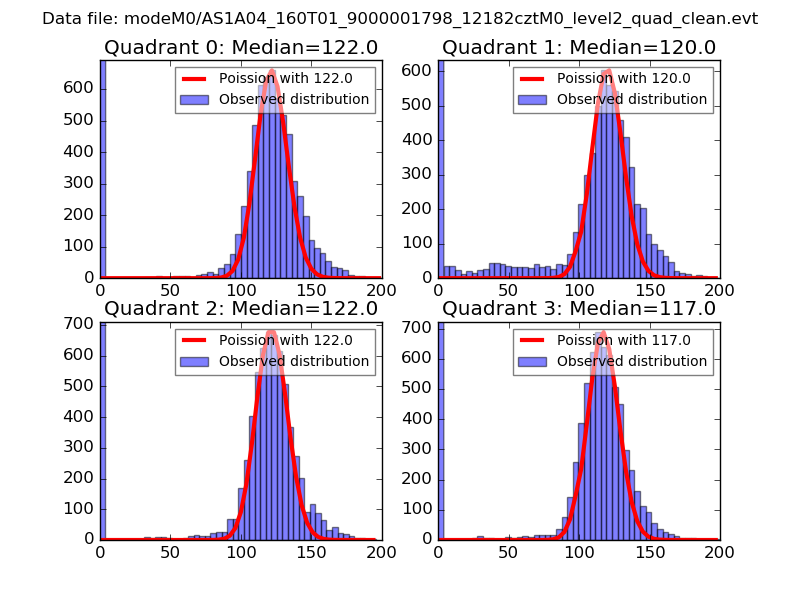 |
 |
| Quadrant-wise count rates Data is divided into 100 sec bins |
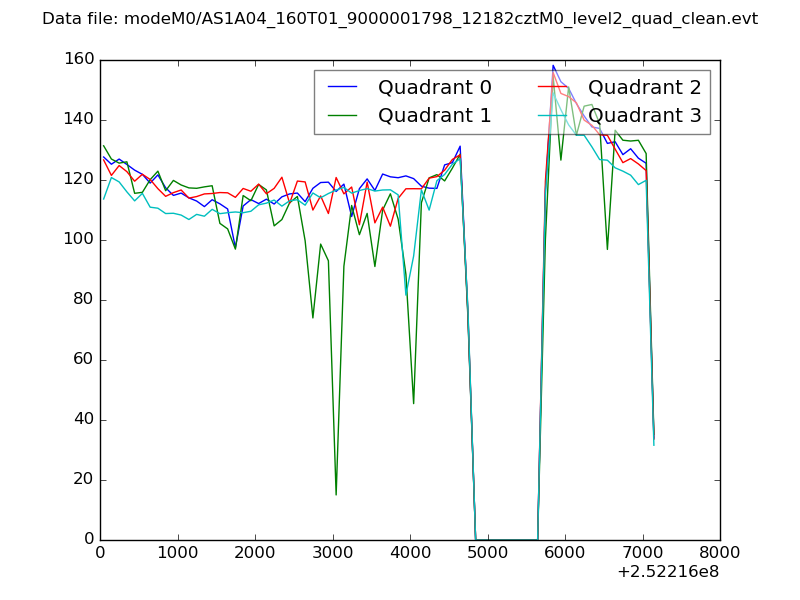 |
|
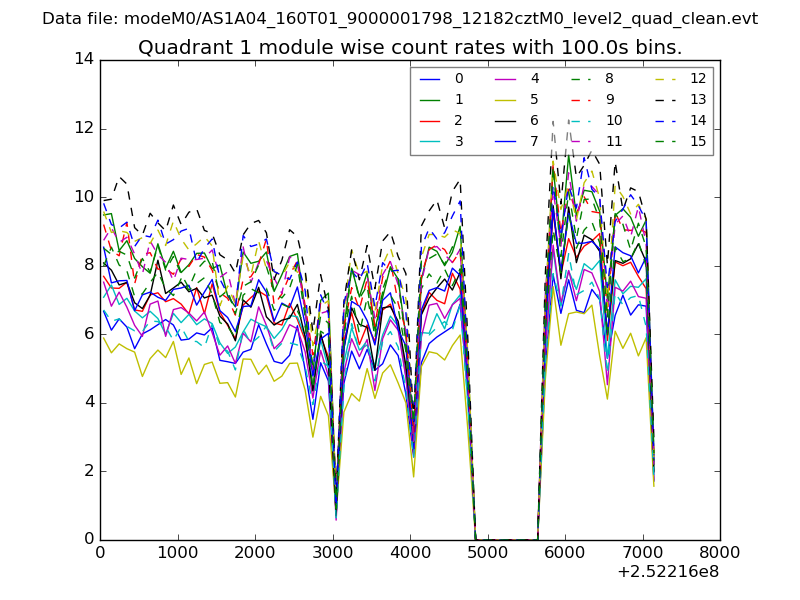
| Module-wise count rates for Quadrant A Data is divided into 100 sec bins |
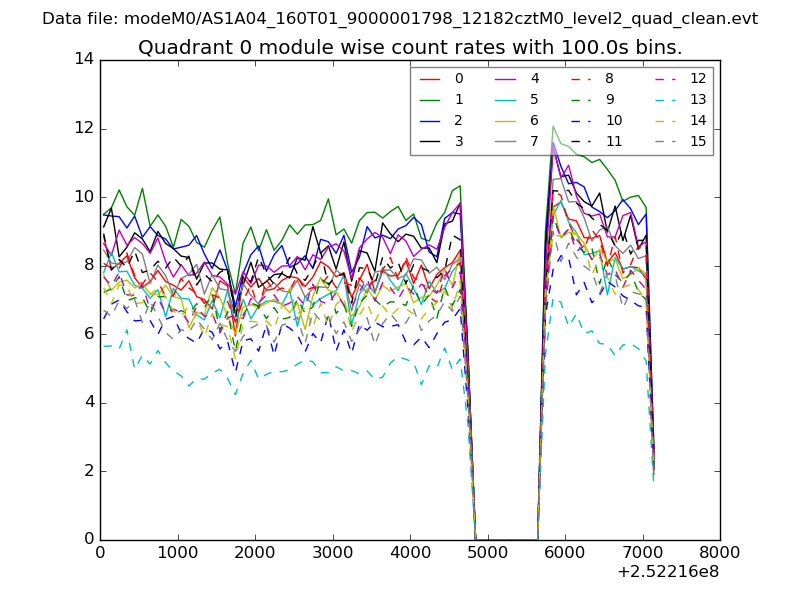 |
 |
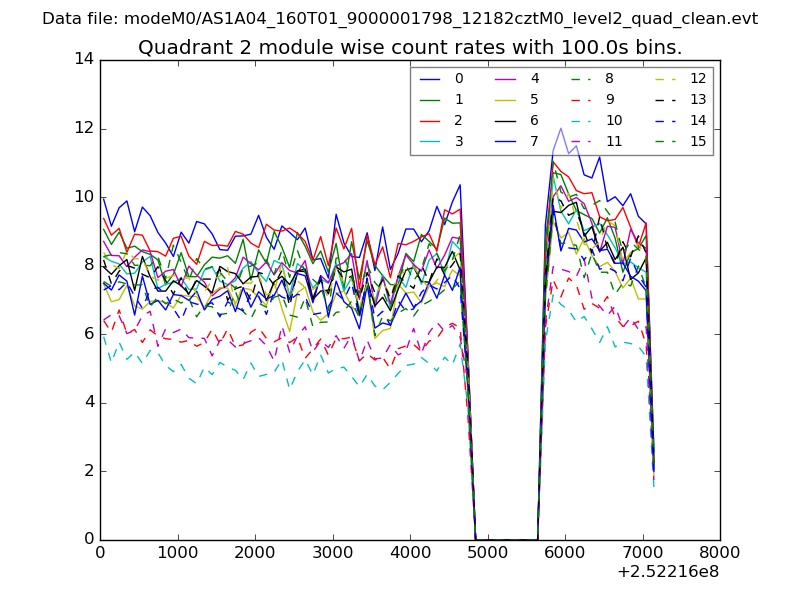
| Module-wise count rates for Quadrant B Data is divided into 100 sec bins |
 |
 |
| Module-wise count rates for Quadrant C Data is divided into 100 sec bins |
 |
 |
| Module-wise count rates for Quadrant D Data is divided into 100 sec bins |
 |
 |
| Parameter | Plot |
|---|---|
| CZT HV Monitor | 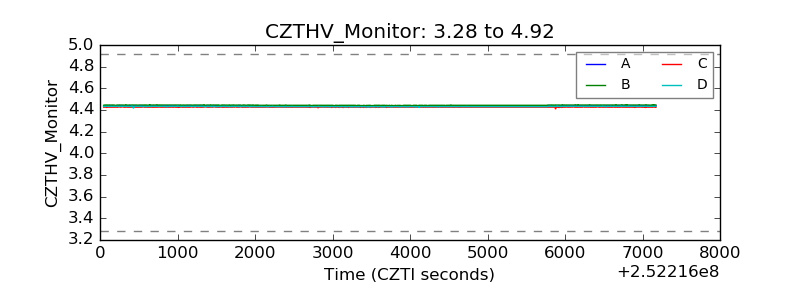 |
| D_VDD |  |
| Temperature 1 | 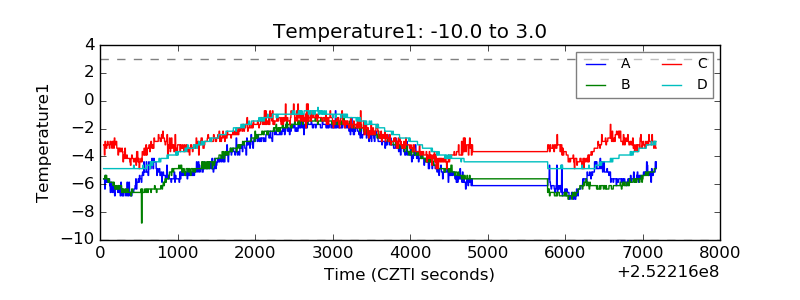 |
| Veto HV Monitor | 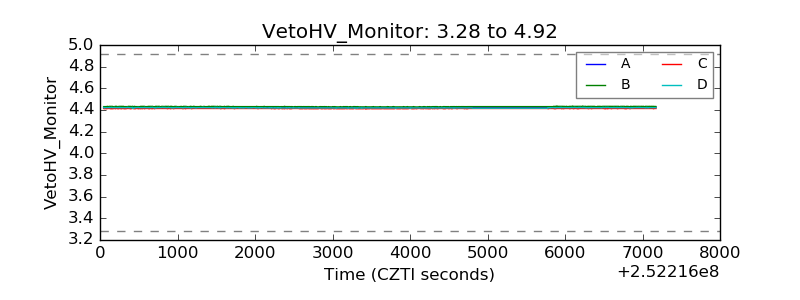 |
| Veto LLD | 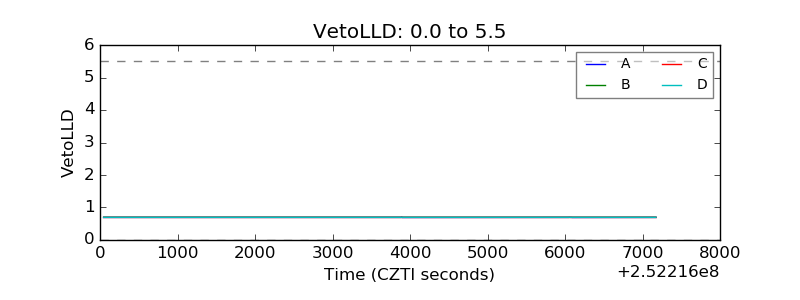 |
| Alpha Counter | 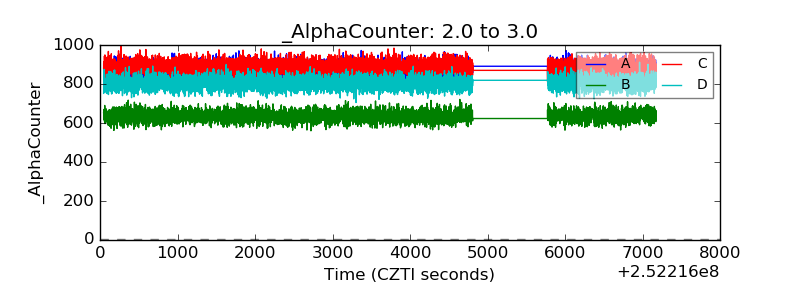 |
| _CPM_Rate |  |
| CZT Counter | 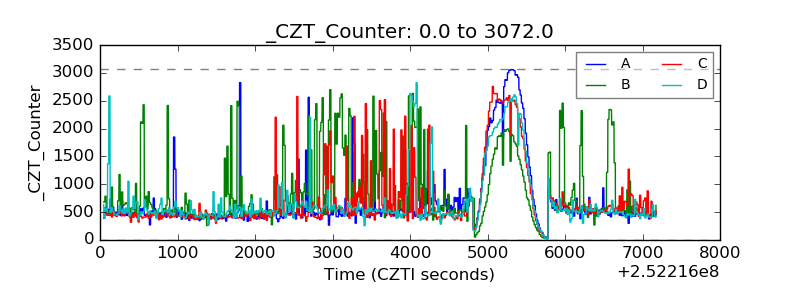 |
| +2.5 Volts monitor |  |
| +5 Volts monitor |  |
| _ROLL_ROT | 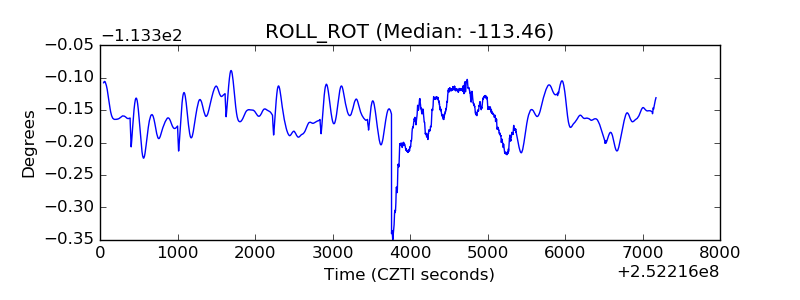 |
| _Roll_DEC |  |
| _Roll_RA | 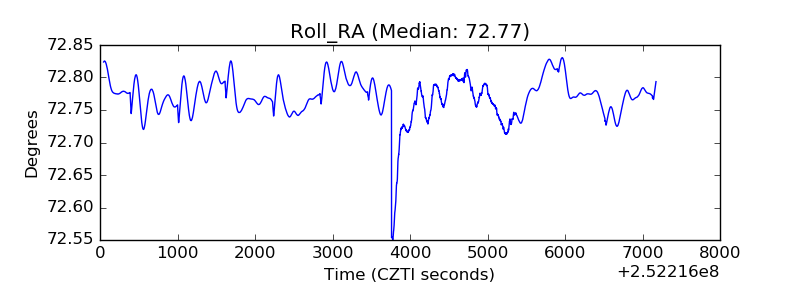 |
| Veto Counter | 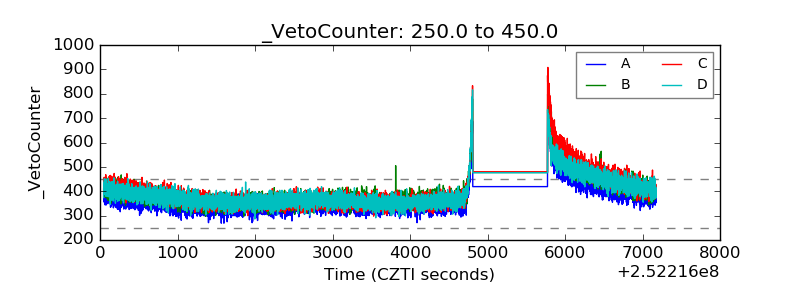 |