| Param | Original file | Final file |
|---|---|---|
| Filename | modeM0/AS1A04_160T01_9000001798_12184cztM0_level2.evt | modeM0/AS1A04_160T01_9000001798_12184cztM0_level2_quad_clean.evt |
| Size (bytes) | 579,476,160 | 123,543,360 |
| Size | 552.6 MB | 117.8 MB |
| Events in quadrant A | 3,760,988 | 840,654 |
| Events in quadrant B | 4,913,131 | 811,932 |
| Events in quadrant C | 5,117,677 | 826,851 |
| Events in quadrant D | 3,322,075 | 813,545 |
| Mode SS | |||
|---|---|---|---|
| Quadrant | BADHDUFLAG | Total packets | Discarded packets |
| A | 0 | 130 | 0 |
| B | 0 | 130 | 0 |
| C | 0 | 130 | 0 |
| D | 0 | 130 | 0 |
| Mode M9 | |||
|---|---|---|---|
| Quadrant | BADHDUFLAG | Total packets | Discarded packets |
| A | 0 | 11 | 0 |
| B | 0 | 11 | 0 |
| C | 0 | 11 | 0 |
| D | 0 | 11 | 0 |
| Mode M0 | |||
|---|---|---|---|
| Quadrant | BADHDUFLAG | Total packets | Discarded packets |
| A | 0 | 15388 | 60 |
| B | 0 | 18851 | 69 |
| C | 0 | 19477 | 55 |
| D | 0 | 14125 | 60 |
| Quadrant | Total seconds | Saturated seconds | Saturation percentage |
|---|---|---|---|
| A | 6429 | 234 | 3.639757% |
| B | 6426 | 766 | 11.920324% |
| C | 6428 | 499 | 7.762912% |
| D | 6428 | 104 | 1.617922% |
Noise dominated data is calculated using 1-second bins in cleaned event files. If a bin has >2000 counts, and if more than 50% of those come from <1% of pixels, then it is considered to be noise-dominated and hence unusable.
| Quadrant | # 1 sec bins | Bins with >0 counts | Bins with >2000 counts | High rate bins dominated by noise | Noise dominated (total time) | Noise dominated (detector-on time) | Marked lightcurve |
|---|---|---|---|---|---|---|---|
| A | 7574 | 6431 | 66 | 66 | 0.87% | 1.03% | 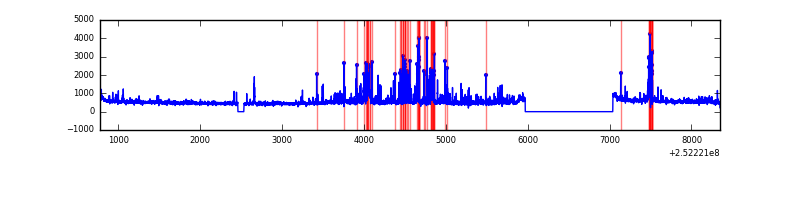 |
| B | 7574 | 6432 | 389 | 389 | 5.14% | 6.05% | 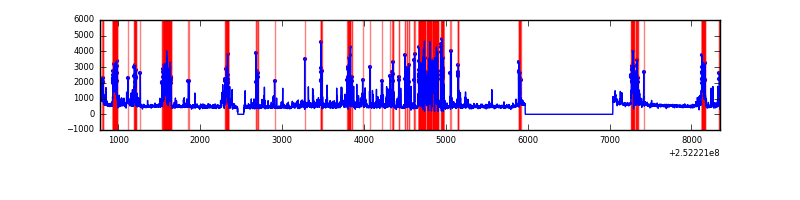 |
| C | 7574 | 6434 | 352 | 352 | 4.65% | 5.47% | 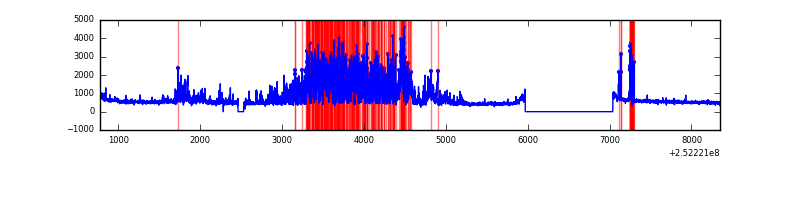 |
| D | 7575 | 6434 | 10 | 10 | 0.13% | 0.16% | 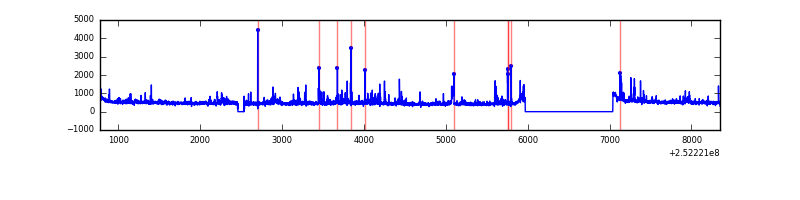 |
Top three noisy pixels from each quadrant. If the there are fewer than three noisy pixels in the level2.evt file, extra rows are filled as -1
| Pixel properties | Quadrant properties | ||||||
|---|---|---|---|---|---|---|---|
| Quadrant | DetID | PixID | Counts | Sigma | Mean | Median | Sigma |
| A | 9 | 143 | 380436 | 2409.8 | 782 | 766 | 157.6 |
| A | 8 | 15 | 124525 | 785.51 | 782 | 766 | 157.6 |
| A | 1 | 162 | 95883 | 603.72 | 782 | 766 | 157.6 |
| B | 4 | 239 | 1769927 | 12587.23 | 747 | 727 | 140.6 |
| B | 11 | 51 | 98132 | 693.0 | 747 | 727 | 140.6 |
| B | 15 | 204 | 41339 | 288.94 | 747 | 727 | 140.6 |
| C | 15 | 208 | 2154840 | 12438.3 | 758 | 760 | 173.2 |
| C | 13 | 61 | 5401 | 26.8 | 758 | 760 | 173.2 |
| C | 4 | 175 | 2715 | 11.29 | 758 | 760 | 173.2 |
| D | 4 | 95 | 104231 | 573.69 | 768 | 747 | 180.4 |
| D | 1 | 52 | 78763 | 432.5 | 768 | 747 | 180.4 |
| D | 10 | 50 | 57217 | 313.05 | 768 | 747 | 180.4 |
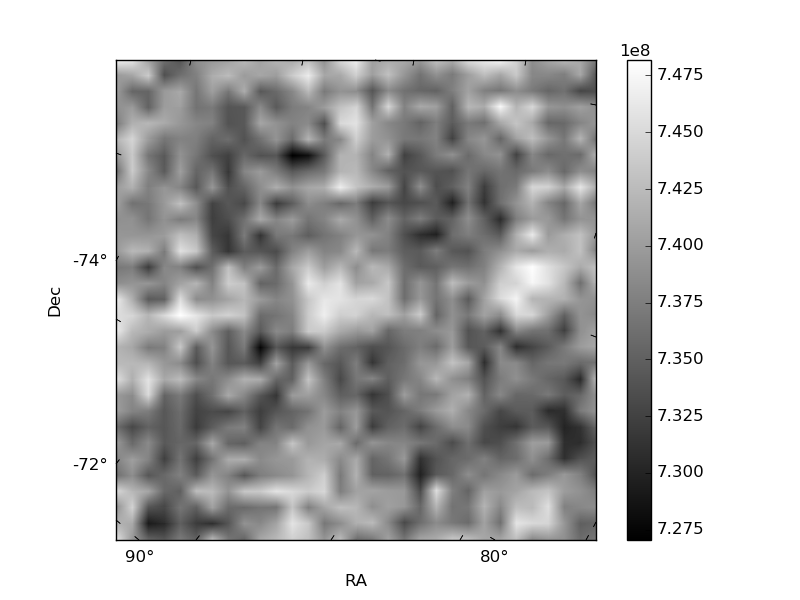
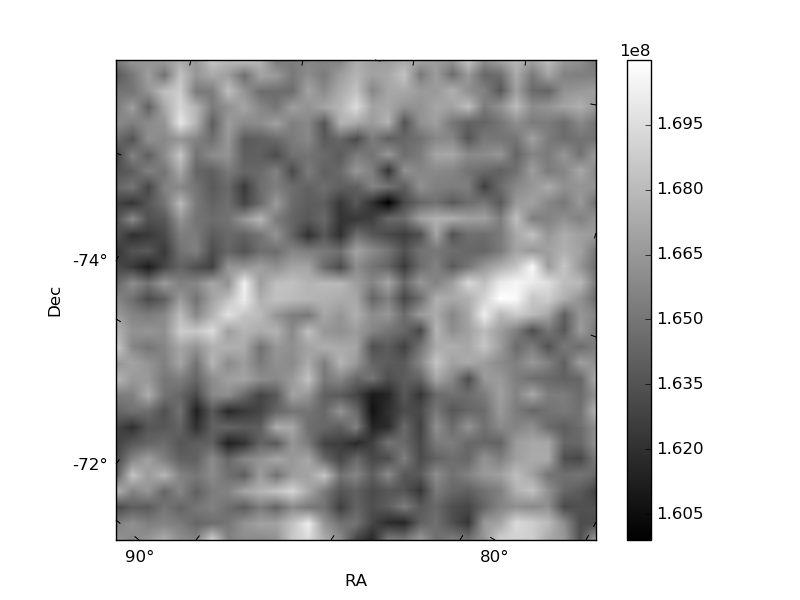
Histogram calculated using DETX and DETY for each event in the final _common_clean file
| Quadrant A | 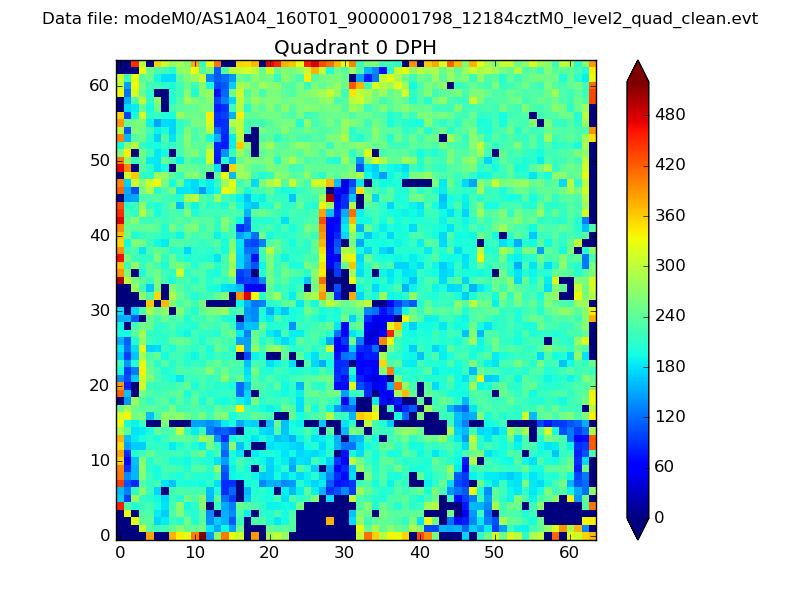 |
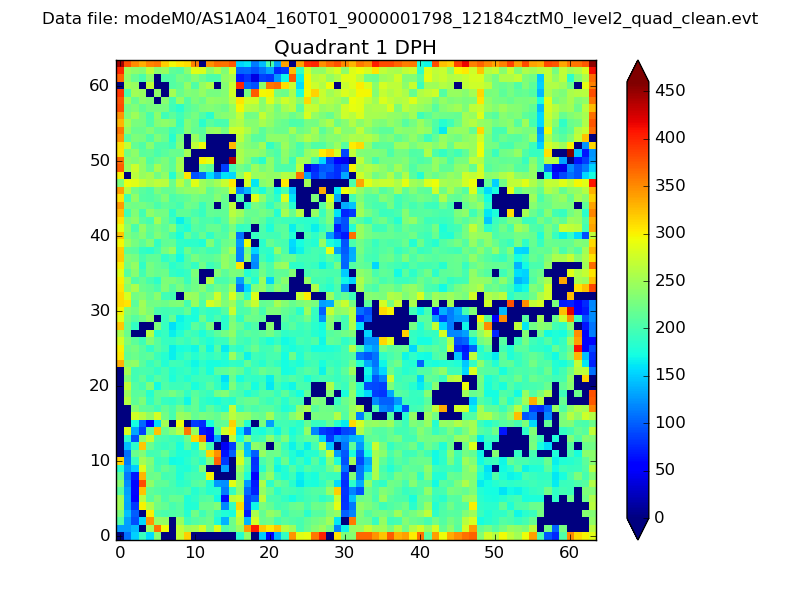 |
Quadrant B |
|---|---|---|---|
| Quadrant D | 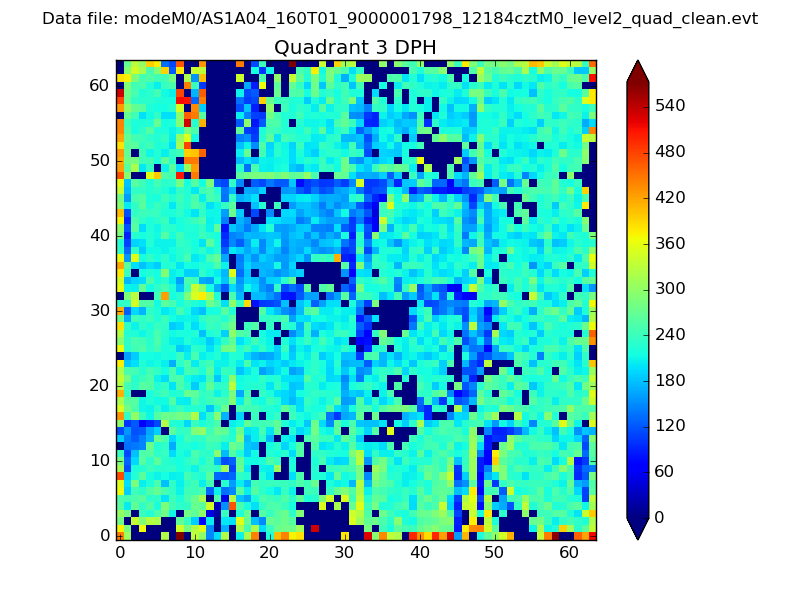 |
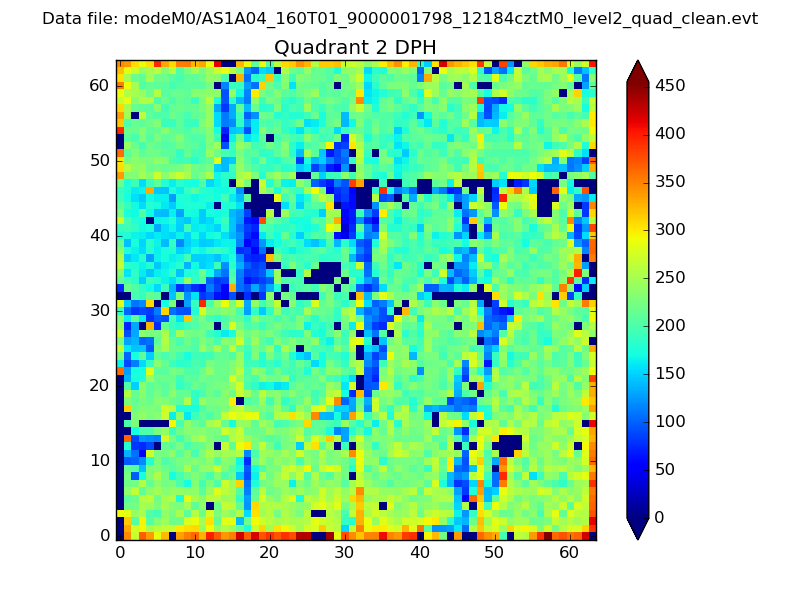 |
Quadrant C |
| Plot type | Count rate plots | Images |
|---|---|---|
| Comparison with Poisson distribution Blue bars denote a histogram of data divided into 1 sec bins. Red curve is a Poisson curve with rate = median count rate of data. |
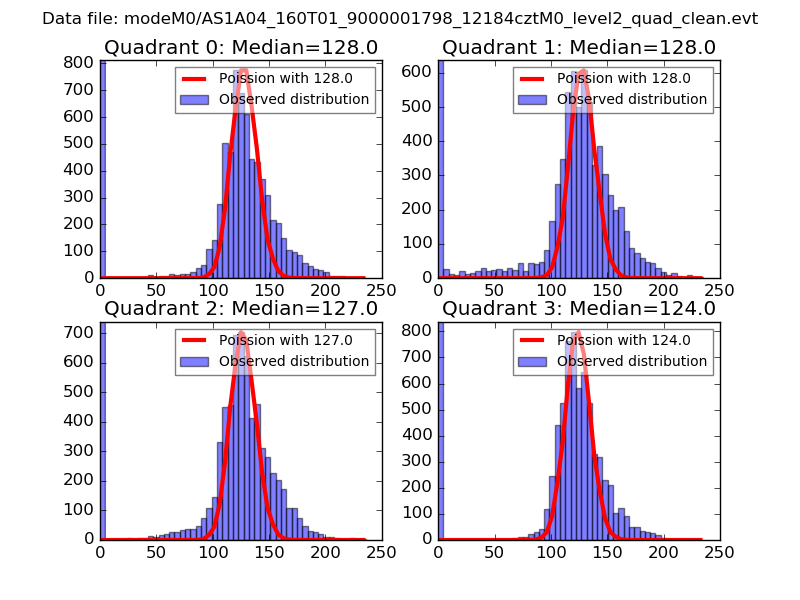 |
 |
| Quadrant-wise count rates Data is divided into 100 sec bins |
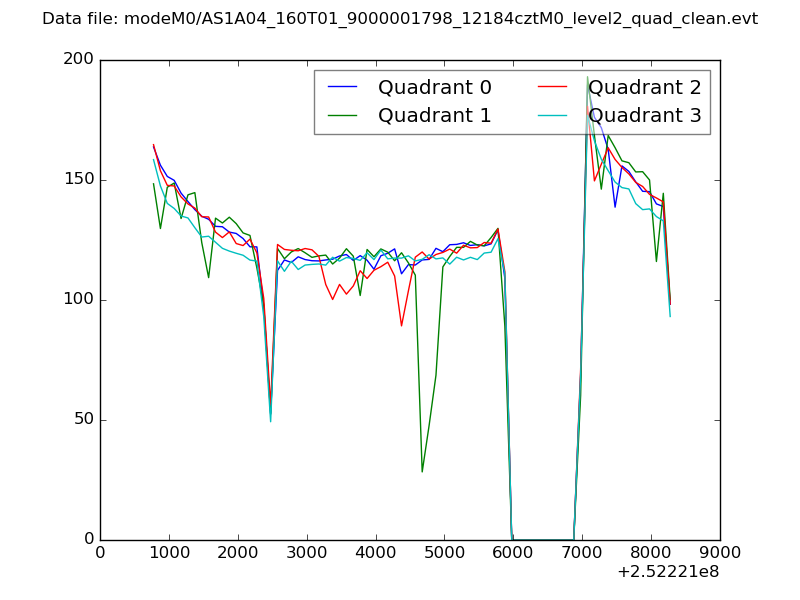 |
|
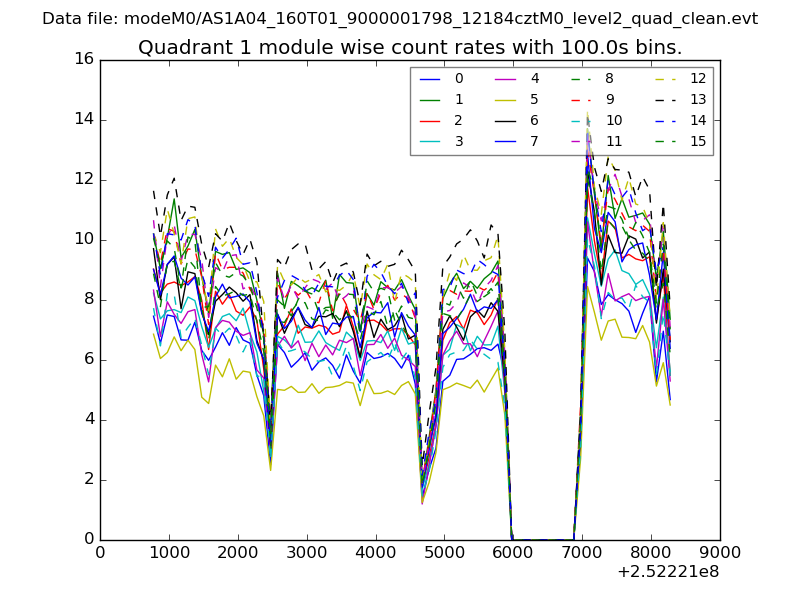
| Module-wise count rates for Quadrant A Data is divided into 100 sec bins |
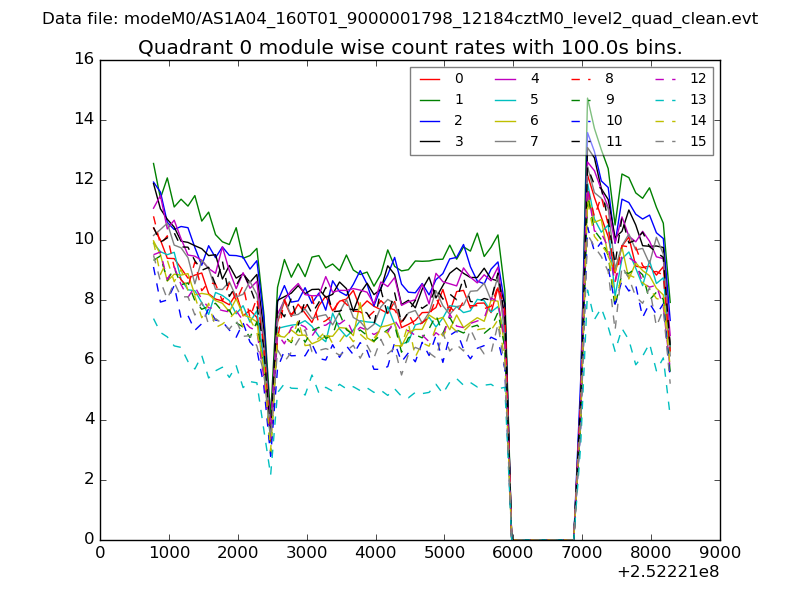 |
 |
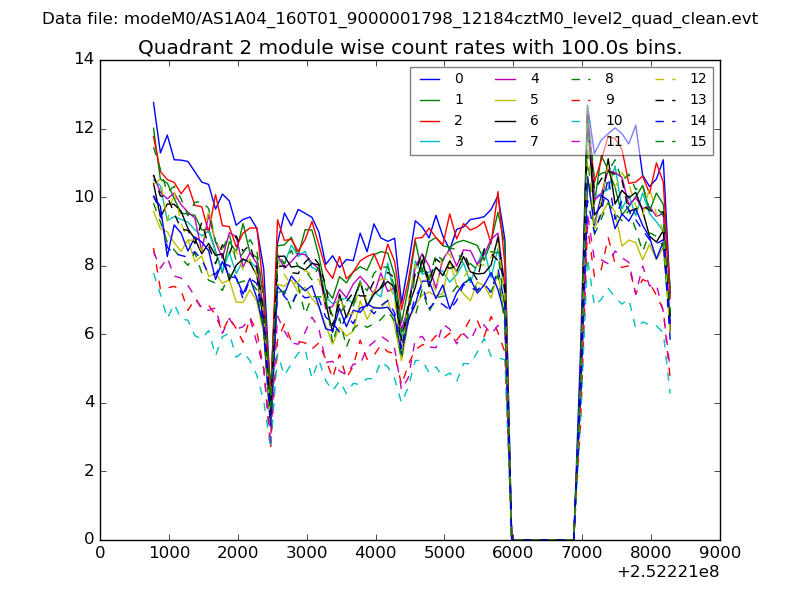
| Module-wise count rates for Quadrant B Data is divided into 100 sec bins |
 |
 |
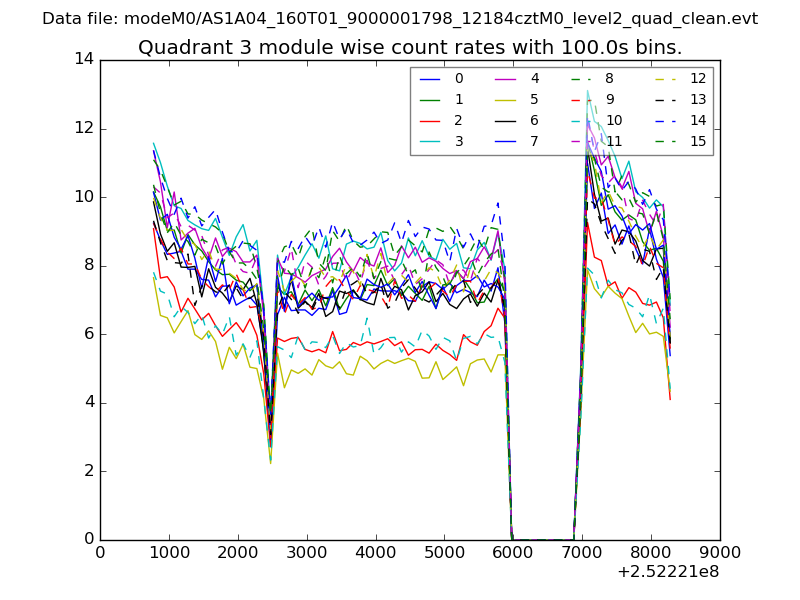
| Module-wise count rates for Quadrant C Data is divided into 100 sec bins |
 |
 |
| Module-wise count rates for Quadrant D Data is divided into 100 sec bins |
 |
 |
| Parameter | Plot |
|---|---|
| CZT HV Monitor | 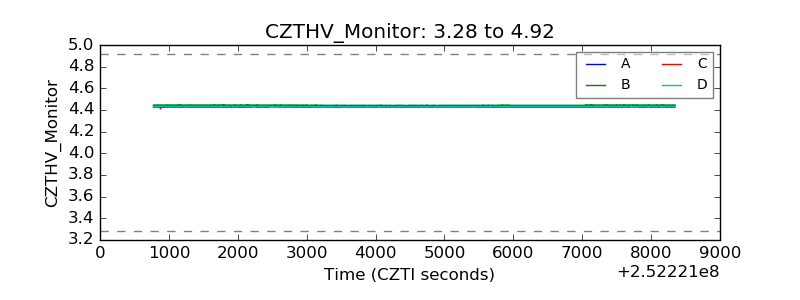 |
| D_VDD | 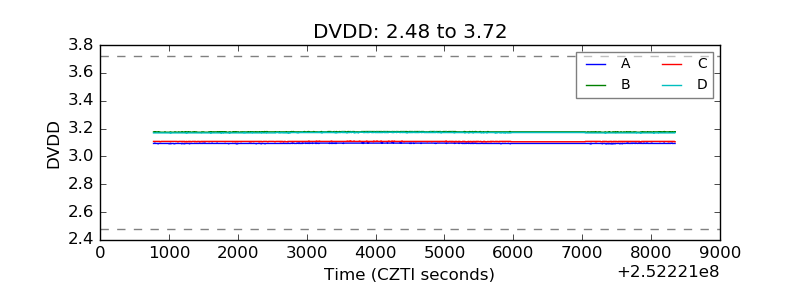 |
| Temperature 1 | 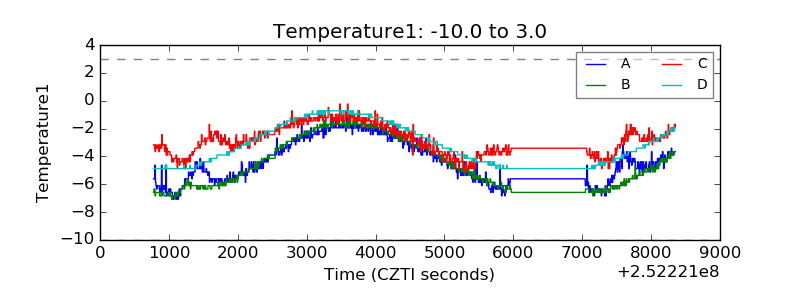 |
| Veto HV Monitor | 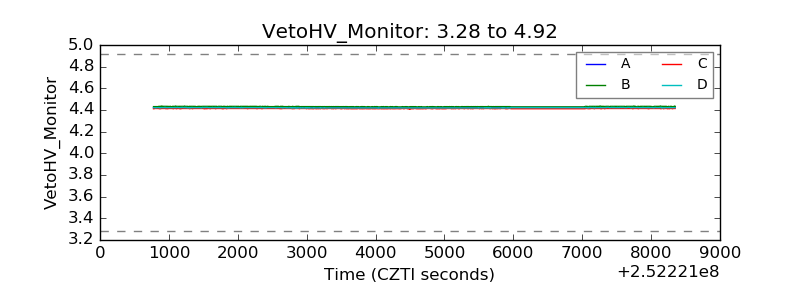 |
| Veto LLD | 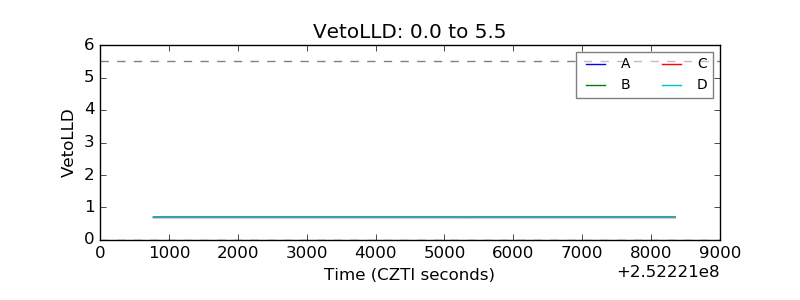 |
| Alpha Counter | 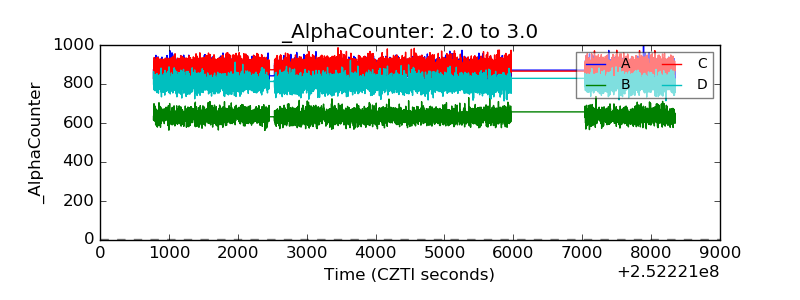 |
| _CPM_Rate | 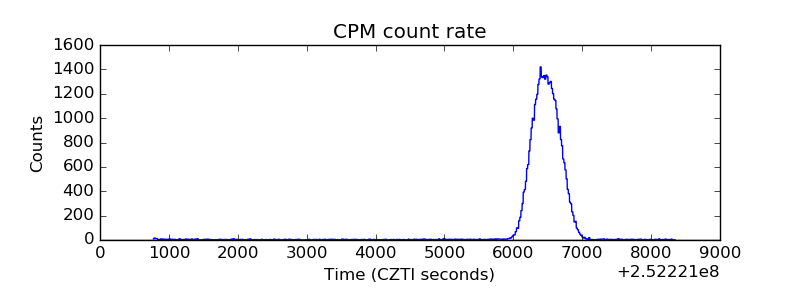 |
| CZT Counter | 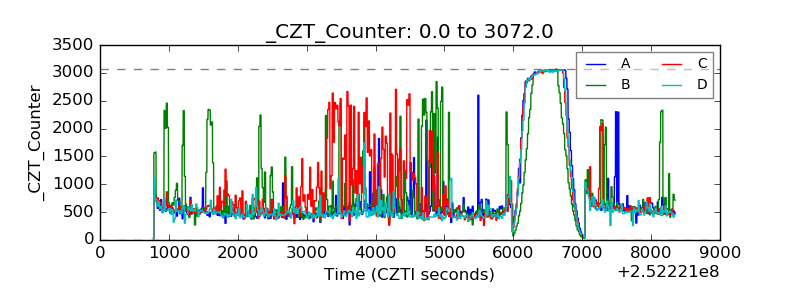 |
| +2.5 Volts monitor |  |
| +5 Volts monitor |  |
| _ROLL_ROT | 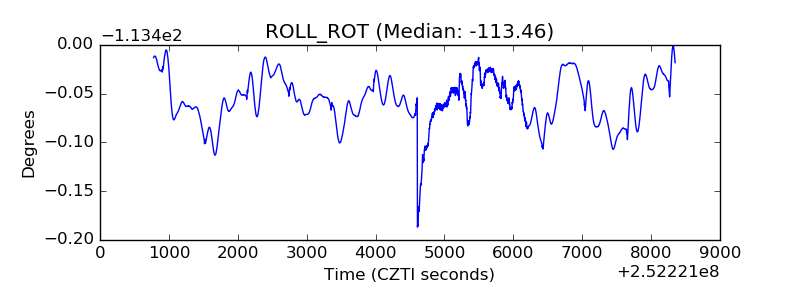 |
| _Roll_DEC | 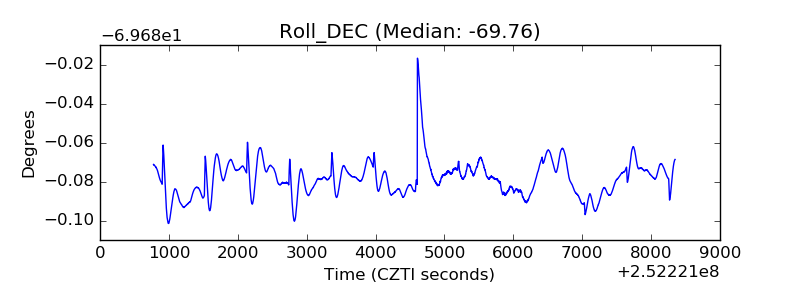 |
| _Roll_RA |  |
| Veto Counter | 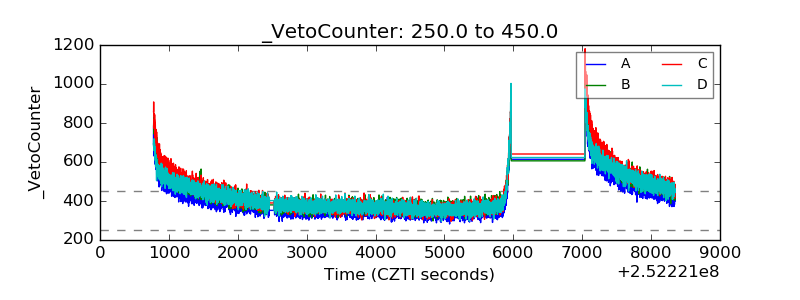 |