| Param | Original file | Final file |
|---|---|---|
| Filename | modeM0/AS1A04_160T01_9000001798_12185cztM0_level2.evt | modeM0/AS1A04_160T01_9000001798_12185cztM0_level2_quad_clean.evt |
| Size (bytes) | 504,961,920 | 127,379,520 |
| Size | 481.6 MB | 121.5 MB |
| Events in quadrant A | 3,398,662 | 871,252 |
| Events in quadrant B | 4,911,290 | 845,983 |
| Events in quadrant C | 3,416,502 | 869,616 |
| Events in quadrant D | 3,144,998 | 837,727 |
| Mode SS | |||
|---|---|---|---|
| Quadrant | BADHDUFLAG | Total packets | Discarded packets |
| A | 0 | 124 | 0 |
| B | 0 | 124 | 0 |
| C | 0 | 124 | 0 |
| D | 0 | 124 | 0 |
| Mode M9 | |||
|---|---|---|---|
| Quadrant | BADHDUFLAG | Total packets | Discarded packets |
| A | 0 | 12 | 0 |
| B | 0 | 12 | 0 |
| C | 0 | 12 | 0 |
| D | 0 | 12 | 0 |
| Mode M0 | |||
|---|---|---|---|
| Quadrant | BADHDUFLAG | Total packets | Discarded packets |
| A | 0 | 14119 | 2 |
| B | 0 | 18698 | 1 |
| C | 0 | 14324 | 1 |
| D | 0 | 13495 | 1 |
| Quadrant | Total seconds | Saturated seconds | Saturation percentage |
|---|---|---|---|
| A | 6208 | 120 | 1.932990% |
| B | 6208 | 621 | 10.003222% |
| C | 6208 | 142 | 2.287371% |
| D | 6208 | 75 | 1.208119% |
Noise dominated data is calculated using 1-second bins in cleaned event files. If a bin has >2000 counts, and if more than 50% of those come from <1% of pixels, then it is considered to be noise-dominated and hence unusable.
| Quadrant | # 1 sec bins | Bins with >0 counts | Bins with >2000 counts | High rate bins dominated by noise | Noise dominated (total time) | Noise dominated (detector-on time) | Marked lightcurve |
|---|---|---|---|---|---|---|---|
| A | 7424 | 6210 | 26 | 26 | 0.35% | 0.42% | 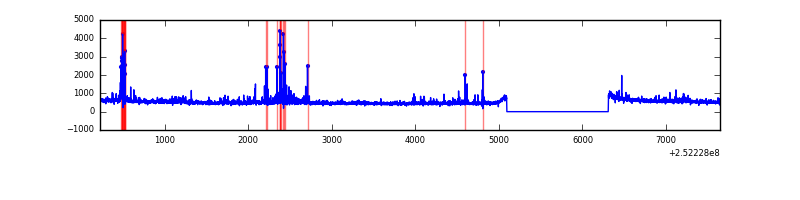 |
| B | 7424 | 6210 | 344 | 344 | 4.63% | 5.54% | 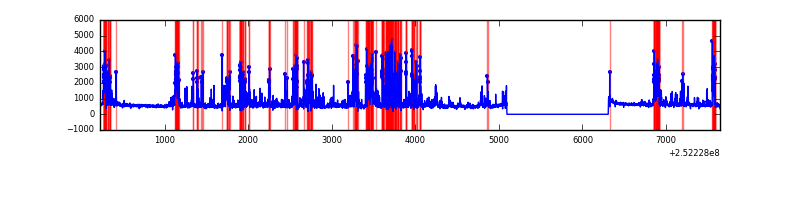 |
| C | 7424 | 6210 | 64 | 64 | 0.86% | 1.03% |  |
| D | 7424 | 6210 | 22 | 22 | 0.30% | 0.35% | 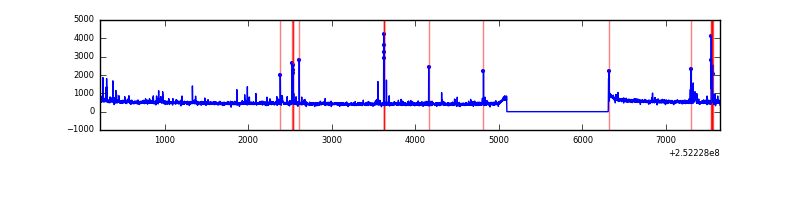 |
Top three noisy pixels from each quadrant. If the there are fewer than three noisy pixels in the level2.evt file, extra rows are filled as -1
| Pixel properties | Quadrant properties | ||||||
|---|---|---|---|---|---|---|---|
| Quadrant | DetID | PixID | Counts | Sigma | Mean | Median | Sigma |
| A | 9 | 143 | 137646 | 881.61 | 784 | 772 | 155.3 |
| A | 1 | 162 | 74548 | 475.2 | 784 | 772 | 155.3 |
| A | 8 | 15 | 49578 | 314.36 | 784 | 772 | 155.3 |
| B | 4 | 239 | 1444416 | 10430.39 | 750 | 734 | 138.4 |
| B | 10 | 16 | 153034 | 1100.34 | 750 | 734 | 138.4 |
| B | 15 | 204 | 139763 | 1004.46 | 750 | 734 | 138.4 |
| C | 15 | 208 | 441243 | 2558.02 | 760 | 762 | 172.2 |
| C | 13 | 61 | 5476 | 27.38 | 760 | 762 | 172.2 |
| C | 4 | 175 | 4486 | 21.63 | 760 | 762 | 172.2 |
| D | 1 | 52 | 68783 | 384.54 | 760 | 740 | 176.9 |
| D | 14 | 34 | 56790 | 316.76 | 760 | 740 | 176.9 |
| D | 9 | 85 | 25865 | 141.99 | 760 | 740 | 176.9 |
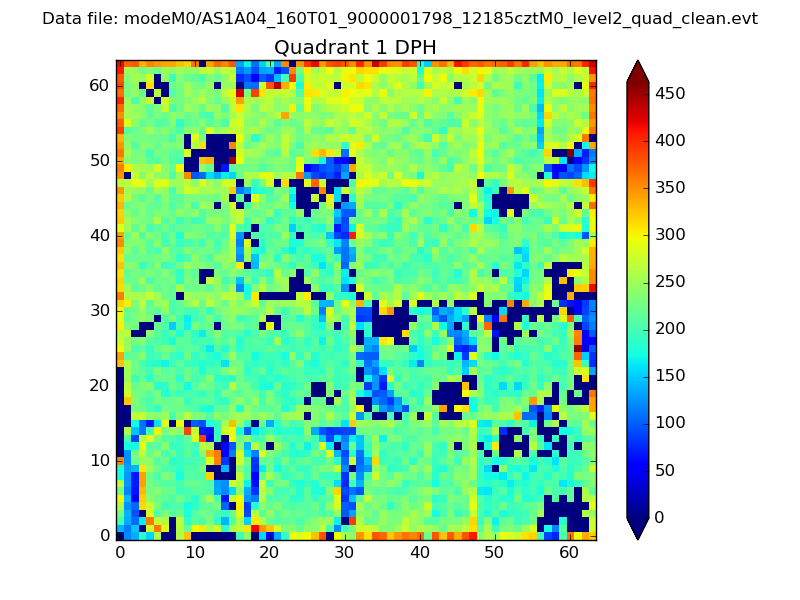
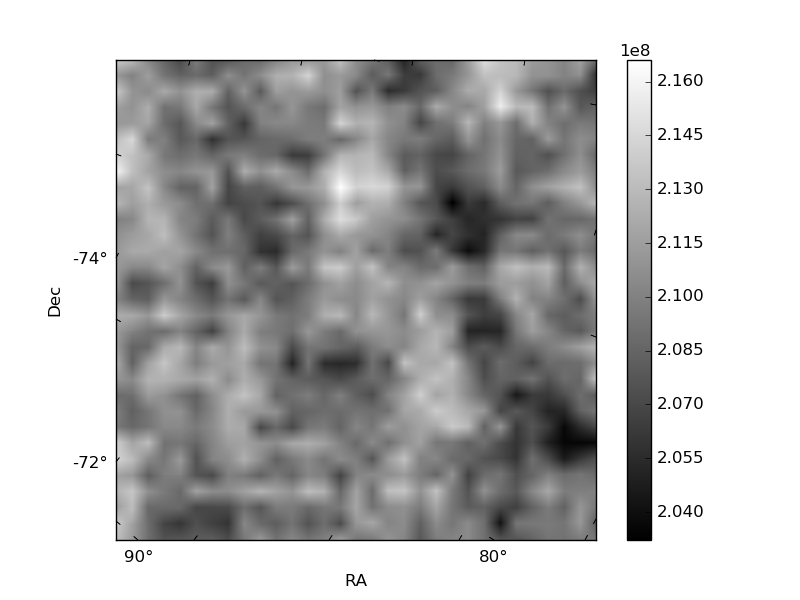
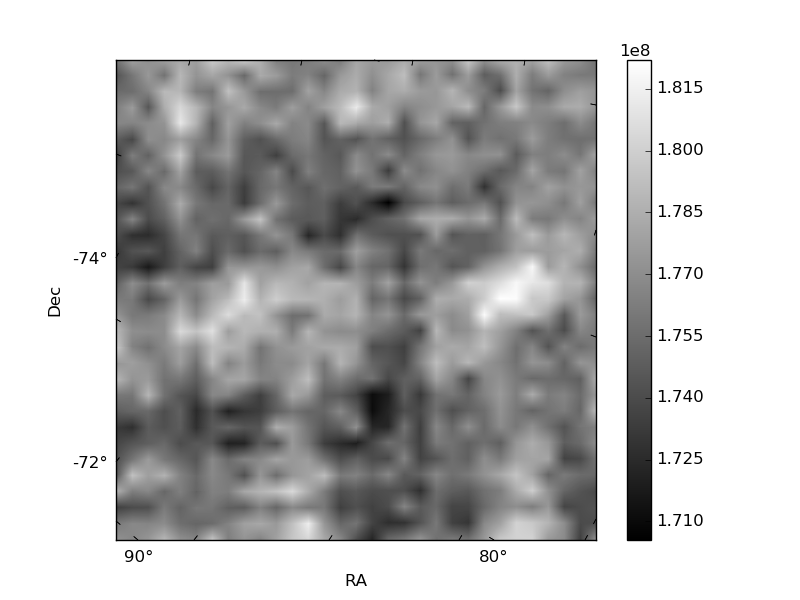
Histogram calculated using DETX and DETY for each event in the final _common_clean file
| Quadrant A | 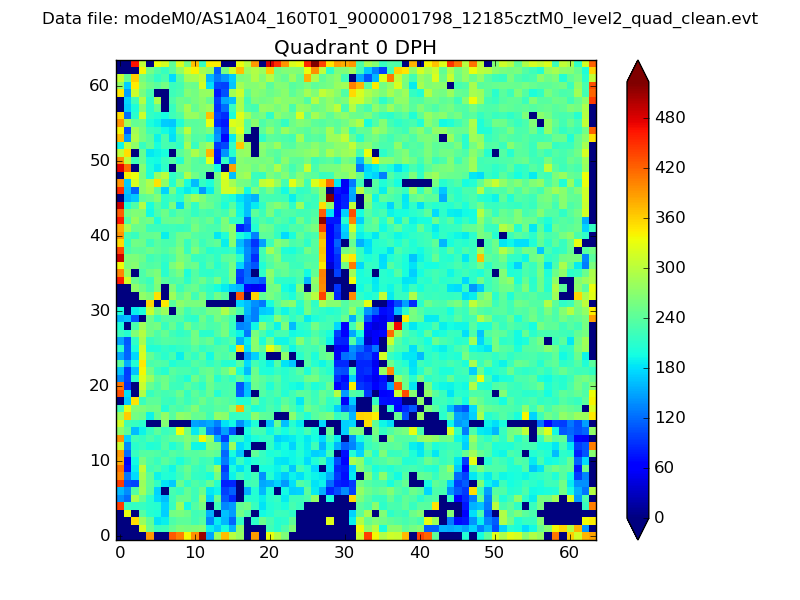 |
 |
Quadrant B |
|---|---|---|---|
| Quadrant D | 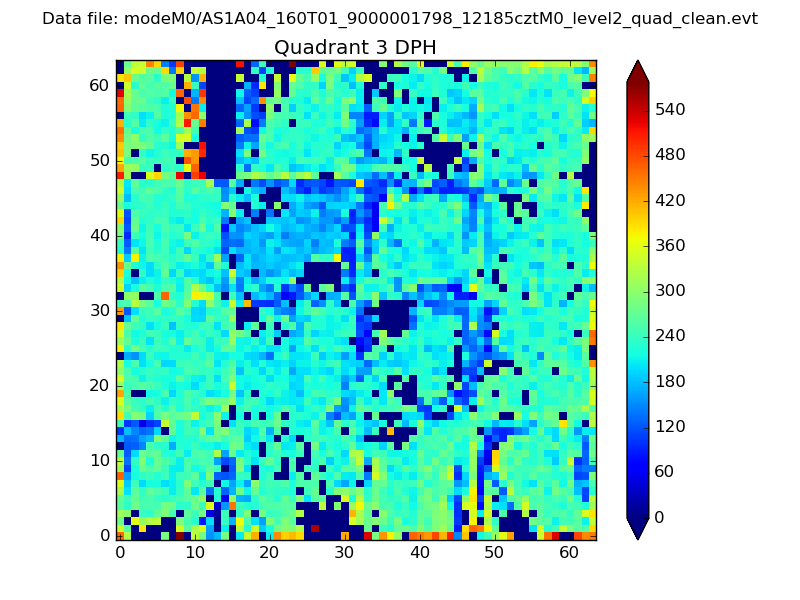 |
 |
Quadrant C |
| Plot type | Count rate plots | Images |
|---|---|---|
| Comparison with Poisson distribution Blue bars denote a histogram of data divided into 1 sec bins. Red curve is a Poisson curve with rate = median count rate of data. |
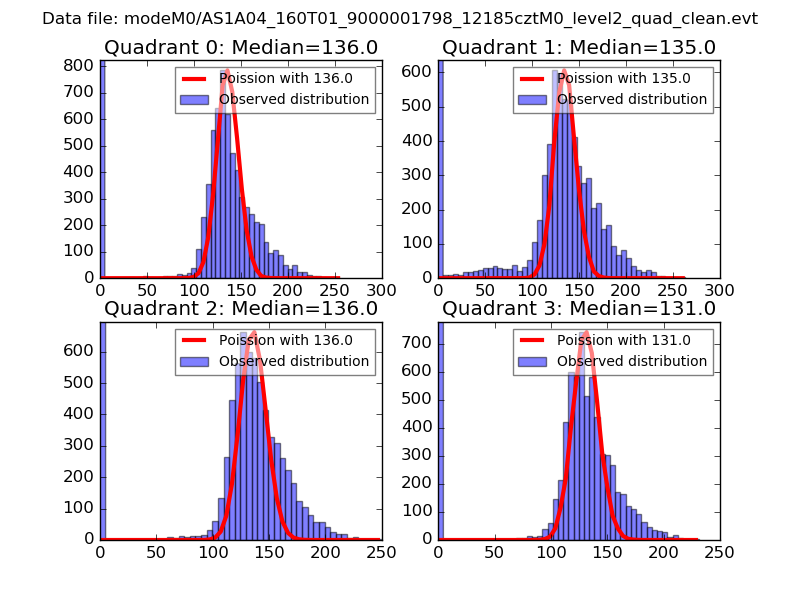 |
 |
| Quadrant-wise count rates Data is divided into 100 sec bins |
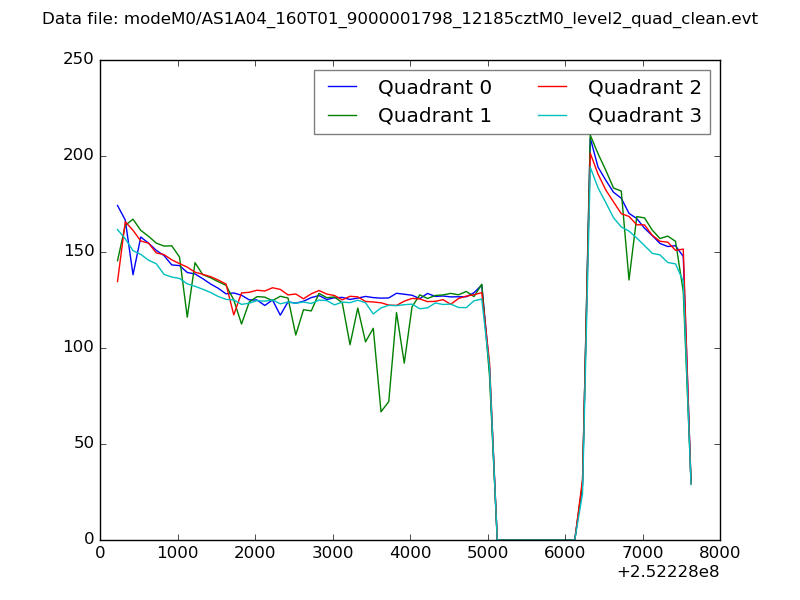 |
|
| Module-wise count rates for Quadrant A Data is divided into 100 sec bins |
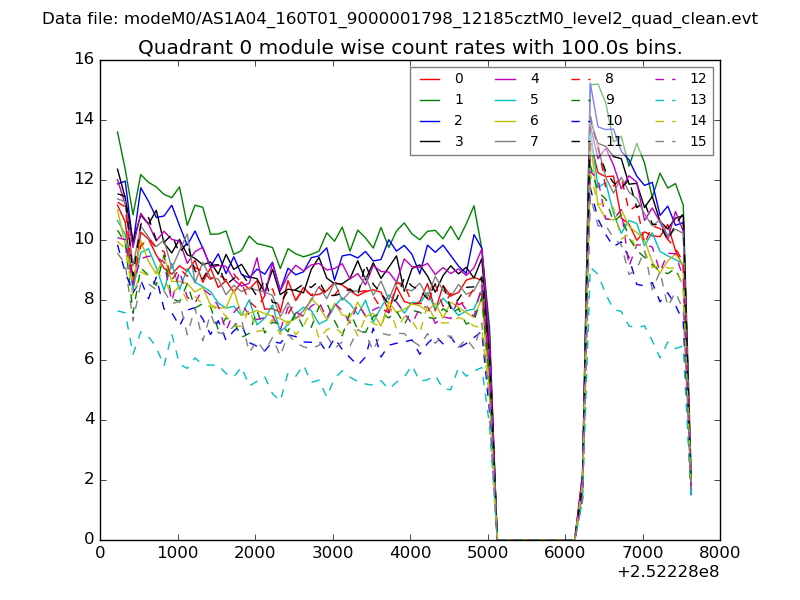 |
 |
| Module-wise count rates for Quadrant B Data is divided into 100 sec bins |
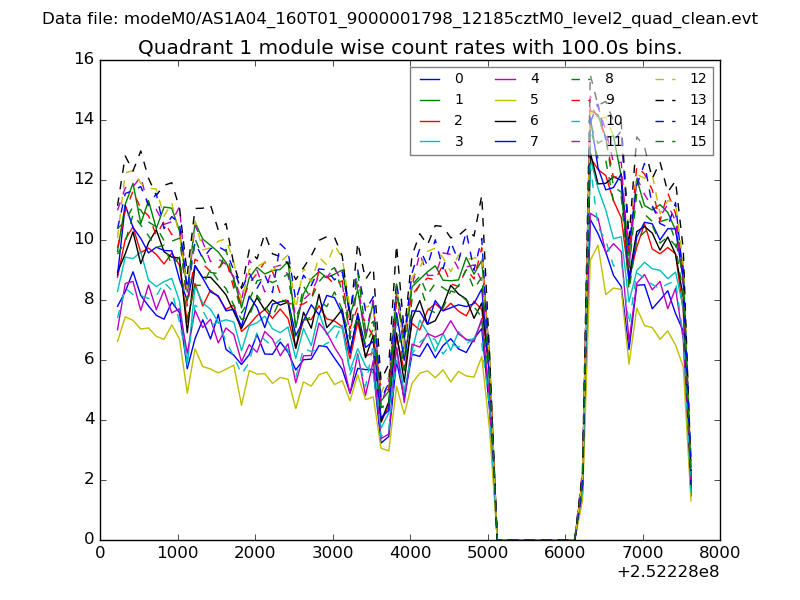 |
 |
| Module-wise count rates for Quadrant C Data is divided into 100 sec bins |
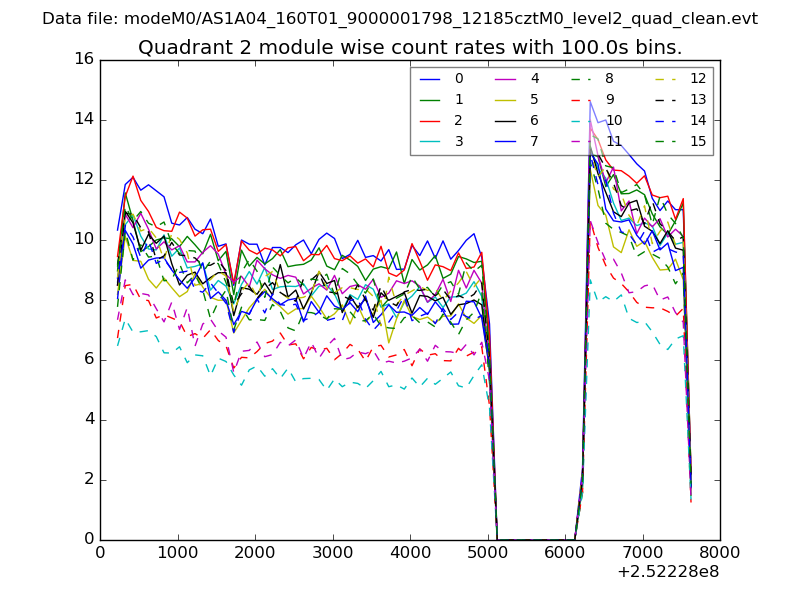 |
 |
| Module-wise count rates for Quadrant D Data is divided into 100 sec bins |
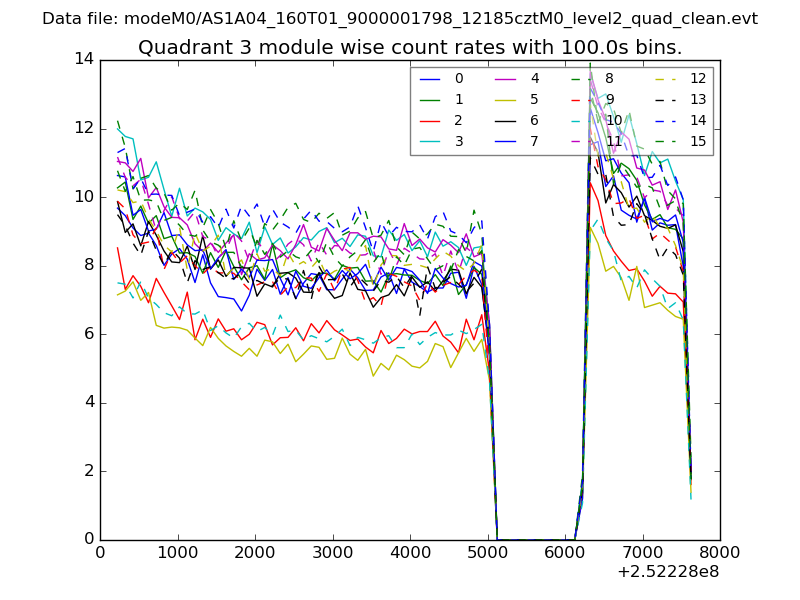 |
 |
| Parameter | Plot |
|---|---|
| CZT HV Monitor | 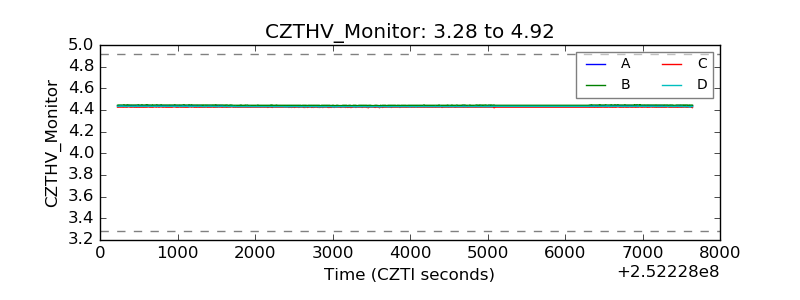 |
| D_VDD | 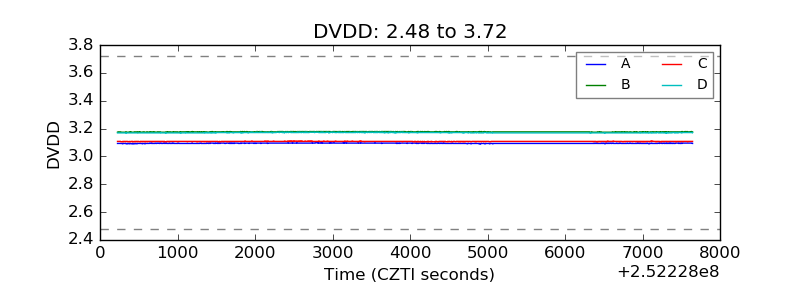 |
| Temperature 1 | 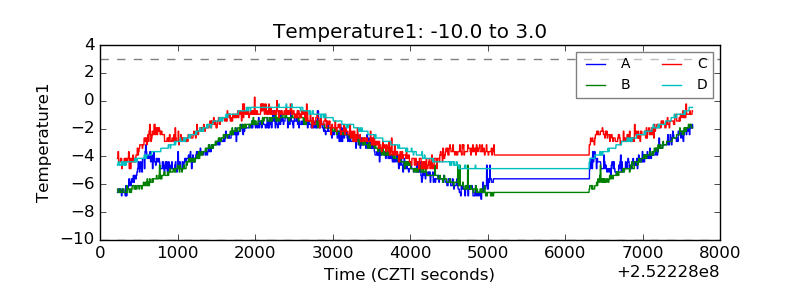 |
| Veto HV Monitor | 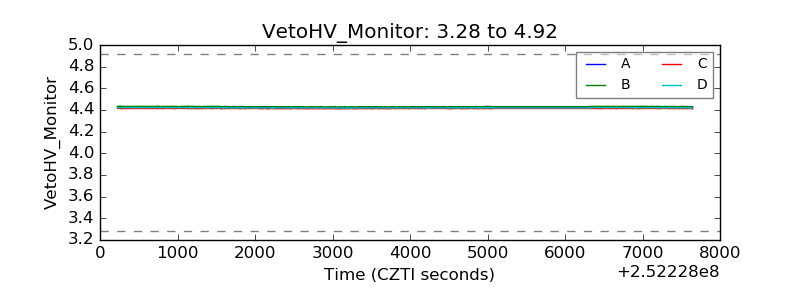 |
| Veto LLD | 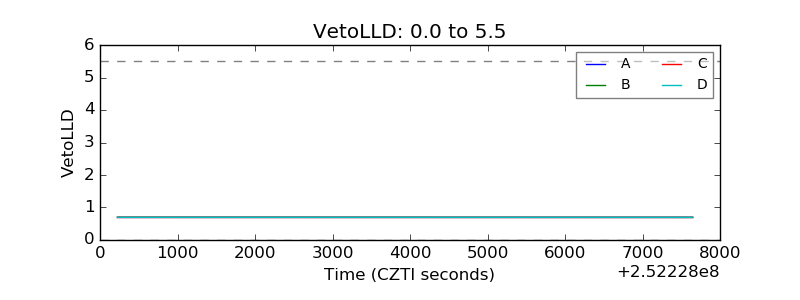 |
| Alpha Counter | 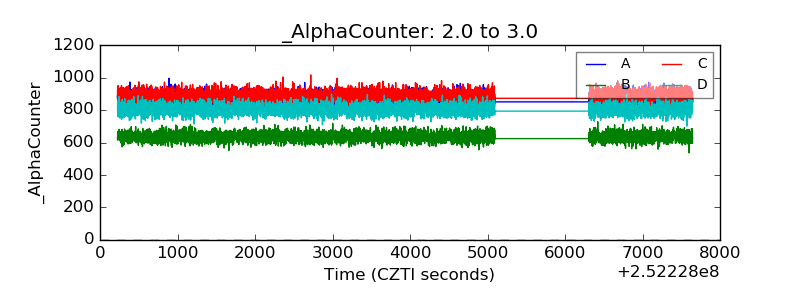 |
| _CPM_Rate | 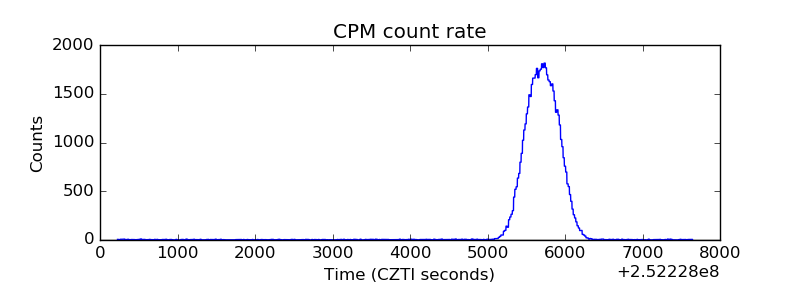 |
| CZT Counter | 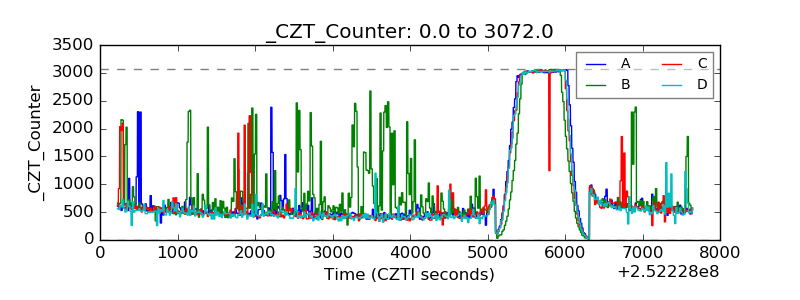 |
| +2.5 Volts monitor | 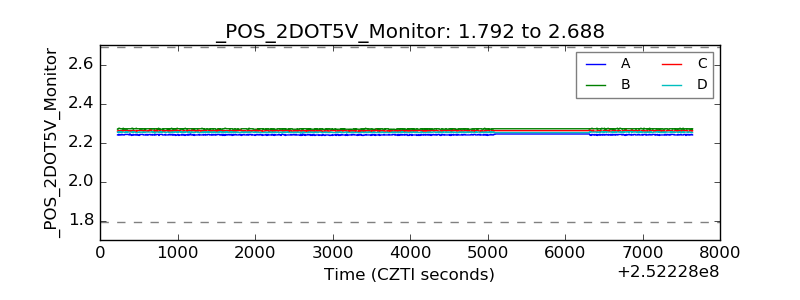 |
| +5 Volts monitor |  |
| _ROLL_ROT | 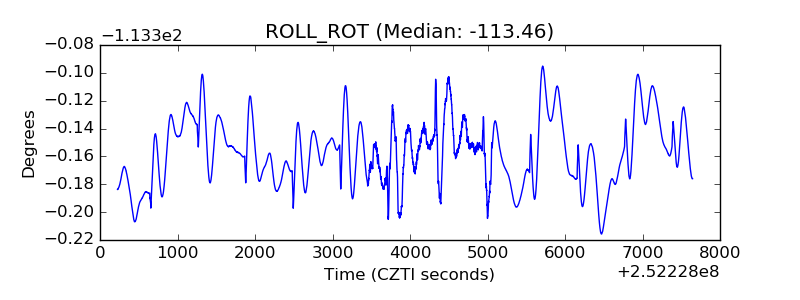 |
| _Roll_DEC | 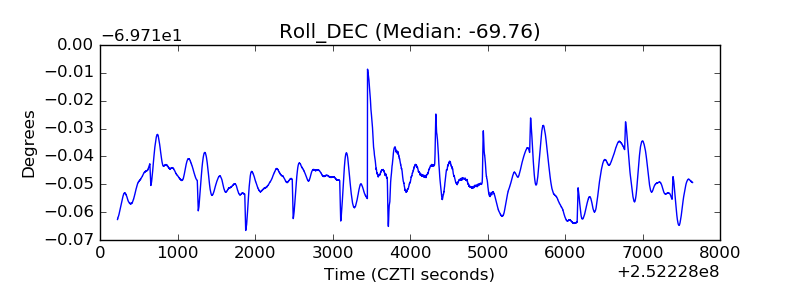 |
| _Roll_RA | 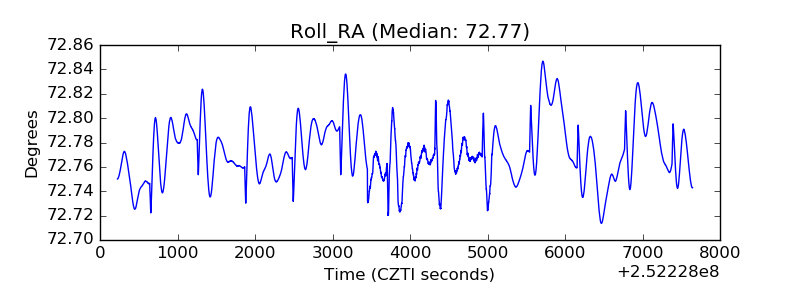 |
| Veto Counter | 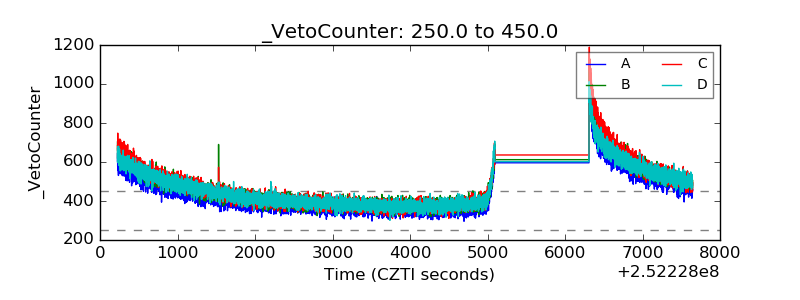 |