| Param | Original file | Final file |
|---|---|---|
| Filename | modeM0/AS1A04_160T01_9000001798_12186cztM0_level2.evt | modeM0/AS1A04_160T01_9000001798_12186cztM0_level2_quad_clean.evt |
| Size (bytes) | 542,318,400 | 135,656,640 |
| Size | 517.2 MB | 129.4 MB |
| Events in quadrant A | 3,607,473 | 942,561 |
| Events in quadrant B | 5,327,444 | 895,428 |
| Events in quadrant C | 3,683,318 | 931,841 |
| Events in quadrant D | 3,379,117 | 899,425 |
| Mode SS | |||
|---|---|---|---|
| Quadrant | BADHDUFLAG | Total packets | Discarded packets |
| A | 0 | 128 | 0 |
| B | 0 | 128 | 0 |
| C | 0 | 128 | 0 |
| D | 0 | 128 | 0 |
| Mode M9 | |||
|---|---|---|---|
| Quadrant | BADHDUFLAG | Total packets | Discarded packets |
| A | 0 | 12 | 0 |
| B | 0 | 12 | 0 |
| C | 0 | 12 | 0 |
| D | 0 | 13 | 0 |
| Mode M0 | |||
|---|---|---|---|
| Quadrant | BADHDUFLAG | Total packets | Discarded packets |
| A | 0 | 14881 | 3 |
| B | 0 | 20250 | 2 |
| C | 0 | 15091 | 2 |
| D | 0 | 14159 | 2 |
| Quadrant | Total seconds | Saturated seconds | Saturation percentage |
|---|---|---|---|
| A | 6292 | 164 | 2.606484% |
| B | 6292 | 826 | 13.127781% |
| C | 6292 | 190 | 3.019708% |
| D | 6292 | 126 | 2.002543% |
Noise dominated data is calculated using 1-second bins in cleaned event files. If a bin has >2000 counts, and if more than 50% of those come from <1% of pixels, then it is considered to be noise-dominated and hence unusable.
| Quadrant | # 1 sec bins | Bins with >0 counts | Bins with >2000 counts | High rate bins dominated by noise | Noise dominated (total time) | Noise dominated (detector-on time) | Marked lightcurve |
|---|---|---|---|---|---|---|---|
| A | 7558 | 6293 | 11 | 11 | 0.15% | 0.17% | 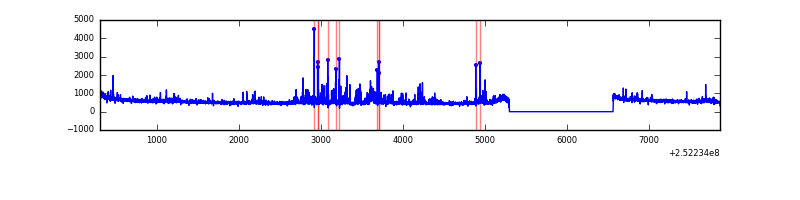 |
| B | 7558 | 6294 | 385 | 385 | 5.09% | 6.12% | 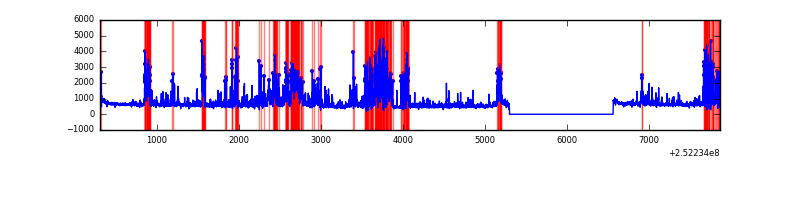 |
| C | 7558 | 6294 | 61 | 61 | 0.81% | 0.97% | 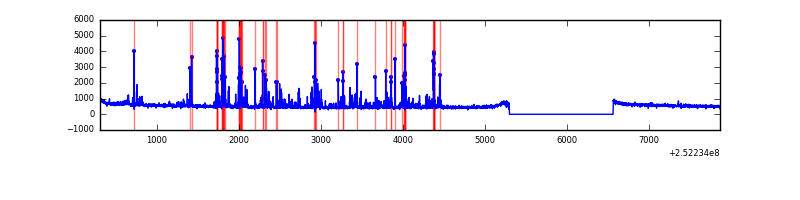 |
| D | 7558 | 6294 | 14 | 14 | 0.19% | 0.22% |  |
Top three noisy pixels from each quadrant. If the there are fewer than three noisy pixels in the level2.evt file, extra rows are filled as -1
| Pixel properties | Quadrant properties | ||||||
|---|---|---|---|---|---|---|---|
| Quadrant | DetID | PixID | Counts | Sigma | Mean | Median | Sigma |
| A | 1 | 162 | 158244 | 955.66 | 833 | 822 | 164.7 |
| A | 1 | 178 | 63282 | 379.17 | 833 | 822 | 164.7 |
| A | 1 | 161 | 60955 | 365.05 | 833 | 822 | 164.7 |
| B | 4 | 239 | 1725213 | 12231.75 | 782 | 767 | 141.0 |
| B | 15 | 204 | 170008 | 1200.45 | 782 | 767 | 141.0 |
| B | 11 | 51 | 132217 | 932.39 | 782 | 767 | 141.0 |
| C | 15 | 208 | 520651 | 2877.78 | 801 | 803 | 180.6 |
| C | 0 | 207 | 32682 | 176.47 | 801 | 803 | 180.6 |
| C | 13 | 61 | 5835 | 27.85 | 801 | 803 | 180.6 |
| D | 14 | 34 | 87361 | 460.42 | 808 | 787 | 188.0 |
| D | 1 | 52 | 44931 | 234.77 | 808 | 787 | 188.0 |
| D | 10 | 199 | 42319 | 220.88 | 808 | 787 | 188.0 |
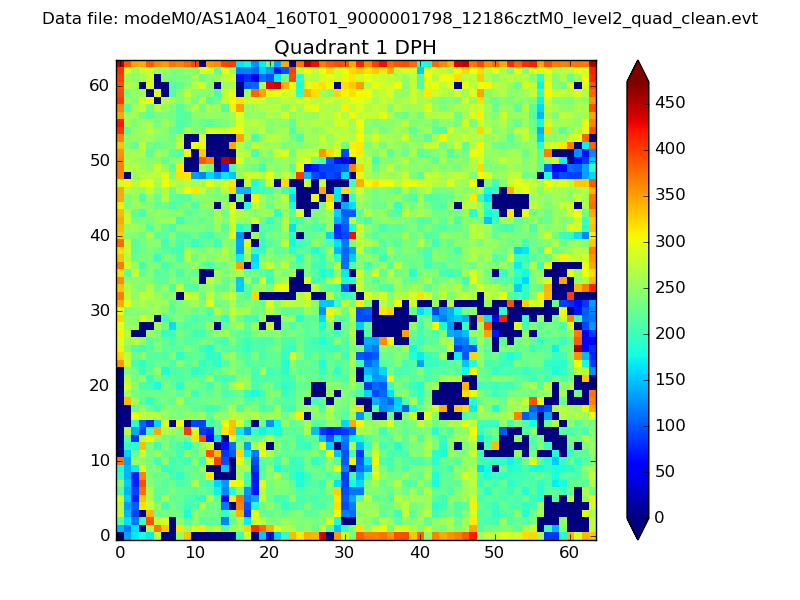
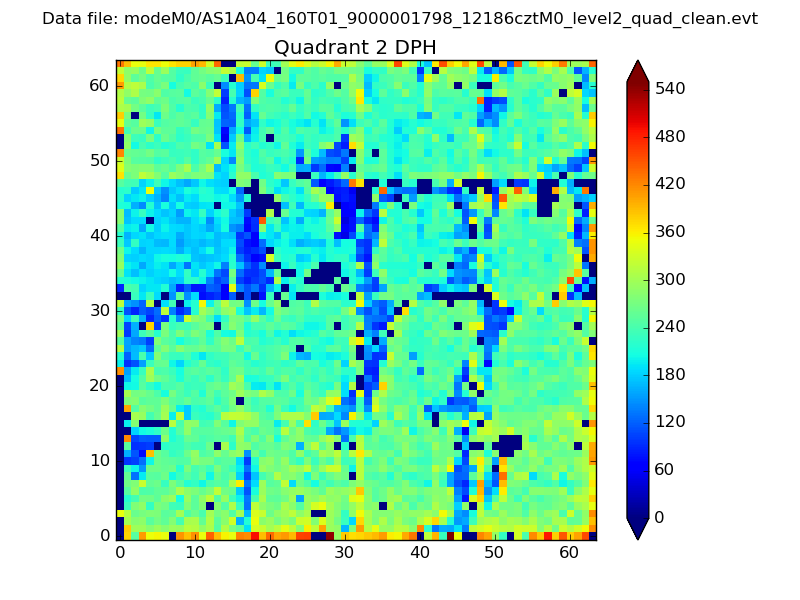
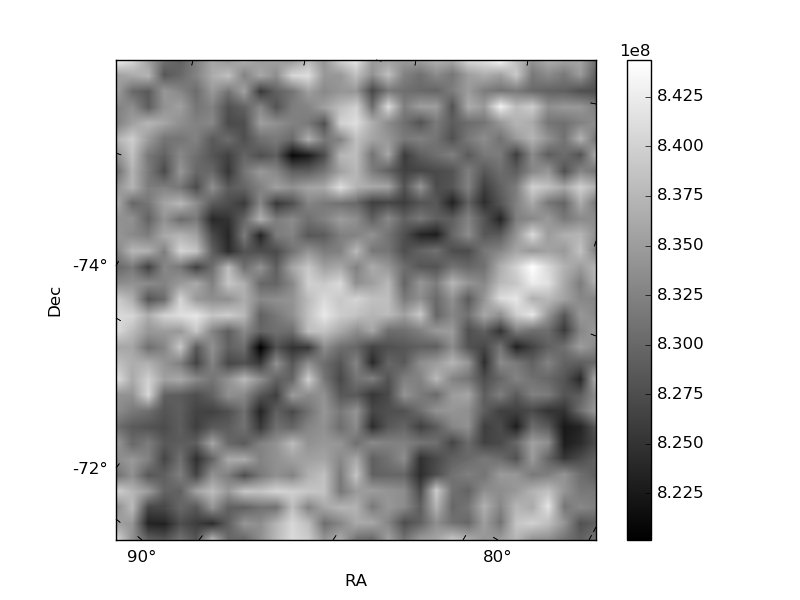
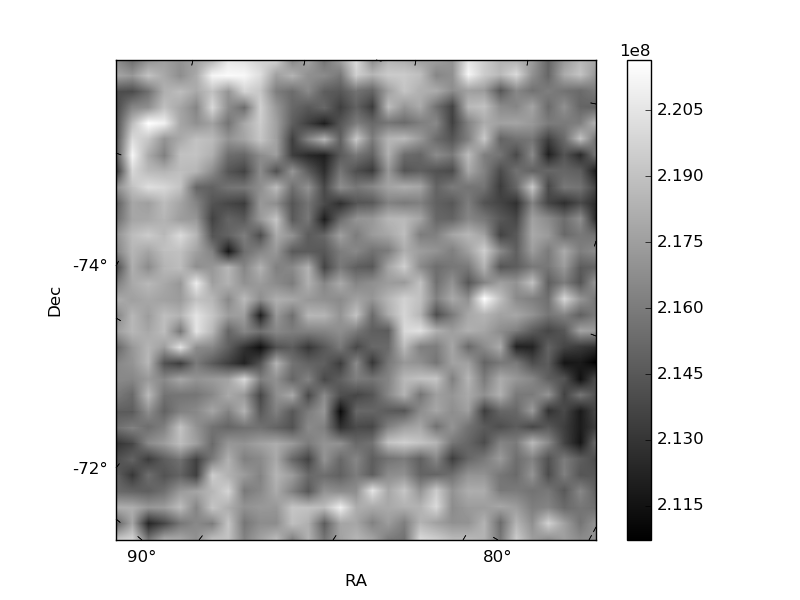
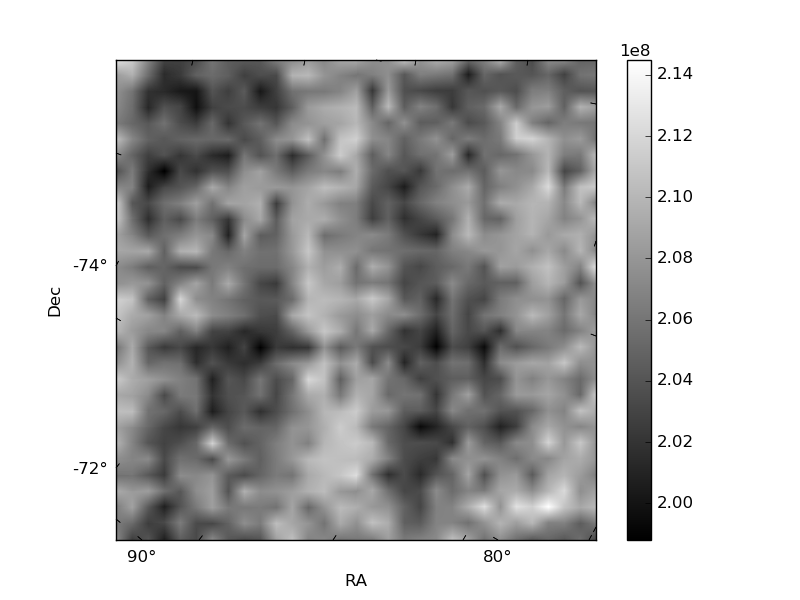
Histogram calculated using DETX and DETY for each event in the final _common_clean file
| Quadrant A | 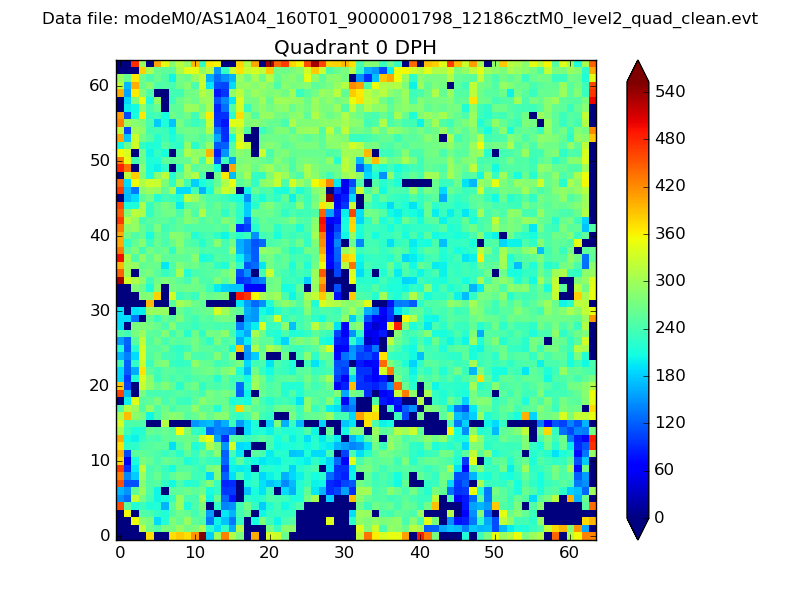 |
 |
Quadrant B |
|---|---|---|---|
| Quadrant D | 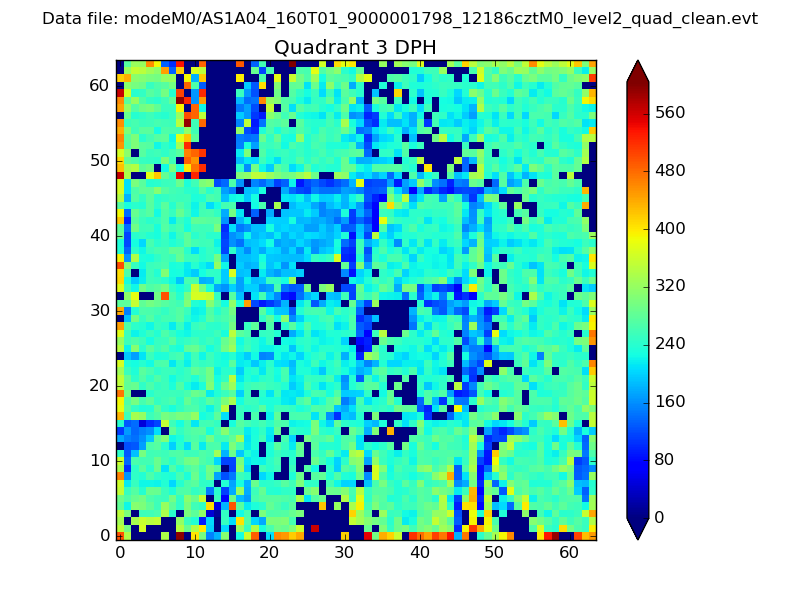 |
 |
Quadrant C |
| Plot type | Count rate plots | Images |
|---|---|---|
| Comparison with Poisson distribution Blue bars denote a histogram of data divided into 1 sec bins. Red curve is a Poisson curve with rate = median count rate of data. |
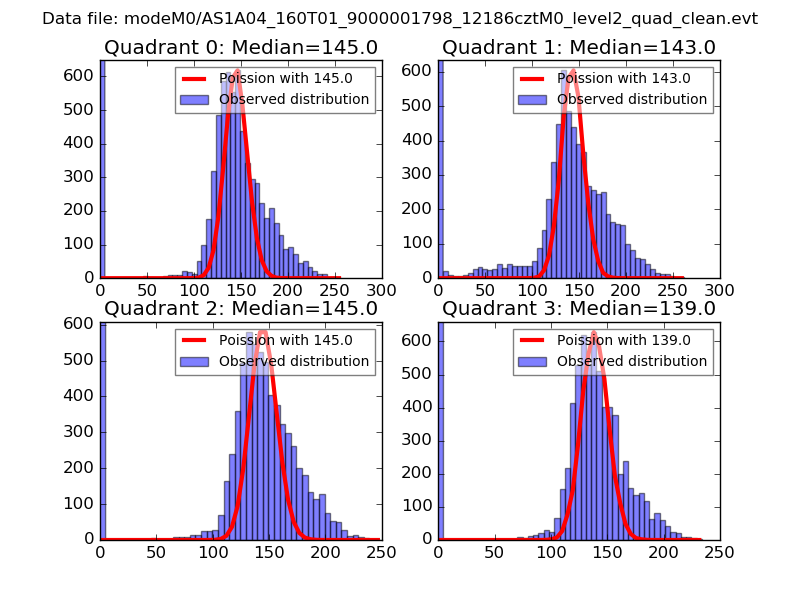 |
 |
| Quadrant-wise count rates Data is divided into 100 sec bins |
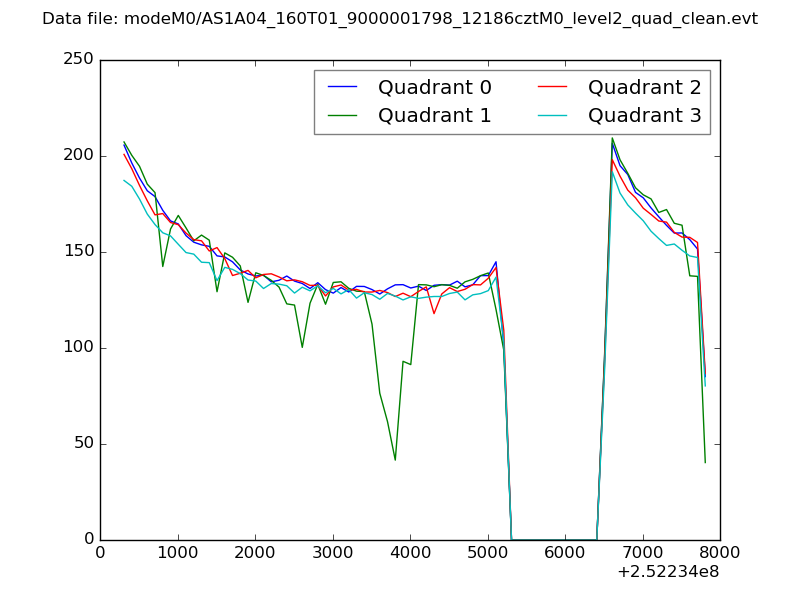 |
|
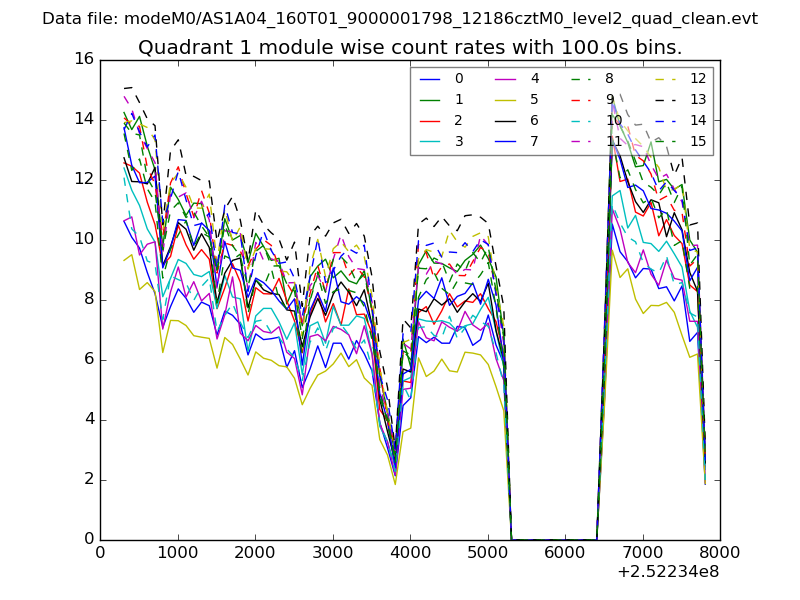
| Module-wise count rates for Quadrant A Data is divided into 100 sec bins |
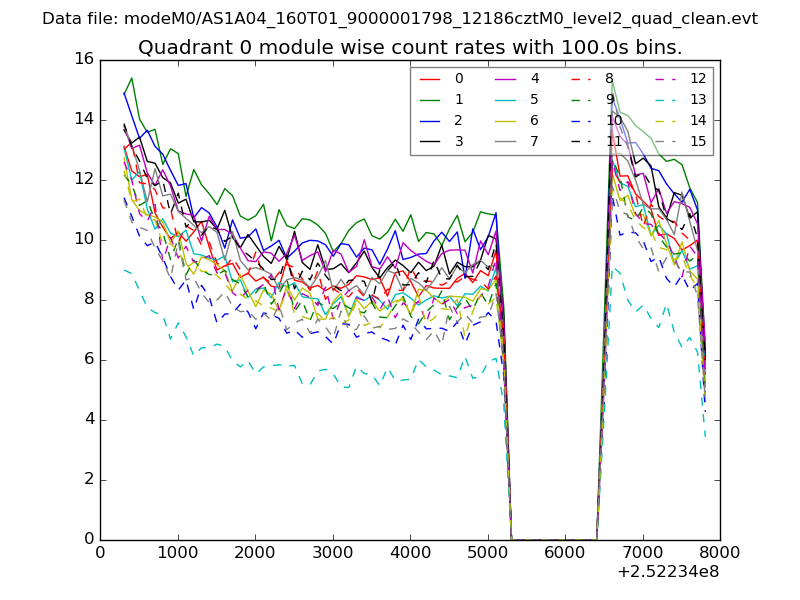 |
 |
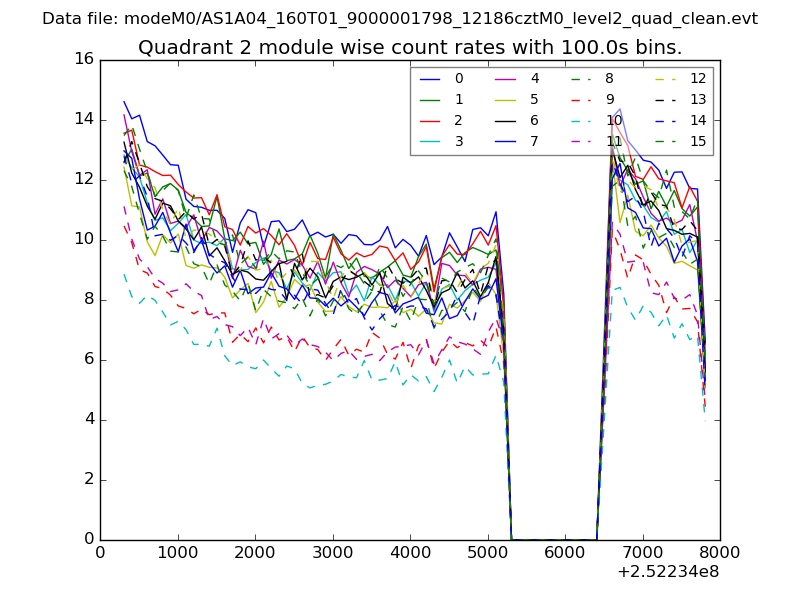
| Module-wise count rates for Quadrant B Data is divided into 100 sec bins |
 |
 |
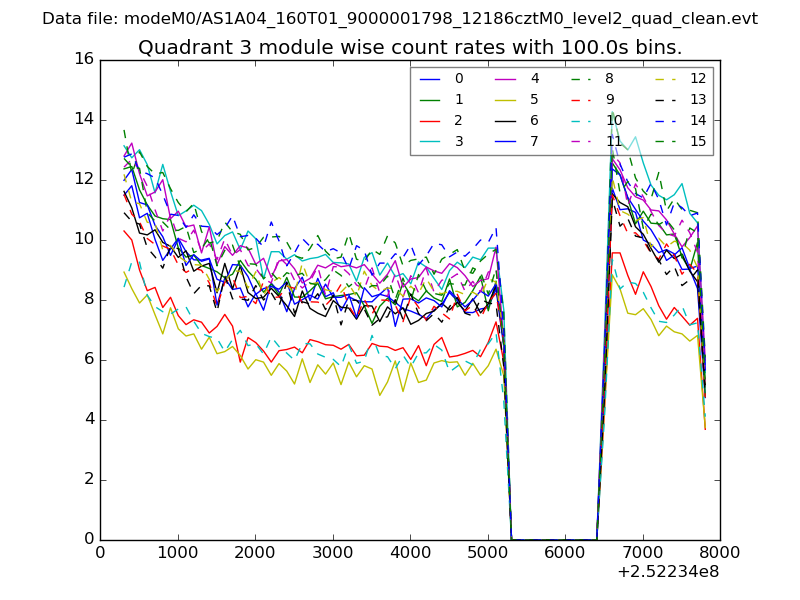
| Module-wise count rates for Quadrant C Data is divided into 100 sec bins |
 |
 |
| Module-wise count rates for Quadrant D Data is divided into 100 sec bins |
 |
 |
| Parameter | Plot |
|---|---|
| CZT HV Monitor | 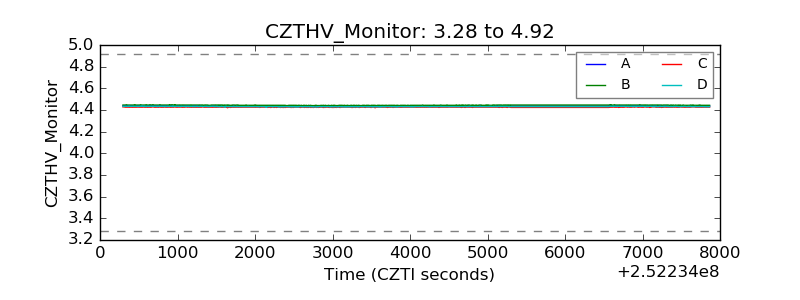 |
| D_VDD | 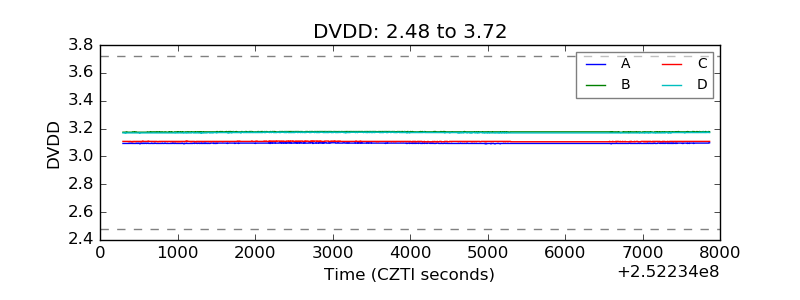 |
| Temperature 1 | 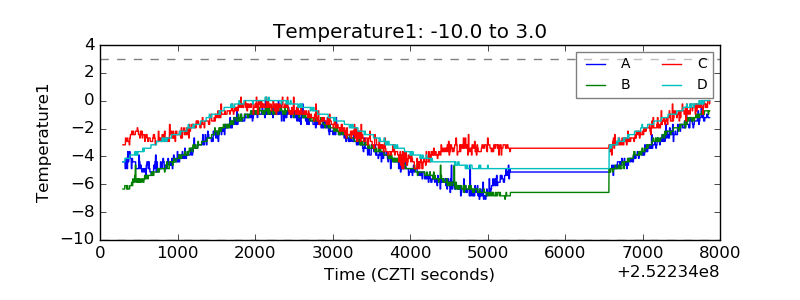 |
| Veto HV Monitor | 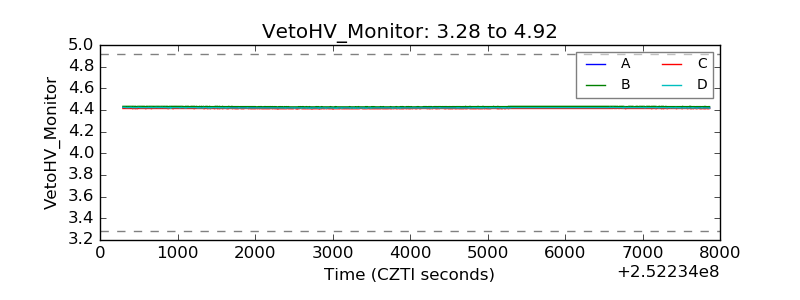 |
| Veto LLD | 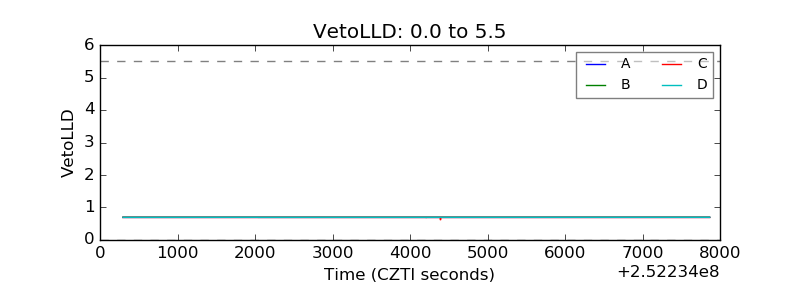 |
| Alpha Counter | 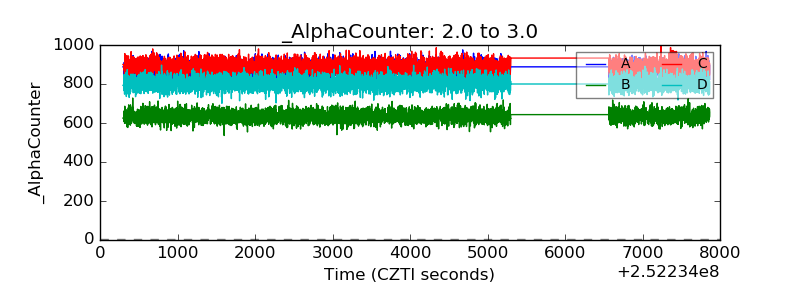 |
| _CPM_Rate | 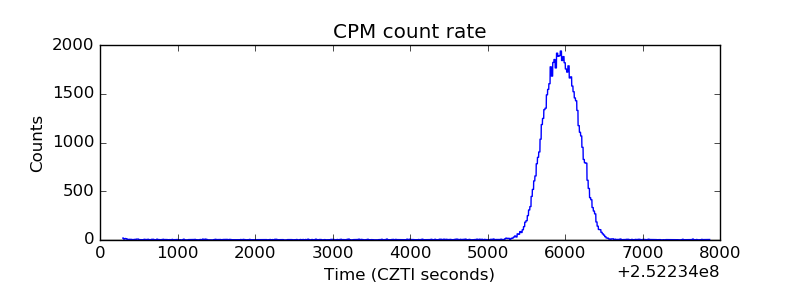 |
| CZT Counter | 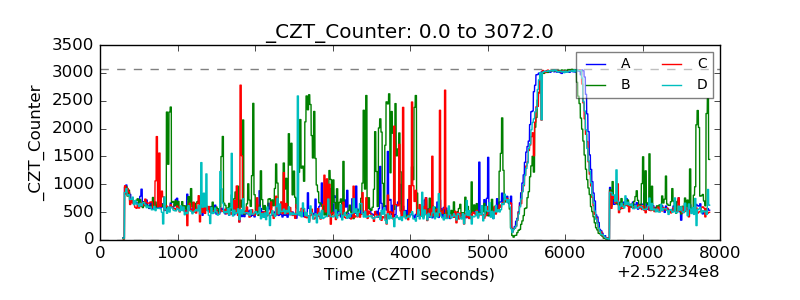 |
| +2.5 Volts monitor |  |
| +5 Volts monitor |  |
| _ROLL_ROT | 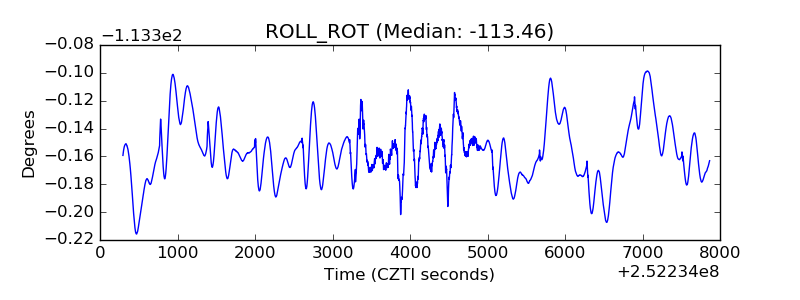 |
| _Roll_DEC | 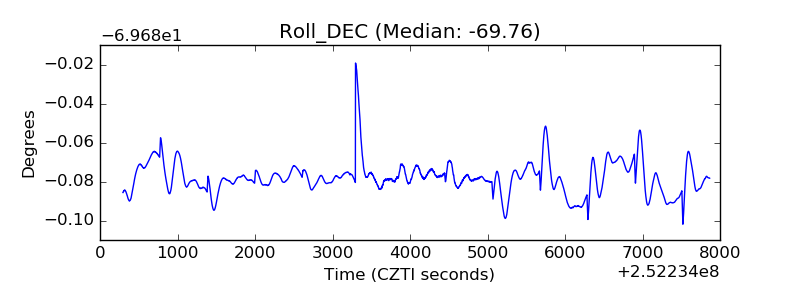 |
| _Roll_RA | 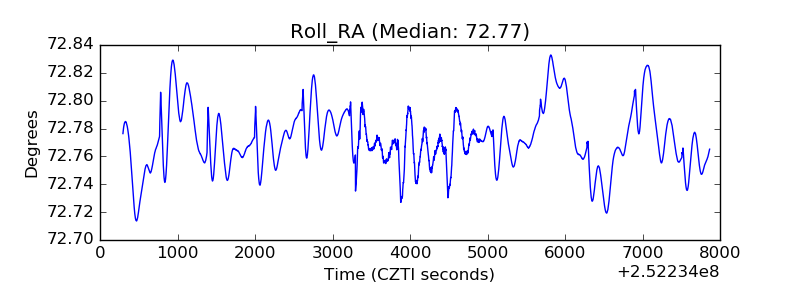 |
| Veto Counter | 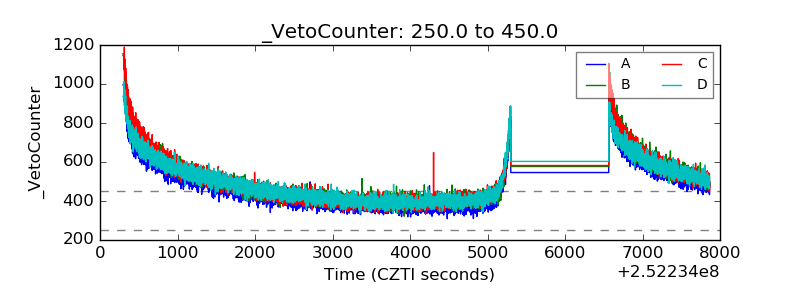 |