| Param | Original file | Final file |
|---|---|---|
| Filename | modeM0/AS1A04_160T01_9000001798_12187cztM0_level2.evt | modeM0/AS1A04_160T01_9000001798_12187cztM0_level2_quad_clean.evt |
| Size (bytes) | 529,056,000 | 127,742,400 |
| Size | 504.5 MB | 121.8 MB |
| Events in quadrant A | 3,426,058 | 898,654 |
| Events in quadrant B | 5,729,137 | 806,932 |
| Events in quadrant C | 3,123,401 | 885,324 |
| Events in quadrant D | 3,328,935 | 850,700 |
| Mode SS | |||
|---|---|---|---|
| Quadrant | BADHDUFLAG | Total packets | Discarded packets |
| A | 0 | 122 | 0 |
| B | 0 | 122 | 0 |
| C | 0 | 122 | 0 |
| D | 0 | 122 | 0 |
| Mode M9 | |||
|---|---|---|---|
| Quadrant | BADHDUFLAG | Total packets | Discarded packets |
| A | 0 | 14 | 0 |
| B | 0 | 14 | 0 |
| C | 0 | 14 | 0 |
| D | 0 | 14 | 0 |
| Mode M0 | |||
|---|---|---|---|
| Quadrant | BADHDUFLAG | Total packets | Discarded packets |
| A | 0 | 13973 | 2 |
| B | 0 | 21319 | 1 |
| C | 0 | 13254 | 1 |
| D | 0 | 13870 | 1 |
| Quadrant | Total seconds | Saturated seconds | Saturation percentage |
|---|---|---|---|
| A | 6122 | 129 | 2.107155% |
| B | 6122 | 1120 | 18.294675% |
| C | 6122 | 115 | 1.878471% |
| D | 6122 | 121 | 1.976478% |
Noise dominated data is calculated using 1-second bins in cleaned event files. If a bin has >2000 counts, and if more than 50% of those come from <1% of pixels, then it is considered to be noise-dominated and hence unusable.
| Quadrant | # 1 sec bins | Bins with >0 counts | Bins with >2000 counts | High rate bins dominated by noise | Noise dominated (total time) | Noise dominated (detector-on time) | Marked lightcurve |
|---|---|---|---|---|---|---|---|
| A | 7438 | 6124 | 6 | 6 | 0.08% | 0.10% |  |
| B | 7438 | 6124 | 620 | 620 | 8.34% | 10.12% |  |
| C | 7438 | 6124 | 20 | 20 | 0.27% | 0.33% | 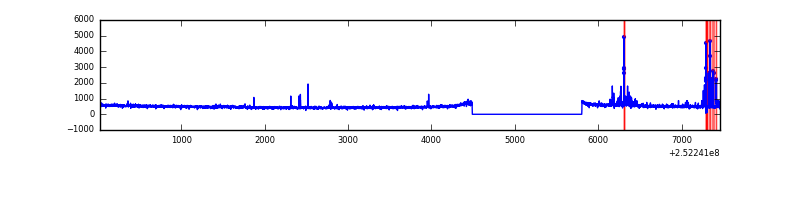 |
| D | 7438 | 6124 | 40 | 40 | 0.54% | 0.65% | 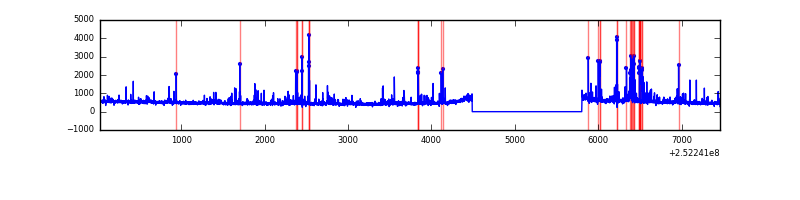 |
Top three noisy pixels from each quadrant. If the there are fewer than three noisy pixels in the level2.evt file, extra rows are filled as -1
| Pixel properties | Quadrant properties | ||||||
|---|---|---|---|---|---|---|---|
| Quadrant | DetID | PixID | Counts | Sigma | Mean | Median | Sigma |
| A | 1 | 162 | 86984 | 544.95 | 789 | 776 | 158.2 |
| A | 9 | 143 | 58725 | 366.31 | 789 | 776 | 158.2 |
| A | 13 | 248 | 41636 | 258.29 | 789 | 776 | 158.2 |
| B | 4 | 239 | 2429514 | 18817.39 | 706 | 692 | 129.1 |
| B | 10 | 16 | 172342 | 1329.86 | 706 | 692 | 129.1 |
| B | 11 | 51 | 168946 | 1303.55 | 706 | 692 | 129.1 |
| C | 15 | 208 | 154616 | 916.57 | 751 | 756 | 167.9 |
| C | 4 | 175 | 17032 | 96.96 | 751 | 756 | 167.9 |
| C | 0 | 207 | 15446 | 87.51 | 751 | 756 | 167.9 |
| D | 1 | 52 | 217791 | 1224.0 | 758 | 738 | 177.3 |
| D | 10 | 199 | 63360 | 353.14 | 758 | 738 | 177.3 |
| D | 10 | 50 | 36542 | 201.91 | 758 | 738 | 177.3 |
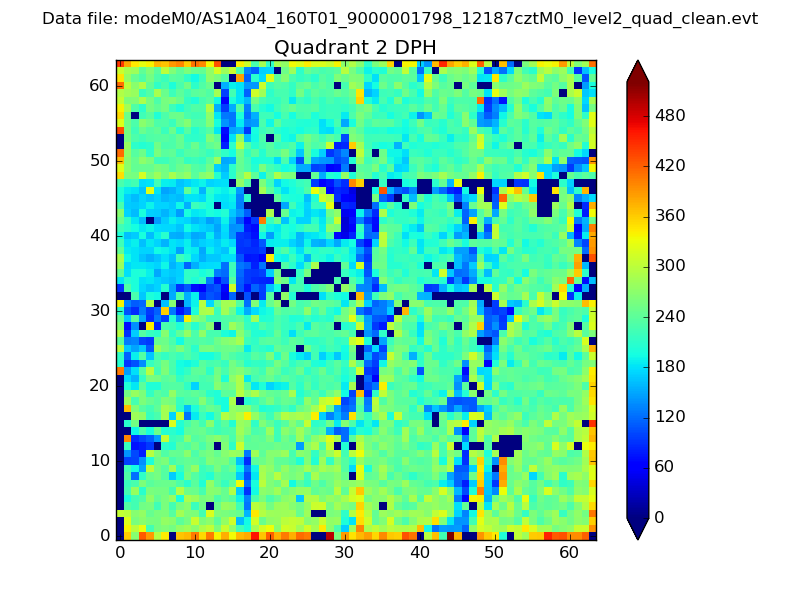
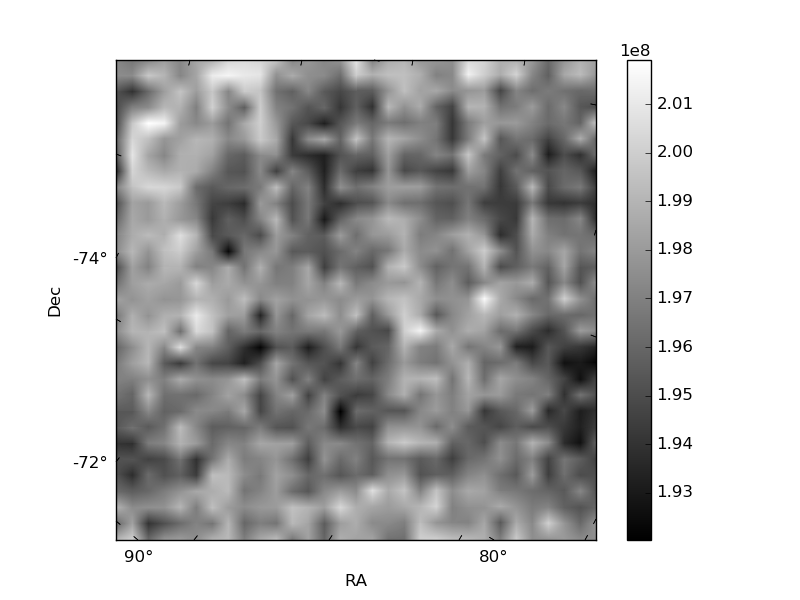
Histogram calculated using DETX and DETY for each event in the final _common_clean file
| Quadrant A | 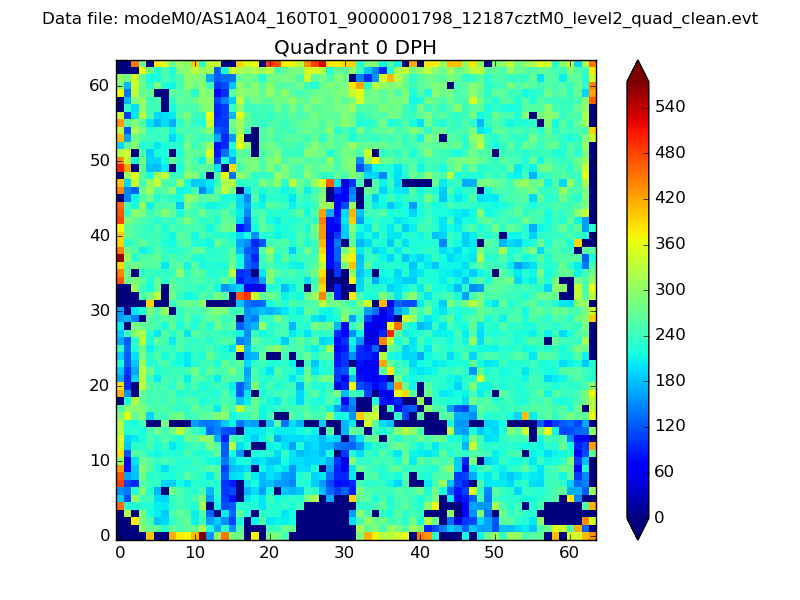 |
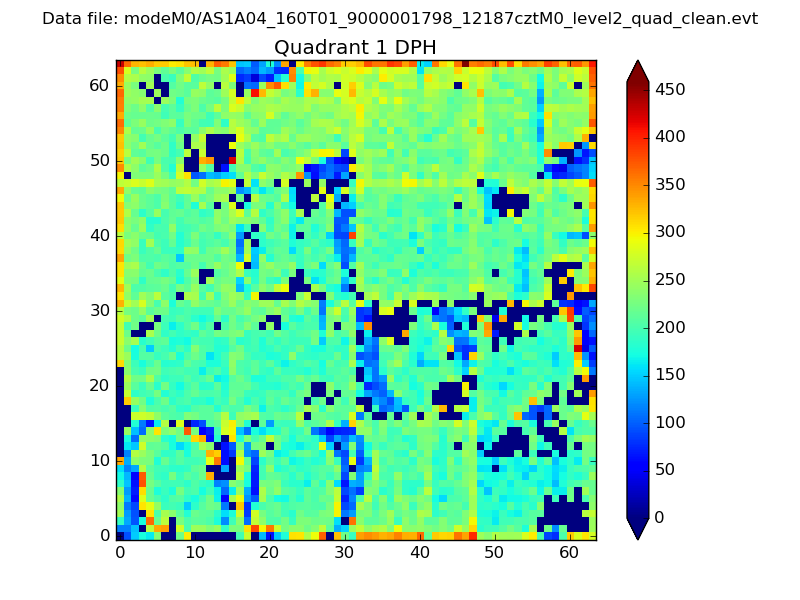 |
Quadrant B |
|---|---|---|---|
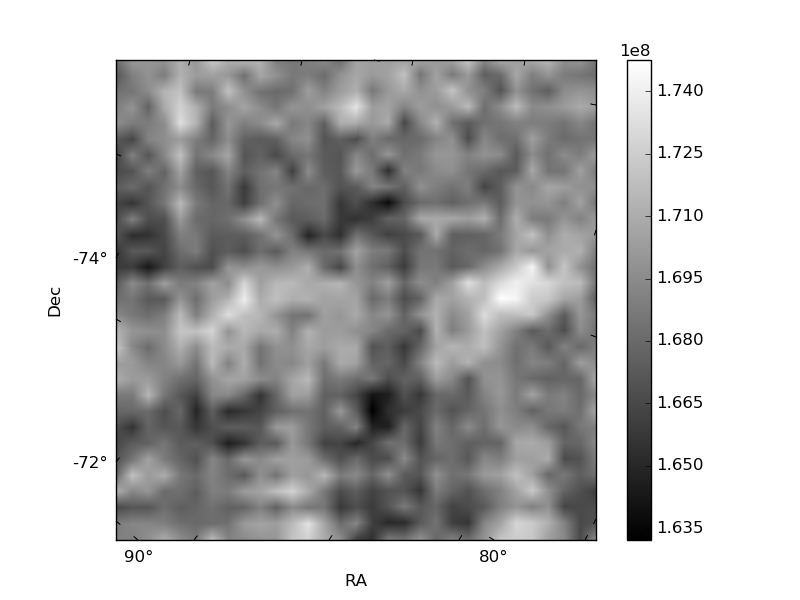
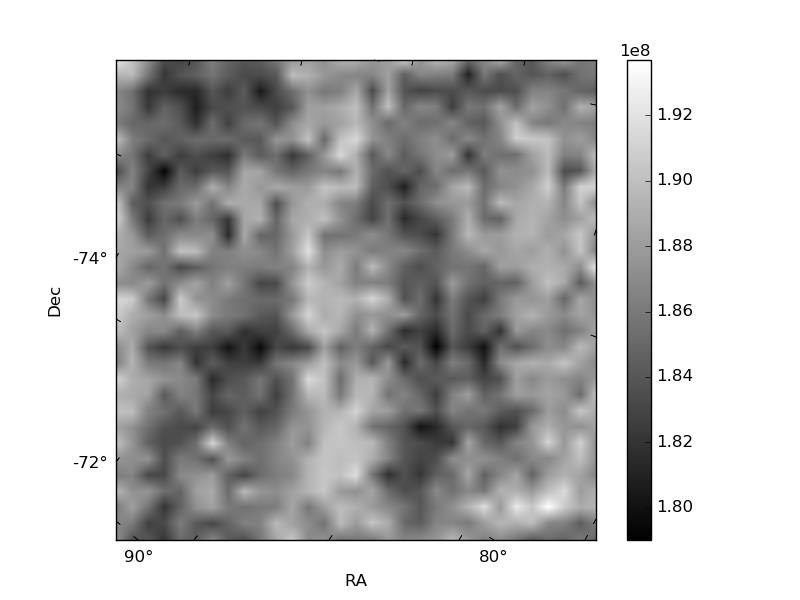
| Quadrant D | 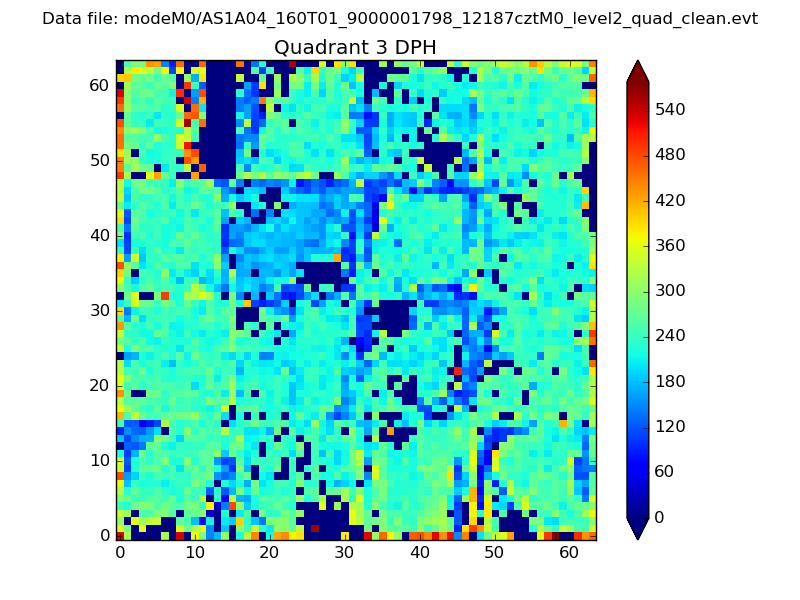 |
 |
Quadrant C |
| Plot type | Count rate plots | Images |
|---|---|---|
| Comparison with Poisson distribution Blue bars denote a histogram of data divided into 1 sec bins. Red curve is a Poisson curve with rate = median count rate of data. |
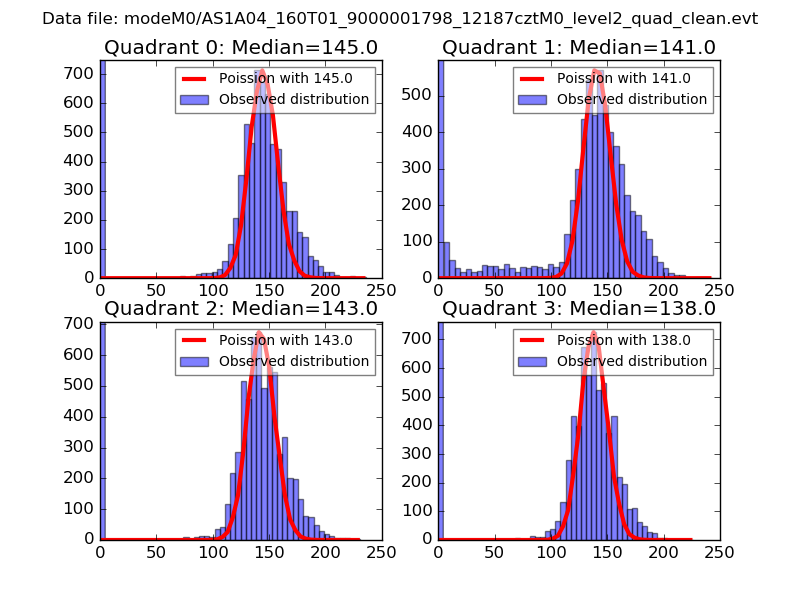 |
 |
| Quadrant-wise count rates Data is divided into 100 sec bins |
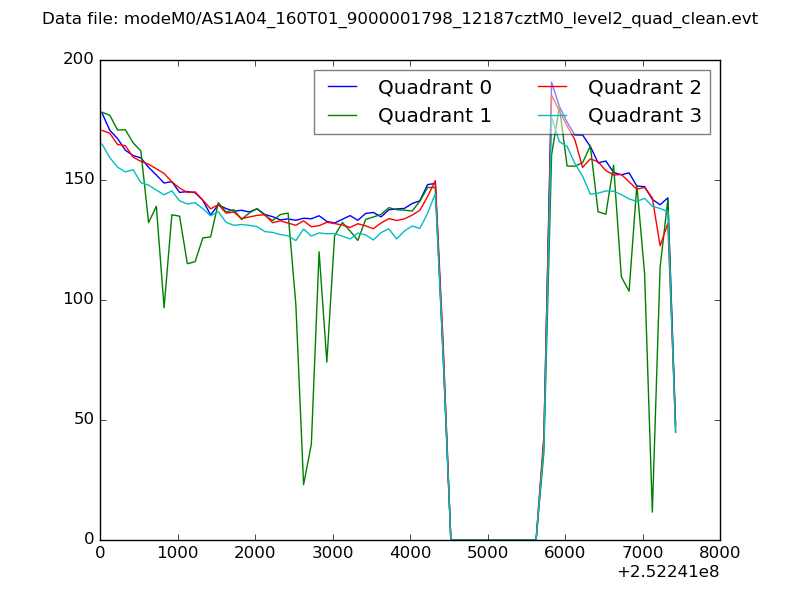 |
|
| Module-wise count rates for Quadrant A Data is divided into 100 sec bins |
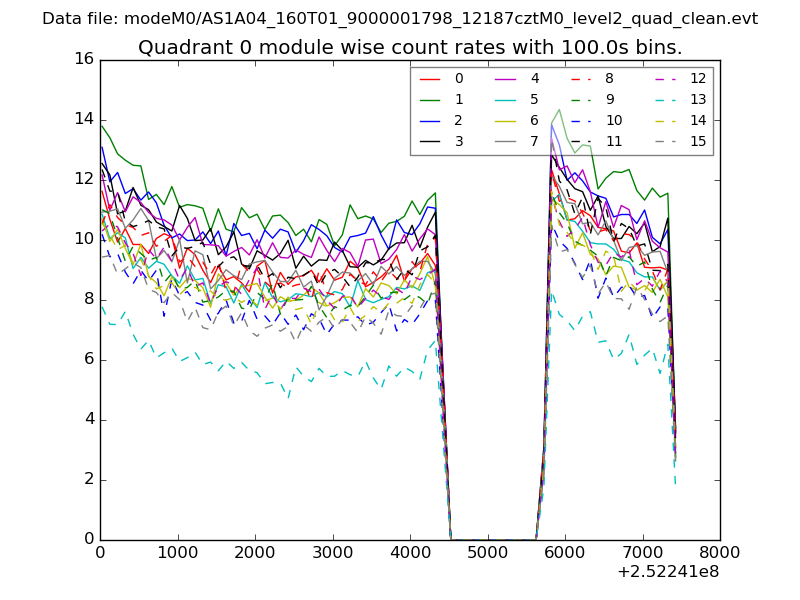 |
 |
| Module-wise count rates for Quadrant B Data is divided into 100 sec bins |
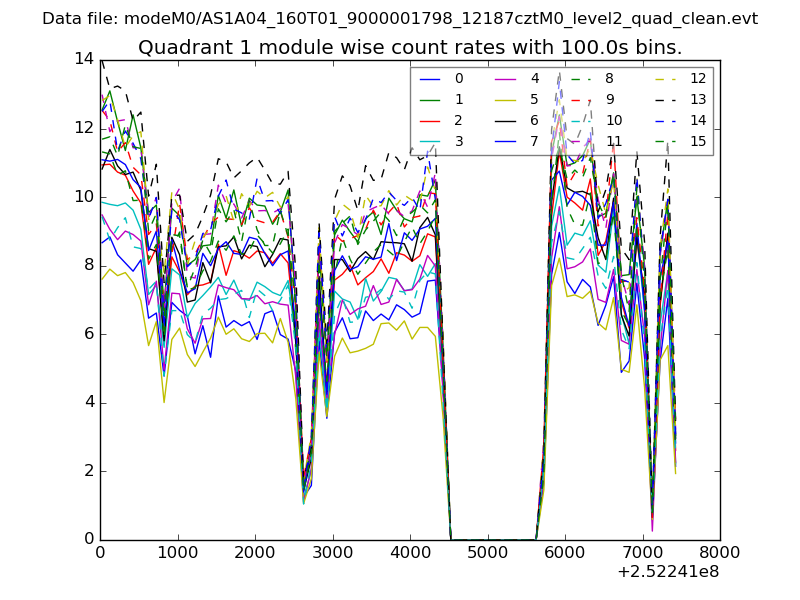 |
 |
| Module-wise count rates for Quadrant C Data is divided into 100 sec bins |
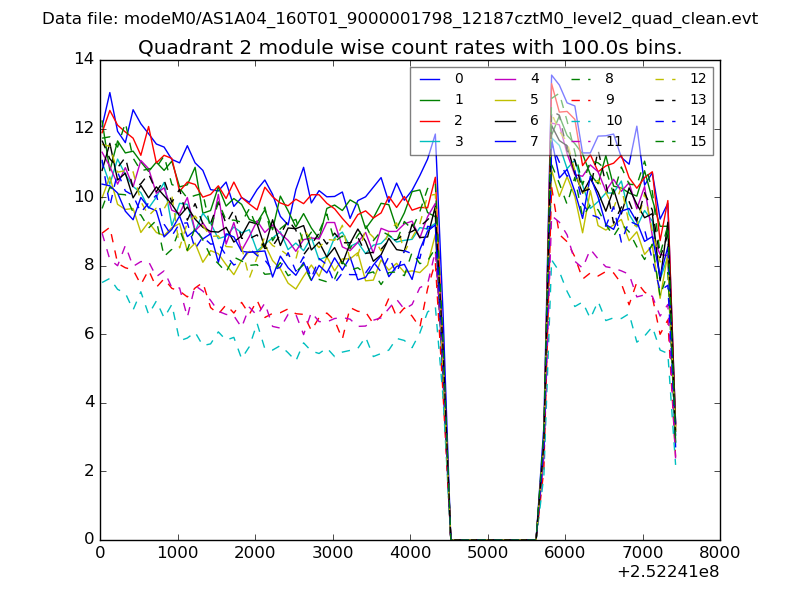 |
 |
| Module-wise count rates for Quadrant D Data is divided into 100 sec bins |
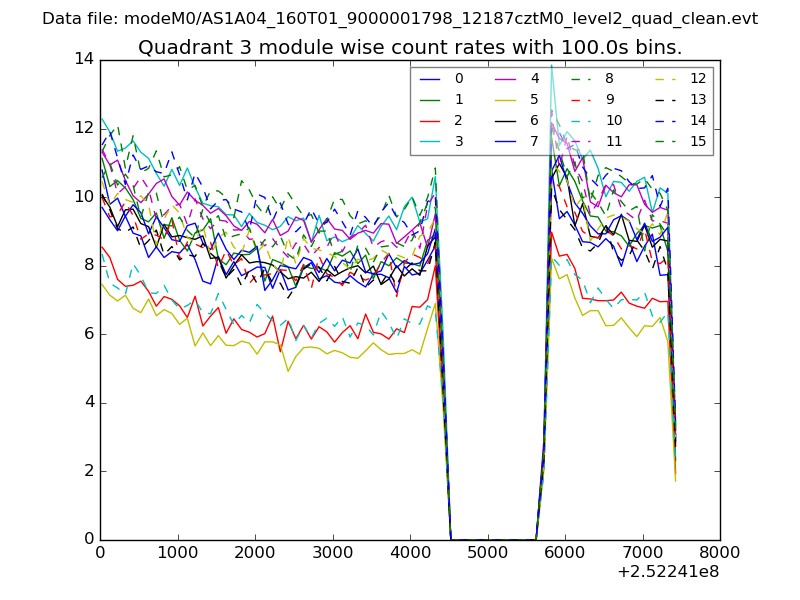 |
 |
| Parameter | Plot |
|---|---|
| CZT HV Monitor | 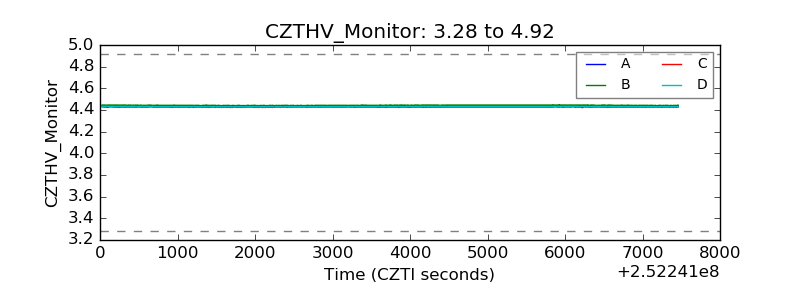 |
| D_VDD |  |
| Temperature 1 | 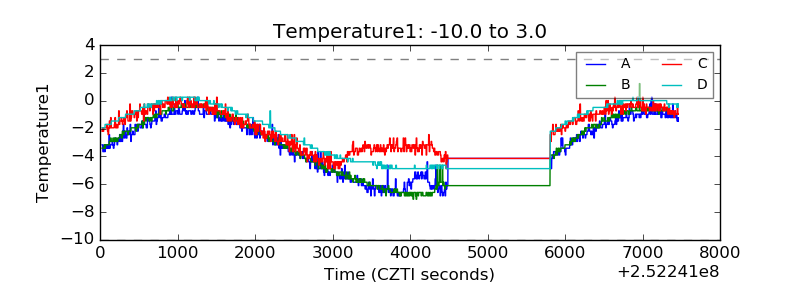 |
| Veto HV Monitor | 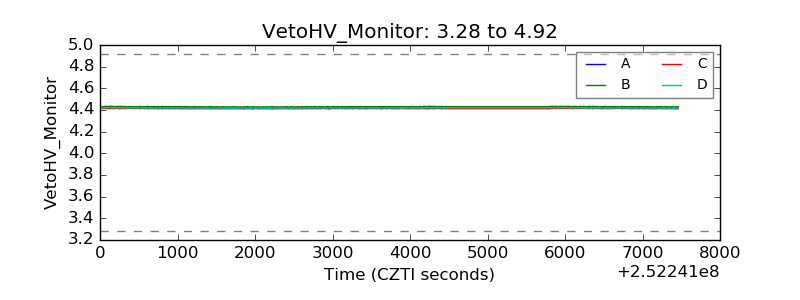 |
| Veto LLD | 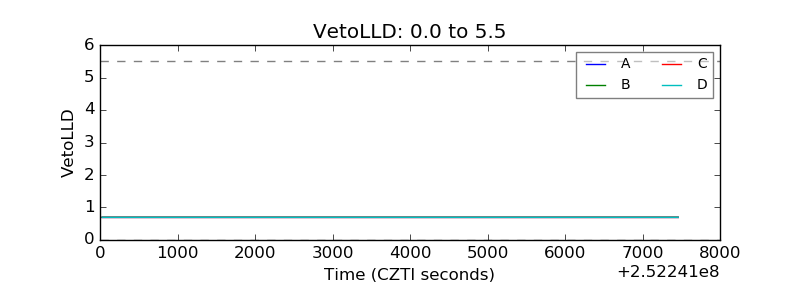 |
| Alpha Counter | 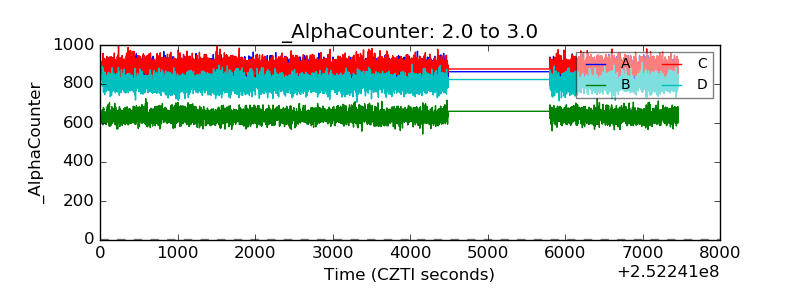 |
| _CPM_Rate | 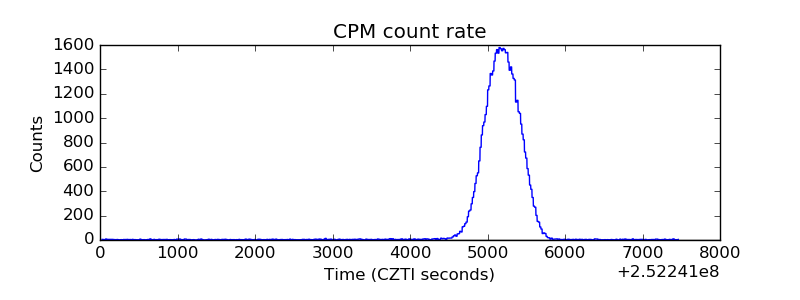 |
| CZT Counter | 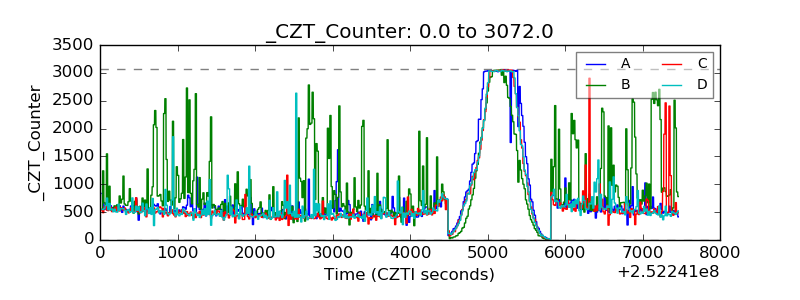 |
| +2.5 Volts monitor | 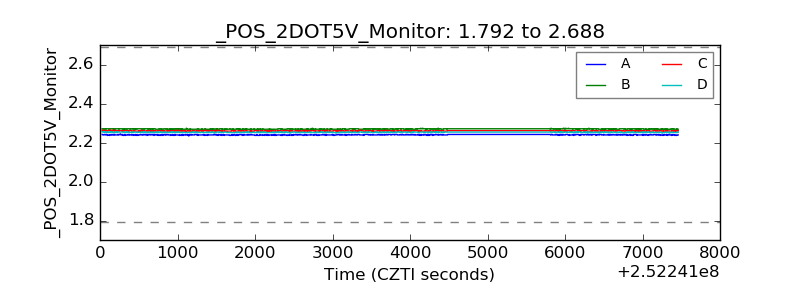 |
| +5 Volts monitor |  |
| _ROLL_ROT | 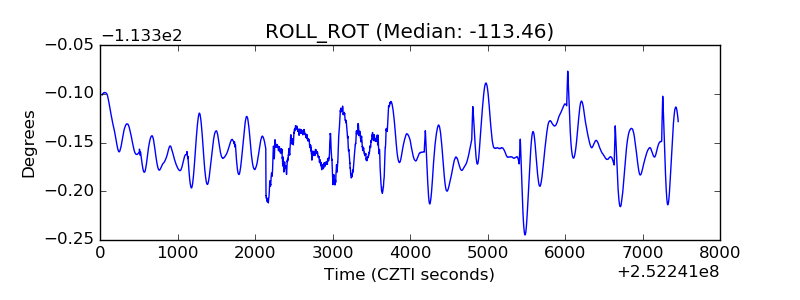 |
| _Roll_DEC | 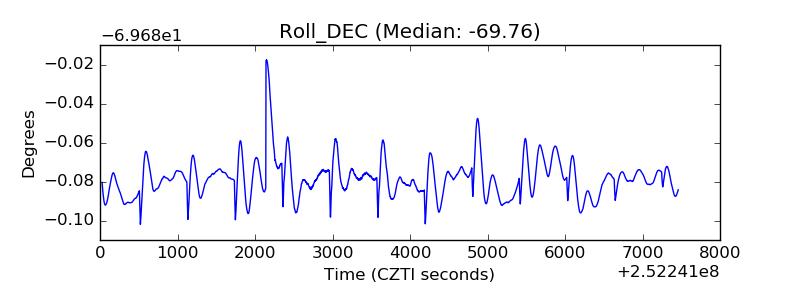 |
| _Roll_RA | 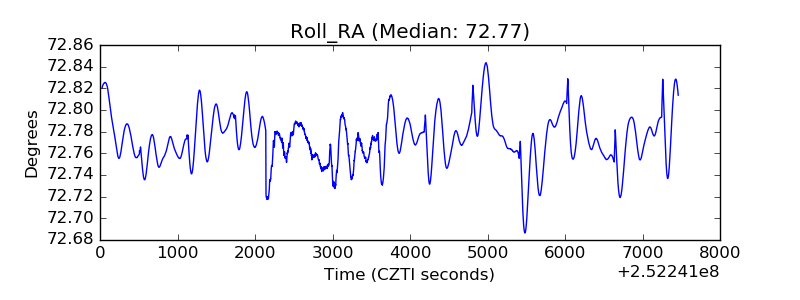 |
| Veto Counter | 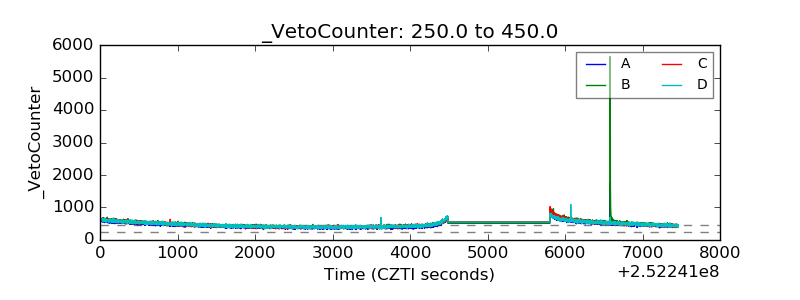 |