| Param | Original file | Final file |
|---|---|---|
| Filename | modeM0/AS1A04_160T01_9000001798_12188cztM0_level2.evt | modeM0/AS1A04_160T01_9000001798_12188cztM0_level2_quad_clean.evt |
| Size (bytes) | 526,921,920 | 124,096,320 |
| Size | 502.5 MB | 118.3 MB |
| Events in quadrant A | 3,218,200 | 871,598 |
| Events in quadrant B | 5,538,307 | 795,055 |
| Events in quadrant C | 3,213,171 | 849,221 |
| Events in quadrant D | 3,569,458 | 811,471 |
| Mode SS | |||
|---|---|---|---|
| Quadrant | BADHDUFLAG | Total packets | Discarded packets |
| A | 0 | 126 | 0 |
| B | 0 | 126 | 0 |
| C | 0 | 126 | 0 |
| D | 0 | 126 | 0 |
| Mode M9 | |||
|---|---|---|---|
| Quadrant | BADHDUFLAG | Total packets | Discarded packets |
| A | 0 | 12 | 0 |
| B | 0 | 12 | 0 |
| C | 0 | 12 | 0 |
| D | 0 | 12 | 0 |
| Mode M0 | |||
|---|---|---|---|
| Quadrant | BADHDUFLAG | Total packets | Discarded packets |
| A | 0 | 13570 | 3 |
| B | 0 | 20682 | 2 |
| C | 0 | 13676 | 2 |
| D | 0 | 14802 | 2 |
| Quadrant | Total seconds | Saturated seconds | Saturation percentage |
|---|---|---|---|
| A | 6168 | 87 | 1.410506% |
| B | 6168 | 959 | 15.547990% |
| C | 6168 | 120 | 1.945525% |
| D | 6168 | 172 | 2.788586% |
Noise dominated data is calculated using 1-second bins in cleaned event files. If a bin has >2000 counts, and if more than 50% of those come from <1% of pixels, then it is considered to be noise-dominated and hence unusable.
| Quadrant | # 1 sec bins | Bins with >0 counts | Bins with >2000 counts | High rate bins dominated by noise | Noise dominated (total time) | Noise dominated (detector-on time) | Marked lightcurve |
|---|---|---|---|---|---|---|---|
| A | 7459 | 6171 | 1 | 1 | 0.01% | 0.02% | 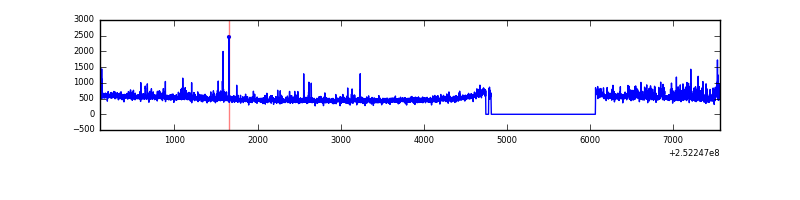 |
| B | 7459 | 6171 | 572 | 572 | 7.67% | 9.27% | 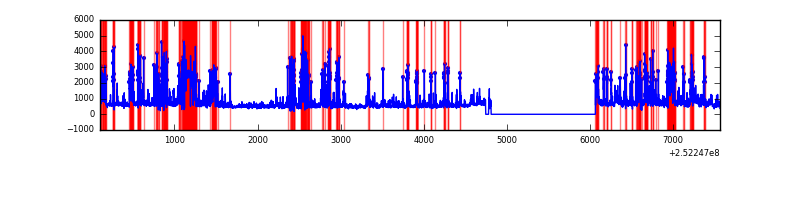 |
| C | 7459 | 6171 | 58 | 58 | 0.78% | 0.94% | 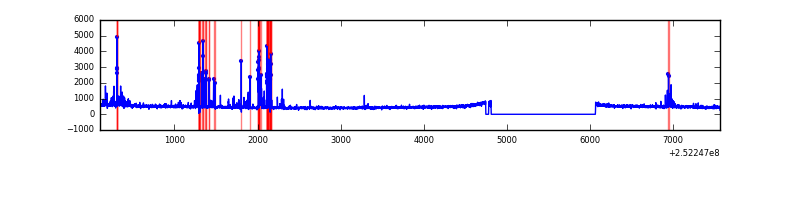 |
| D | 7459 | 6171 | 99 | 99 | 1.33% | 1.60% | 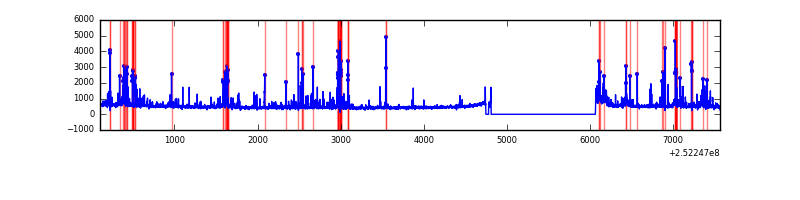 |
Top three noisy pixels from each quadrant. If the there are fewer than three noisy pixels in the level2.evt file, extra rows are filled as -1
| Pixel properties | Quadrant properties | ||||||
|---|---|---|---|---|---|---|---|
| Quadrant | DetID | PixID | Counts | Sigma | Mean | Median | Sigma |
| A | 1 | 162 | 68854 | 439.33 | 772 | 759 | 155.0 |
| A | 1 | 178 | 33909 | 213.88 | 772 | 759 | 155.0 |
| A | 1 | 161 | 29837 | 187.6 | 772 | 759 | 155.0 |
| B | 4 | 239 | 2157898 | 16592.67 | 702 | 687 | 130.0 |
| B | 11 | 51 | 201057 | 1541.19 | 702 | 687 | 130.0 |
| B | 10 | 16 | 175245 | 1342.65 | 702 | 687 | 130.0 |
| C | 15 | 208 | 321046 | 1945.83 | 728 | 731 | 164.6 |
| C | 0 | 207 | 37241 | 221.79 | 728 | 731 | 164.6 |
| C | 4 | 175 | 9354 | 52.38 | 728 | 731 | 164.6 |
| D | 1 | 52 | 263397 | 1512.08 | 732 | 710 | 173.7 |
| D | 10 | 157 | 115651 | 661.62 | 732 | 710 | 173.7 |
| D | 10 | 253 | 72920 | 415.66 | 732 | 710 | 173.7 |
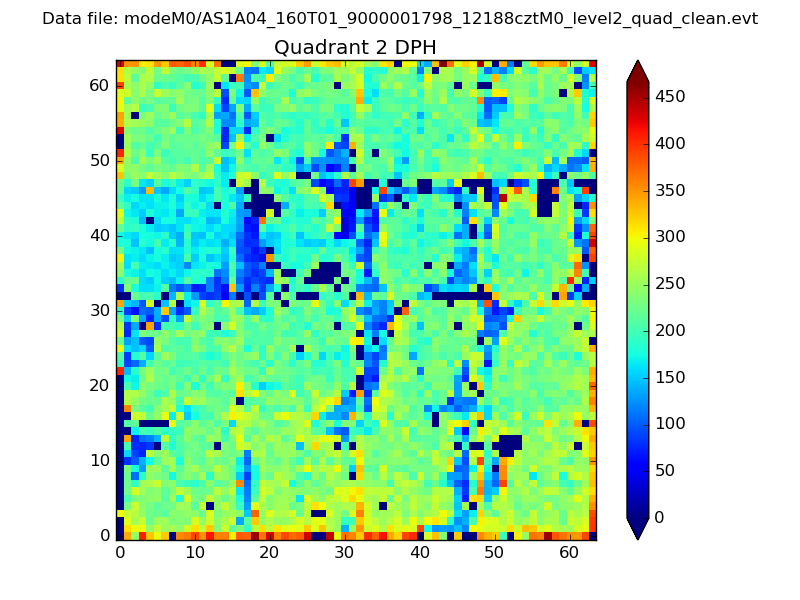
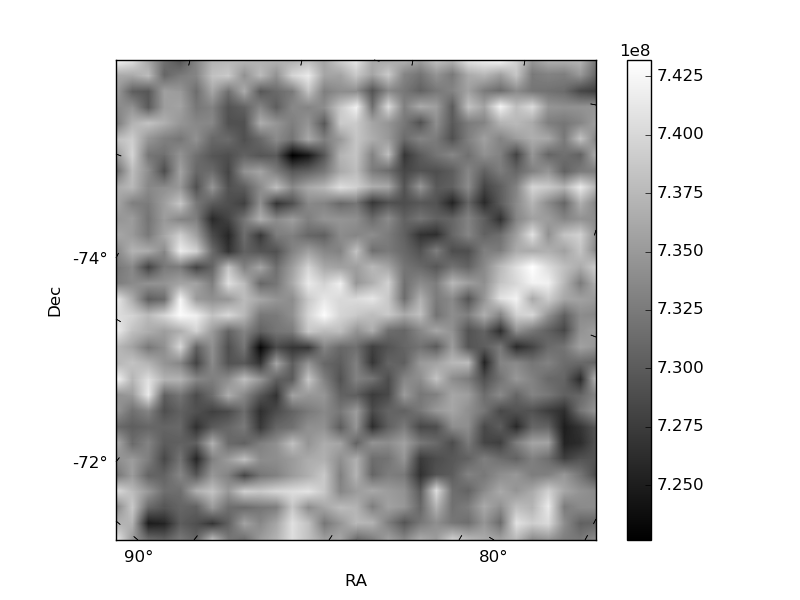
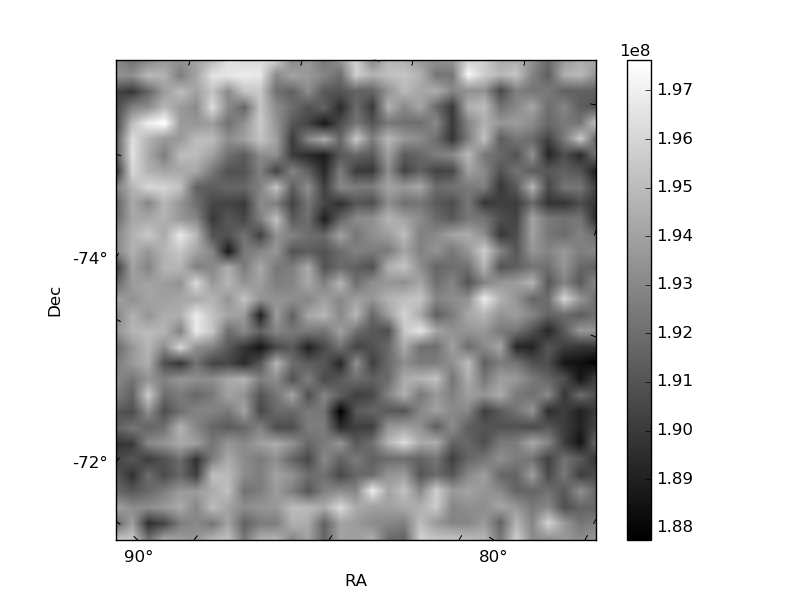
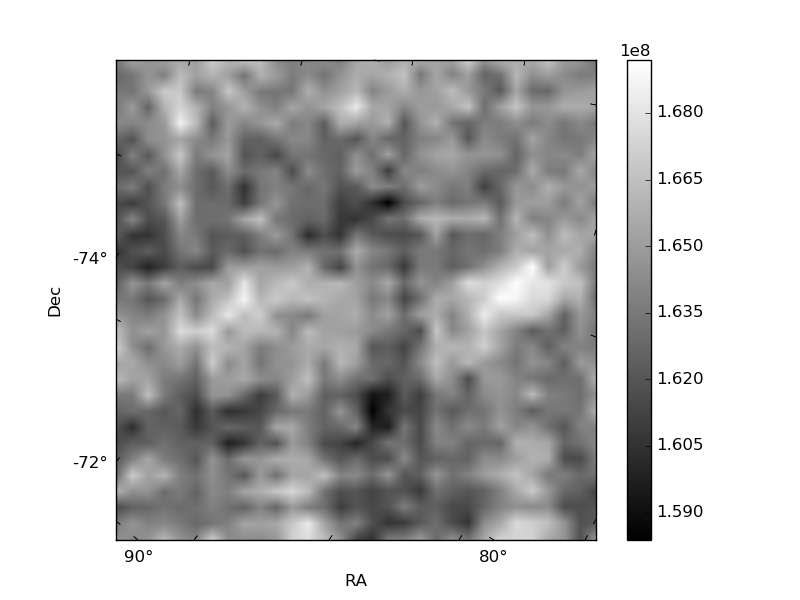
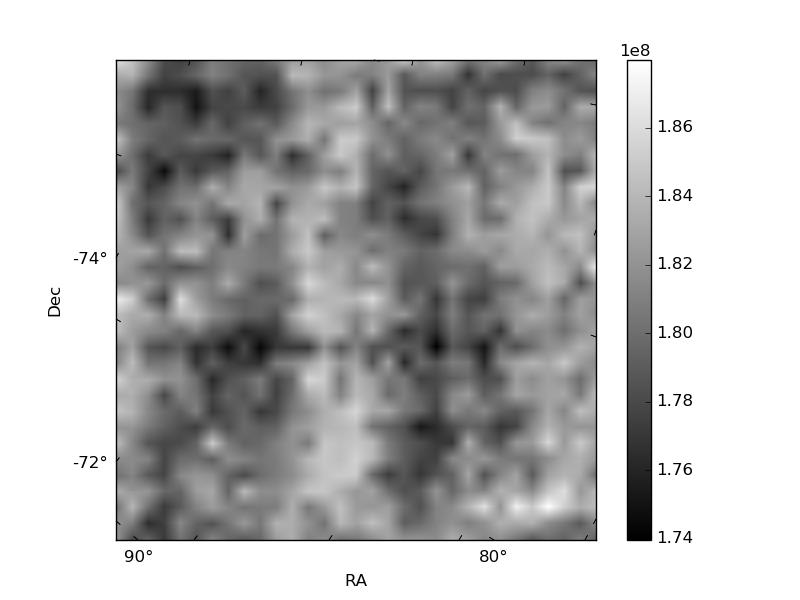
Histogram calculated using DETX and DETY for each event in the final _common_clean file
| Quadrant A | 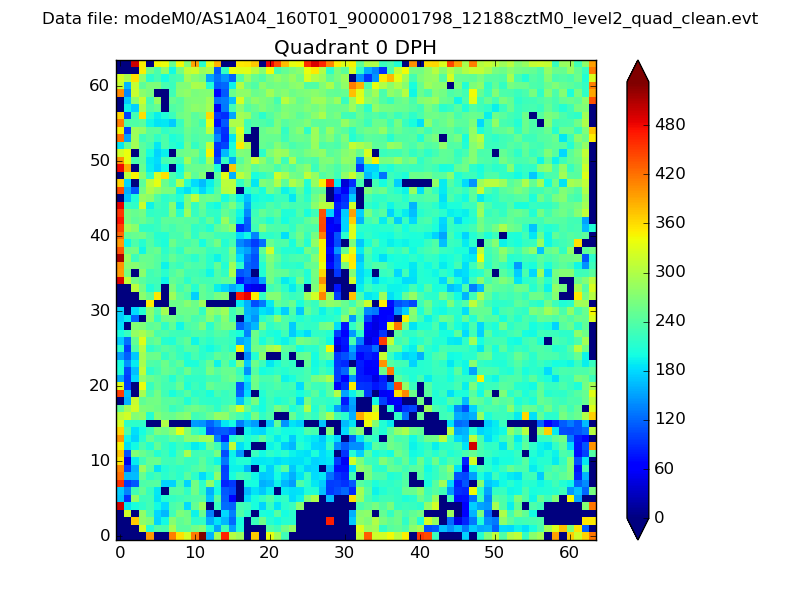 |
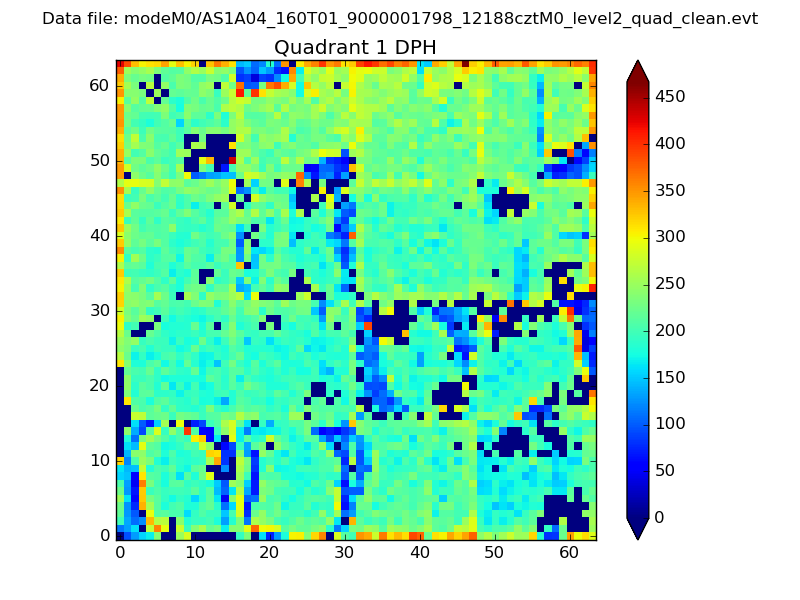 |
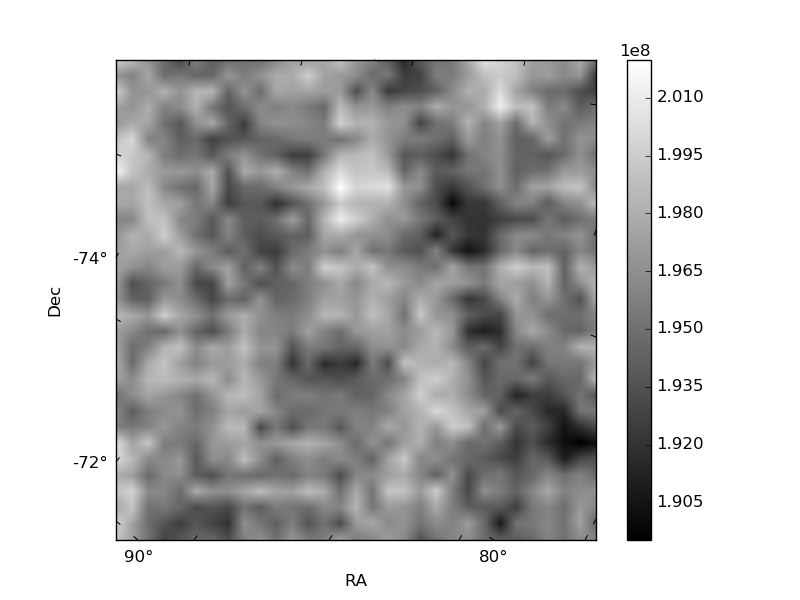
Quadrant B |
|---|---|---|---|
| Quadrant D | 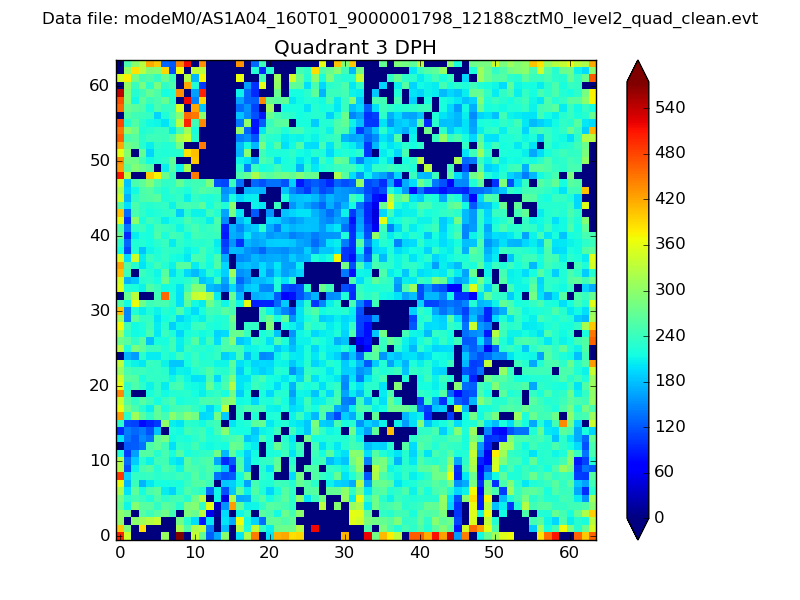 |
 |
Quadrant C |
| Plot type | Count rate plots | Images |
|---|---|---|
| Comparison with Poisson distribution Blue bars denote a histogram of data divided into 1 sec bins. Red curve is a Poisson curve with rate = median count rate of data. |
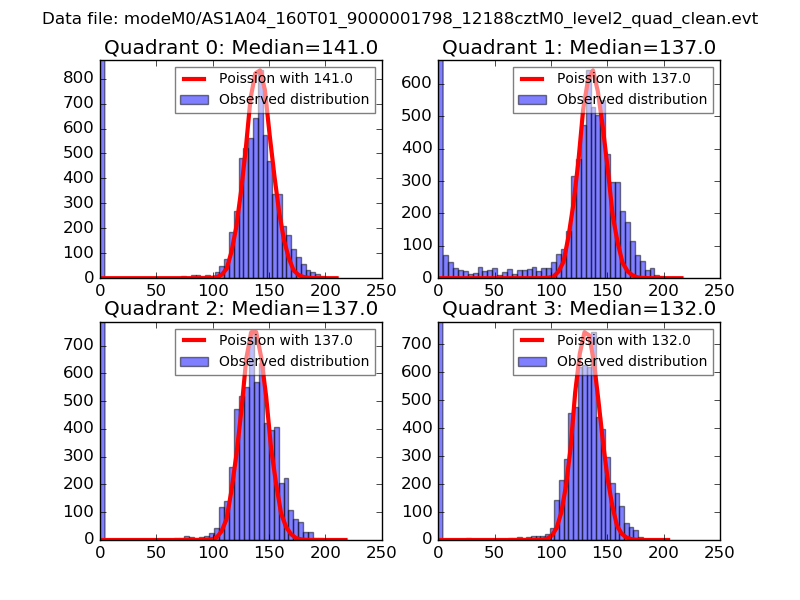 |
 |
| Quadrant-wise count rates Data is divided into 100 sec bins |
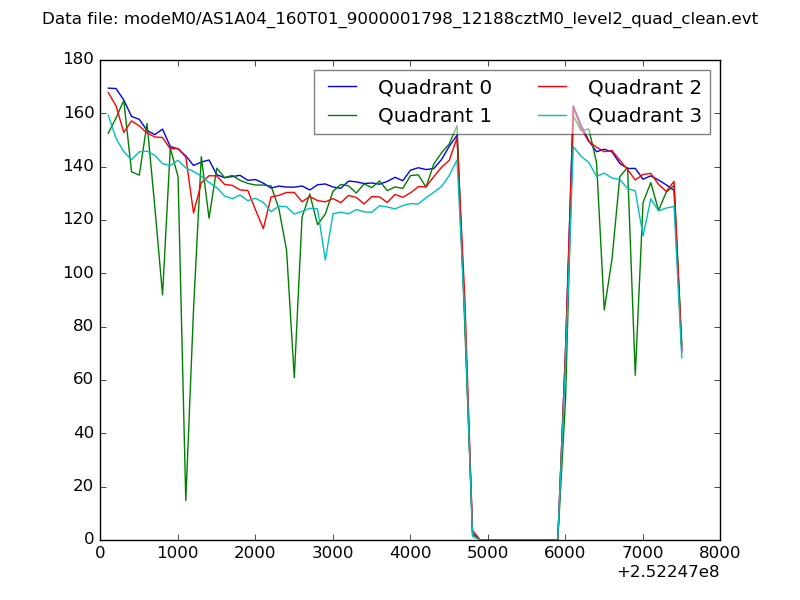 |
|
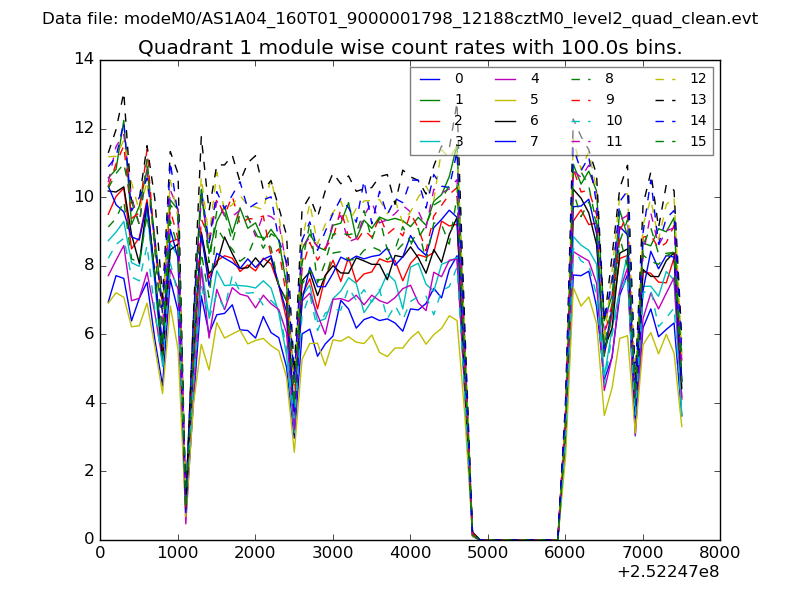
| Module-wise count rates for Quadrant A Data is divided into 100 sec bins |
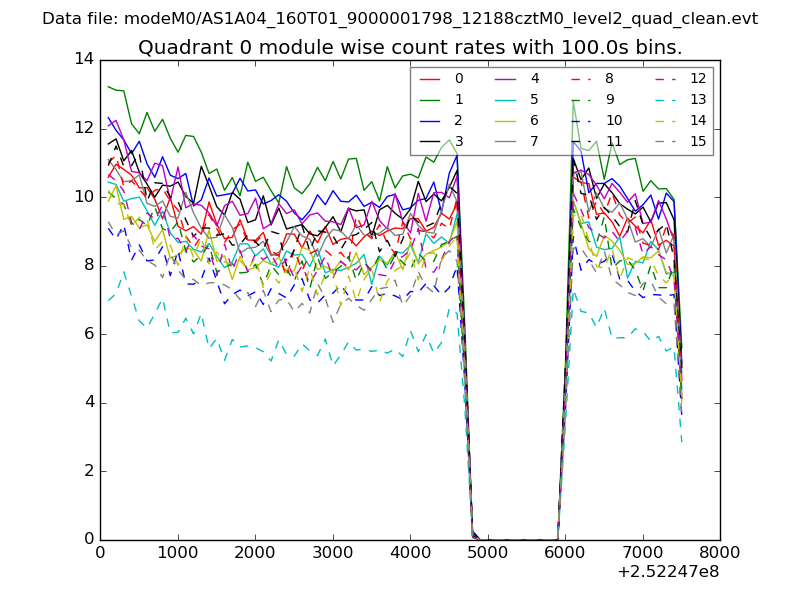 |
 |
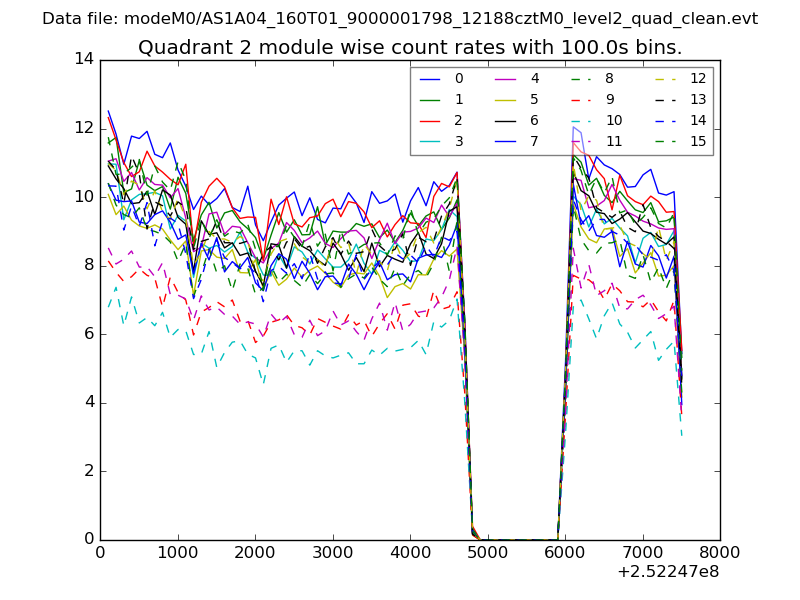
| Module-wise count rates for Quadrant B Data is divided into 100 sec bins |
 |
 |
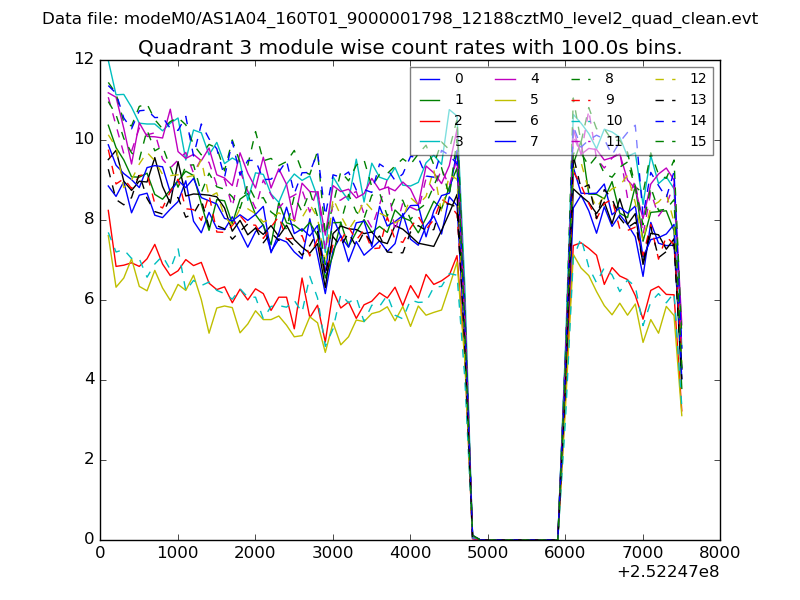
| Module-wise count rates for Quadrant C Data is divided into 100 sec bins |
 |
 |
| Module-wise count rates for Quadrant D Data is divided into 100 sec bins |
 |
 |
| Parameter | Plot |
|---|---|
| CZT HV Monitor | 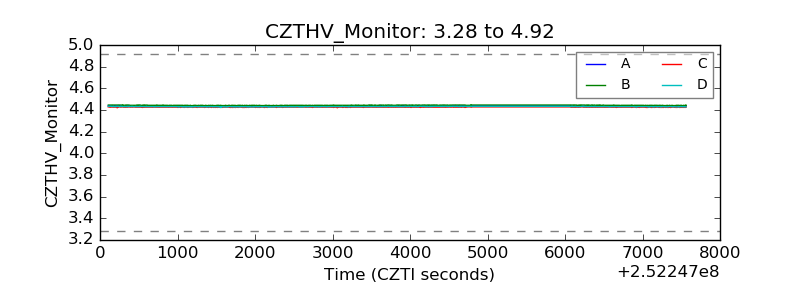 |
| D_VDD | 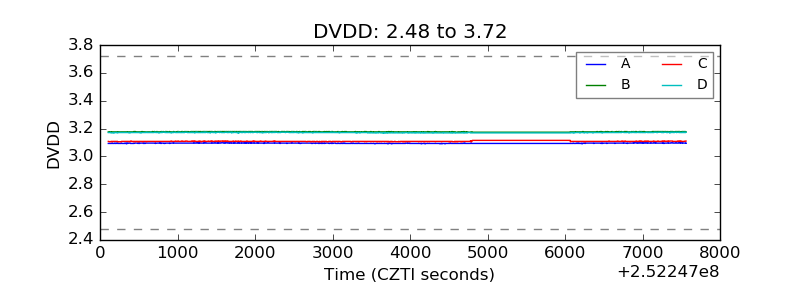 |
| Temperature 1 | 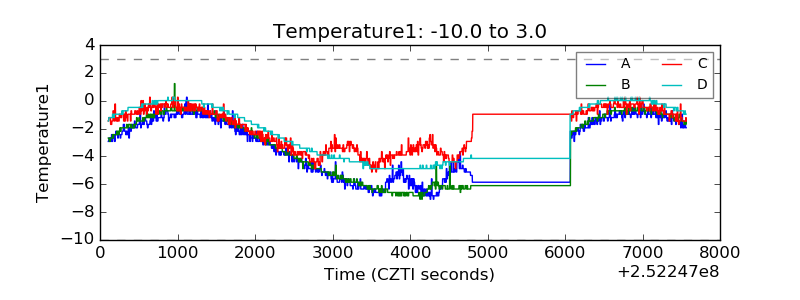 |
| Veto HV Monitor | 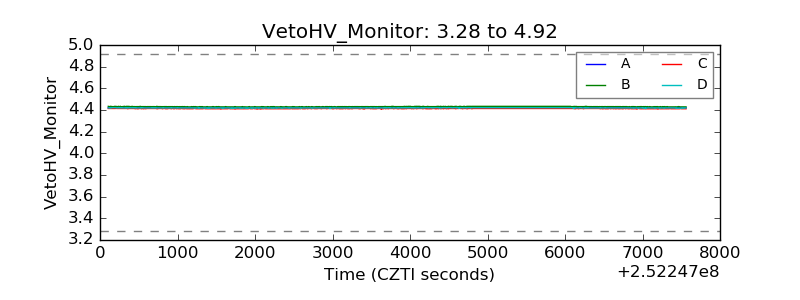 |
| Veto LLD | 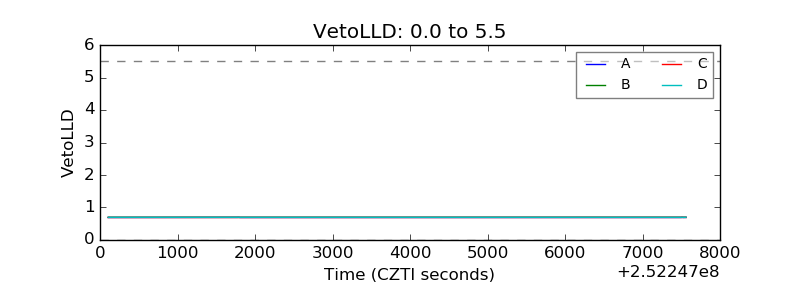 |
| Alpha Counter | 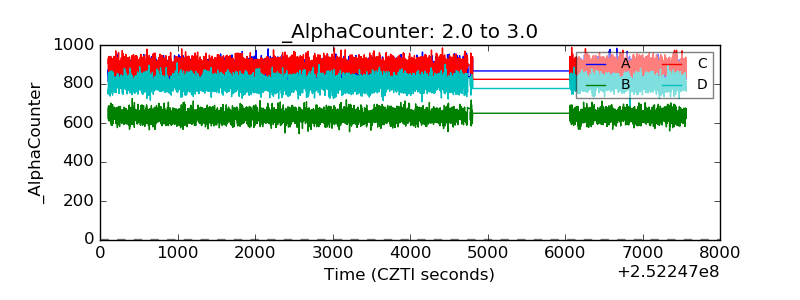 |
| _CPM_Rate | 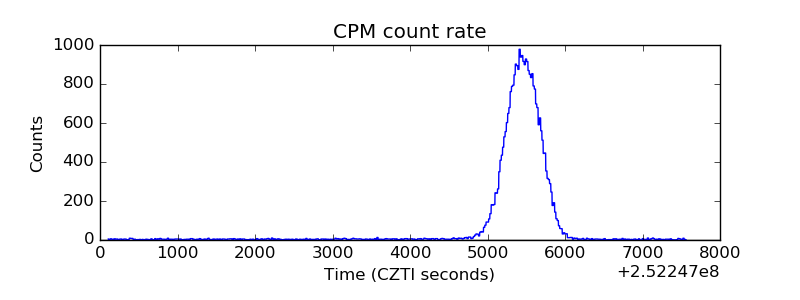 |
| CZT Counter | 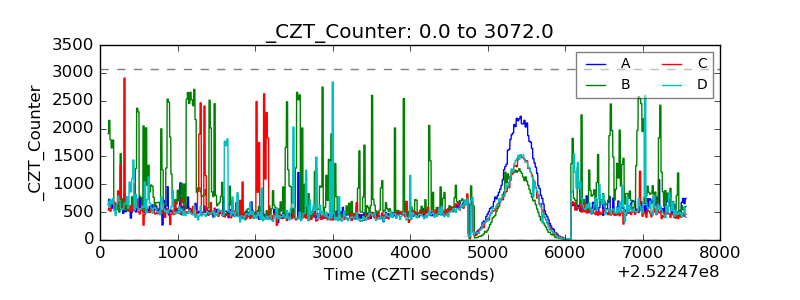 |
| +2.5 Volts monitor |  |
| +5 Volts monitor | 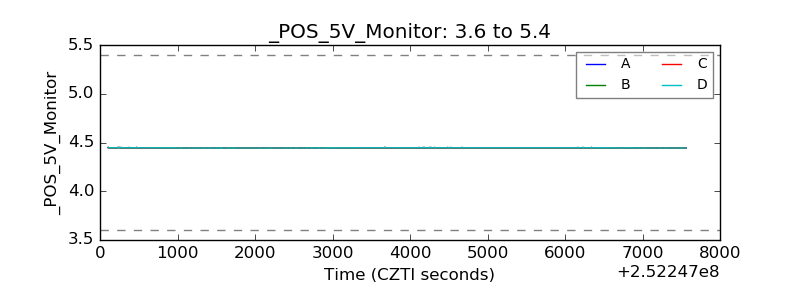 |
| _ROLL_ROT | 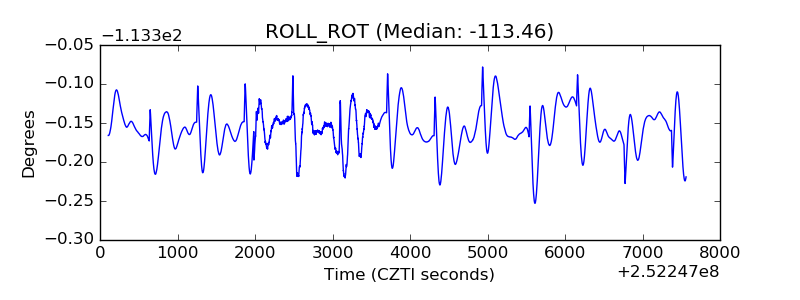 |
| _Roll_DEC | 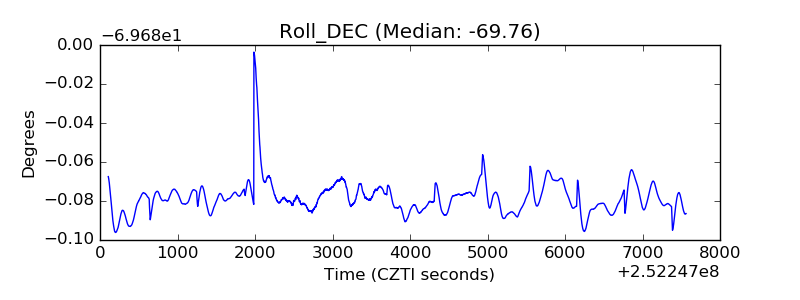 |
| _Roll_RA | 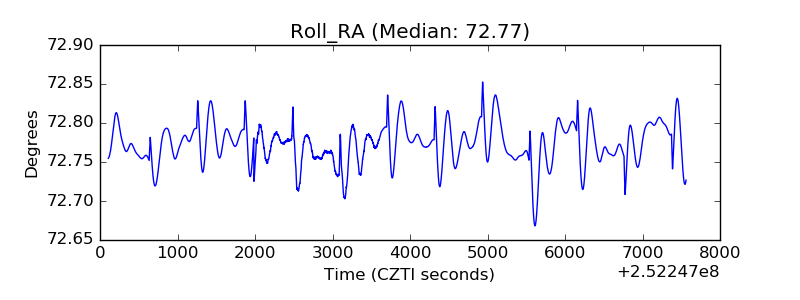 |
| Veto Counter | 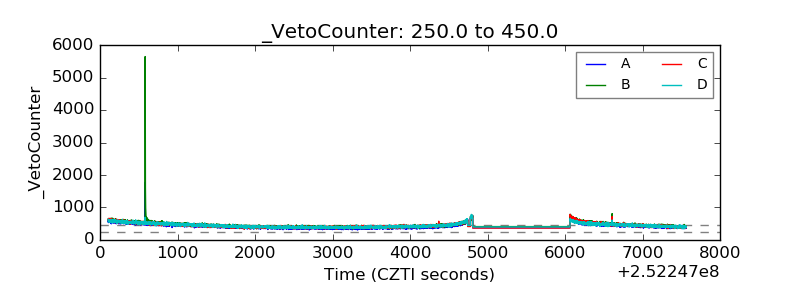 |